We are pleased to announce the release of SciChart v5.2.0. Build 11680 . This is a new version which includes new features and big number of bug fixes and improvements. It is strongly advised for users of SciChart v5.x to upgrade to this version, which is a drop-in replacement.
What’s New in SciChart WPF v5.2.0?
Breaking changes
There are some breaking changes, that will affect users of SciChart.DirectX, Custom Themes and AnnotationCreationModifierMVVM. Please read on. To the rest of the users this version is backward compatible.
users of SciChart.DirectX will now need to update SharpDX to v4.2.0
users who have custom themes will need to add the following three theme keys to their Theme Resource dictionary with color values of their choice:
EffectManager.Instance.EnableDropShadows has been made obsolete, to solve a memory leak caused by WPF {x:Static} MarkupExtension binding. This property is now simply EffectManager.EnableDropShadows. Binding to this property may be achieved through the .NET 4.5 Static Property binding mechanism.
AnnotationCreationModifierMVVM.AnnotationType is changed to – AnnotationCreationModifierMVVM.AnnotationViewModelType and AnnotationCreationModifierMVVM.AnnotationsColection to – AnnotationCreationModifierMVVM.AnnotationViewModelsCollection.
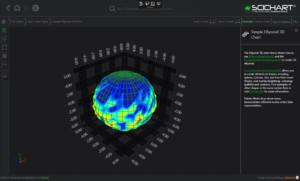
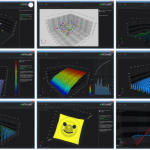
WPF New Chart Type: Free Surface Mesh 3D
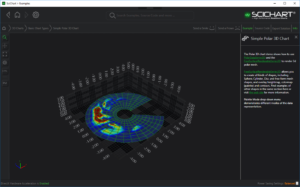
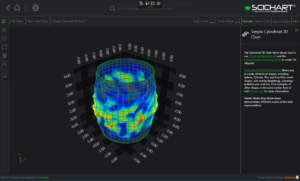
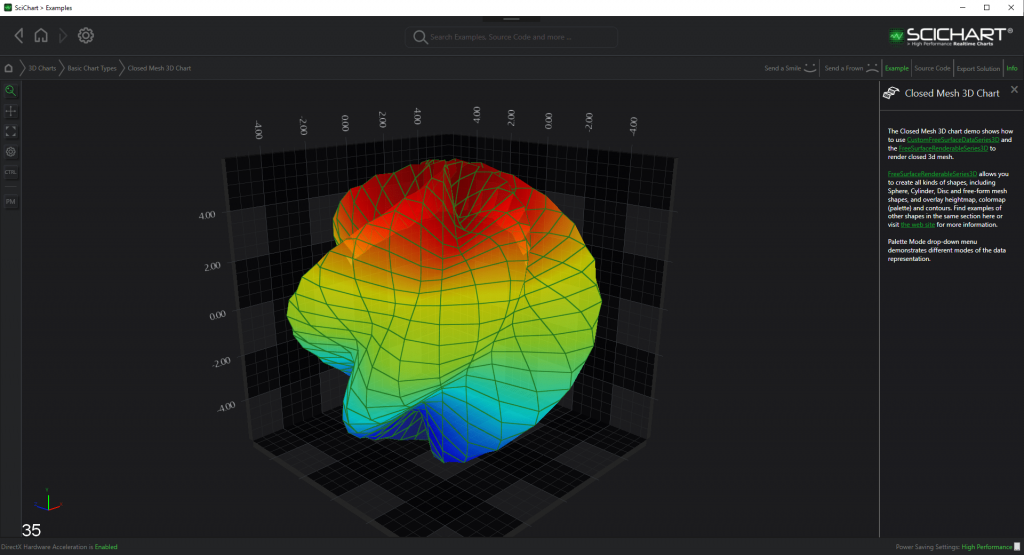
The Free Surface 3D Chart types are a set of 3D Charts that represent the data by plotting the surface in a custom shape in 3D space. The Free Surface 3D Chart types allows to plot both types of charts that constrained to its basic 3D primitive and unconstrained. In other words it allows you to plot charts of all kinds of shapes, including Sphere, Cylinder, Disc and free-form mesh shapes.
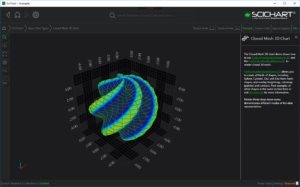
The Custom Free Surface 3D Chart (see documentation)
This chart type allows customization of a chart by overlaying heightmap, colormap (palette) and contours.
The 3D FreeSurfaceRenderableSeries3Dcan be rendered in realtime as well. The Free Surface Mesh colors and palette can be udpated by supplying a MeshColorPalette.
Many mesh options are available such as Wireframe, SolidMesh, Solid with Wireframe, and many paletting options such as Solid Cells, Interpolated Cells and Textured.
Please see an example below and read documentation for SciChart WPF Realtime 3D Geoid:
This new 3D Chart type is available to all customers of SciChart WPF SDK Professional, SDK Enterprise and 3D Professional who are in support subscription, free of charge.
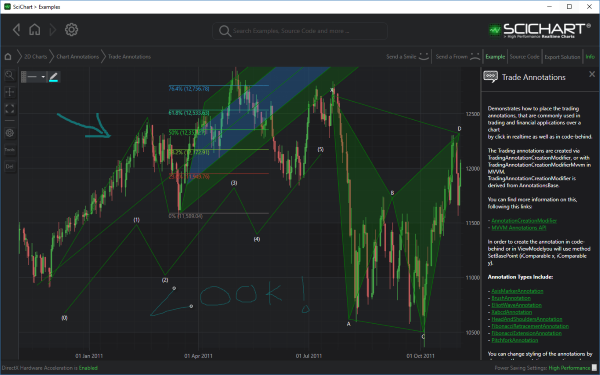
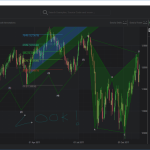
WPF New Feature: Trade Annotations (Drawing tools)
With WPF v.5.2 SciChart features a rich DrawingTools API, includes new drawing tools that will allow you to easily place annotations that are widely used in financial or trading domains at your application .
Fibonacci Retracement Drawing Tool (see documentation) and
Fibonacci Extension Drawing Tool (see documentation)
All the drawing tools are customarily, you may change stroke thickness, line style and colors, etc.
All new drawing tools are in the SciChart.DrawingTools.dll package and are available to all customers of SciChart WPF SDK Professional, SDK Enterprise and 2D Enterprise who are in support subscription, free of charge.
Bug Fixes and Improvements
Fixed a memory leak in DirectX Renderer plugin when PointMarker changed often or new series with PointMarkers created often, cached textures for the marker were not released.
Updated SciChart licensing module to use FIPS compliant algorithms so that SciChart can be used in high security settings
Increased performance of series load by only applying Dropshadow effects to series markers and tooltips in the SciChart XAML Templates when the EffectManager.EnableDropShadows flag is set *and* the tooltip is visible
Fixed issue where creating MVVM AxisViewModel after SciChartSurface is loaded causes Axis.IsPrimaryAxis to be false and AxisAlignment incorrect, which resulted in blank chart
Added missing properties to MVVM Bindings for AxisBase3D: CursorTextFormatting, AxisTitle, VisibleRange
Added a property to AxisBase3D.AxisPlaneBackgroundFill which when set (default Transparent) fills in the entire axis wall in a solid colour
Fixed hit test and tooltip on RenderableSeries3D failing when obscured by a custom BaseSceneEntity
Fixed null reference if Direct3D11RenderSurface.RenderSurfaceLoaded is called after Dispose
Fixed a memory leak where chart was kept alive if LegendModifier was used.
Fixed issue with DataPointSelectionModifier, when XAxisId where set from ViewModel
Fixed SC-4601: DataPointSelectionModifier seems to select incorrect columns in StackedColumnsSeries
Fixed the issue with ZoomHistoryManager when MVVM API is used and AxisBinding is not working yet
Fixed SC-4543: ZoomHistoryManager does not fire RangeHistoryChanged when ClearAllHistory is called
Fixed the issue when ZoomHistoryManager would throw when MVVM API is used and AxisBinding had not worked yet
Fixed Assertion Failed. Martix stackoverflow
SC3D-472: Added true AntiAliasing for text objects in SciChart 3D which fixes white text edge problem
Fixed SC3D-473: flickering that happens when min and max values are very different by not resetting the min and max again when calculating each frame
Fixed SC-4633: when there is no height map texture, the waterfall was broken
Fixed SurfaceMeshRenderableSeries3D crashes for specific dataset
Ported Fix for Direct3D10RenderSurface memory leak from v4.x branch to v5.x. Required some modifications due to changes in v 5.x branch
Added some documentation for performance / memory leak debugging
Fixed an issue DoubleScaleDiscontinuousAxis would not invalidate when the DrawAxisScaleBands property changes
Fixed binding error in default Axis3D style (MVVM)
Fixed bug where last pane in SciChart Group with SciStockChart does not accept mousewheel
Fixed PinchZoomModifier issues
Fixed drawing of StackedMountains for VerticalChart
Fixed ExtremeResampler crash on Arabic Win10
Fixed IsSelected flag on PointMetadata3D not updating the chart
Fixed SC-4502: PointMetaData3D.Parent does not set on XyzDataSeries3D append and insert
Fixed cross thread violation crash when FastHeatmapRenderableSeries is instantiated in an STAThread
Fixed an issue when LogarithmicAxis would throw in TickProvider when used in an MVVM scenario
Fixed SC-4611: LogarithmicAxis and FastColumn didn’t worked correctly
Fixed SC-4564: AutoRange=”Always” broken for logarithmic stacked column series
Fixed FibonacciRetracementAnnotation when used with MVVM
Improved AxisBandsProvider API to be more convenient
Added internal TextBox property in TextAnnotation
Fixed 3D charts with DateTime Z axis issues
Added Labstylecharts 3D Chart example
Fixed SC-4612: CompositeAnnotations as long as Drawing Tools disappear after the export
Fixed SC-4465: SeriesInfo3D provides no access metadata – cannot show point metadata in tooltips
Fixed SC-4626: tweaked C# resamplers as well to correctly handle case when data unsorted and evenly spaced when using Auto mode
Fixed SC-4471: TooltipModifier doesn’t consider size of PointMarkers for ScatterSeries
Fixed VisibleRangeLimit when it should not clip range if VisibleRange min more then VisibleRangeLimit Max when LimitMode is min (and vice versa)
Added SciChartGroup.VerticalChartGroup property to SynchronizeMouseAcrossCharts.xaml
Fixed an issue when StackedColumns would throw when ZoomExtents called and series had not been attached yet
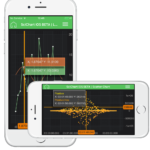
We are really excited to announce, that SciChart iOS/ Android / Xamarin v2.2.1 is released!
What’s New in SciChart iOS /Android /Xamarin v 2.2.1?
There is a large number of improvements and bug fixes made in SciChart iOS/ Android / Xamarin v2.2.1. We have made many improvements and bug fixes, major memory leaks have been fixed. It is recommended for all users of SciChart v2.1 to update to the latest version! Please see more information below:
Changes:
Made SCIChartSurfaceProtocol conform to SCIChartControllerProtocol
Logarithmic axis zoom extents is fixed by SCILogarithmicVisibleRangeAnimator
Bug Fixes:
SCIOS-626: Fixed HorizintalLineAnnotation and VerticallLineAnnotation are not clipped by axes and are drawn over them
SCIOS-642: Fixed issue with on resize of the SCIChartSurface, lay out the axis labels
SCIOS-637: refactored internal scroll and removed velocityValue from improper places, fixed crash caused by SCILogarithmicDoubleCoordinateCalculator not having implemented getVelocityValueFrom
SCIOS-672: Fixed chart sync crash (EOG) – caused by TooltipShowOnTouch
SCIOS-596: Fixed Error during rendering of the first point when ifDigitalLine = true
Fixed major memory leaks in SciRenderable series
SC_DROID-558: added check to prevent exception during generation of minor ticks if there are no major ticks
SCIOS-682: Fixed iOS annotations seem to update independently from the data series
SC_DROID-562: Fixed memory leak in SpritePointMarker when textures were constantly recreated and never properly disposed because of wrong texture hash
SC_DROID-564: Fixed incorrect drawing of axis tick label – because StaticLayout had not enough space to fit label in one string so some labels were drawn as two lines of text;
SC_DROID-566: Fixed some logcat errors when OpenGL code was called without OpenGL context
Fixed SCIOS-687 – surface.Annotations.Clear() doesn’t clear all annotation from surface.
SC_DROID-568: Fixed exception because of how onSurfaceCreated() is implemented in GlSurfaceView ; refactored OpenGL renderer to avoid exception because of missing native memory chunk and made it resizable; also moved OpenGL programs creation so they are created only once
Fixed exception if enable debug prints for CubicSpline
Improvements:
SC_DROID-566: improving OpenGL start up time – changed GLProgram implementation and made it lazy so we don’t initialize all shaders at once when render surface created
SC_DROID-565: added additional render pass data locks to ensure that it won’t be changed from another thread when applying transformation
Added default style values for PieSegment; added some common methods for PieSegmentBuilder
SC_DROID-563: rewritten GLTextureView rendering from scratch – now it uses Handler + Choreographer to schedule redrawing of render surface when VSync occurs in Android
Made custom annotations to support AnchorPoint alignment
SC_DROID-578: added propagating of listeners to child series for StackedSeriesCollectionBase
SC_DROID-561: added synchronized wrapper for SimpleDateFormat to prevent exception when same instance is accessed from different threads, applied the same approach to prevent possible exceptions when using DecimalFormat
Where to get iOS / Android / Xamarin v2.2.1?
You can get the SciChart iOS/Android/ Xamarin SDK v2.2.1 from the Downloads page. Source code customers can also get the latest from our Github repository as well as from Cocoapods for iOS, and Maven for Android. We also keep on delivering continuously for bug fixes, features and minor updates to the following package sources.
For years we’ve operated a private NuGet feed for our libraries in SciChart, however recently we’ve taken the step to publish official releases to nuget.org as well.
Version 5.2.0.11680 has been published to nuget.org and the following packages are now available.
In future we will continue to publish nightly builds and alpha/beta builds to our abtsoftware-bleeding-edge feed, as well as official builds to our abtsoftware feed, but stable builds which have passed testing for official releases will also be mirrored to nuget.org.
In this video below we have taken an example provided by a customer and shown how to improve the performance of SciChart from stuck UI to real-time when there are several series with millions of points and a high proportion of NaN gaps.
If you have a performance issue with SciChart, and you are in support-subscription, then feel free to contact our tech-support team and we will be glad to help!
We’re using the four libraries in SciChart.Wpf.Ui in our SciChart WPF Examples Suite, and also starting to use them in consultancy projects, so we’ve updated them for 2018 to be compatible with .NET Standard 2.0 and .NET 4.6.1, plus fixed a number of bugs & added other improvements.
What’s in SciChart.Wpf.UI ?
So what’s in this mysterious collection of open source libraries? A quick run-down below.
SciChart.UI.Bootstrap
Supporting .NET Standard 2.0 / .NET Framework 4.6.1 and above, this library includes bootstrapper classes for WPF Applications using Unity and allowing automatic dependency discovery across a range of assemblies.
Decorate your types with the [ExportType] attribute
	public interface IFoo
	{
	}

	// This type is automatically registered with the Unity Container
	// Every time IFoo is resolved, you get a new instance
	[ExportType(typeof(IFoo))]
	public class Foo : IFoo
	{
		// Any other registered dependency can go in the constructor
		public Foo(IUnityContainer container)
		{
		}
	}
Create a Bootstrapper and initialize public partial class App : Application
    public partial class App : Application
    {
        private AbtBootstrapper _bootstrapper;

        public App()
        {
            _bootstrapper = new AbtBootstrapper(new UnityContainer(), new AttributedTypeDiscoveryService(new AutoAssemblyDiscovery()));
            _bootstrapper.Initialize();

             // At this point, your container now contains all the types decorated with [ExportType] attribute
             // You may resolve them as normal in Unity
        }
    }
Now your application has UnityContainer powered dependency injection in just a few lines of code!
SciChart.UI.Reactive
The SciChart.UI.Reactive library supports .NET Standard 2.0 / .NET Framework 4.6.1 and above provides observable viewmodels which combine INotifyPropertyChanged event notifications for WPF, and Reactive IObservable streams for observing individual, or combinations of properties.
The main benefit of this library is that it brings the incredible power of Reactive Extensions to MVVM in WPF applications. You declare a class like this:
public class WhenPropertyChangedTests : ObservableObjectBase
{
    public string SearchText
    {
        get => GetDynamicValue();
        set => SetDynamicValue(value);
    }

    public SearchOptions SearchOptions
    {
        get => GetDynamicValue();
        set => SetDynamicValue(value);
    }
}
and now any of these properties raise both PropertyChanged events as well as a reactive stream (IObservable<T>). You also don’t have to create a backing field making all your properties, these are stored in the base class (ObservableObjectBase) in a dictionary.
Properties may now be observed using Reactive Extensions as follows:
void Foo()
{
	// Create the ViewModel
	WhenPropertyChangedTests vm = new WhenPropertyChangedTests();

	// Observe properties
	var observable1 = vm.WhenPropertyChanged(x => x.SearchText);
	var observable2 = vm.WhenPropertyChanged(x => x.SearchOptions);

	// Subscribe
	var disposable = observable1.Subscribe(t => Console.WriteLine($"Search Text = '{t}'"));

	// Set properties
	vm.SearchText = "Hello"; // -> Should output 'Search Text = 'Hello'' to console
	vm.SearchText = "World"; // -> Should output 'Search Text = 'World'' to console

	disposable.Dispose();

	vm.SearchText = "Not observed"; // nothing happens
}
and multiple properties may be observed using Observable.CombineLatest
void Foo()
{
    // Create the ViewModel
    WhenPropertyChangedTests vm = new WhenPropertyChangedTests();

    // Observe properties
    var observable1 = vm.WhenPropertyChanged(x => x.SearchText);
    var observable2 = vm.WhenPropertyChanged(x => x.SearchOptions);

    // Subscribe
    var disposable = Observable.CombineLatest(observable1, observable2, Tuple.Create)
        .Subscribe(t => Console.WriteLine($"Search Text = '{t.Item1}', Options = '{t.Item2}'"));

    // Set properties
    //

    // -> Should output 'Search Text = 'Hello', Options = 'AnOption'' to console
    vm.SearchText = "Hello";
    // -> Should output 'Search Text = 'Hello', Options = 'AnotherOption'' to console
    vm.SearchOptions = SearchOptions.AnotherOption;
    // -> Should output 'Search Text = 'World', Options = 'AnotherOption'' to console
    vm.SearchText = "World";

    disposable.Dispose();

    vm.SearchText = "Not observed"; // nothing happens
}
If you haven’t checked out Reactive Extensions yet and seen what it can do for your WPF applications, or even server-side applications, then do so. It’s brilliant!
The Transitionz library seems pretty popular with WPF developers as it provides a very simple way to animate elements on the UI with just Xaml attached properties.
Transitionz supports WPF / .NET 4.6.1 and above and allows the following effects in your application:
Fade / Animate Opacity
Translate / Animate position
Scale / Animate size
Blur / Animate blur factor
All Transitionz animations may be triggered on:
On Visibility (e.g. Animate opacity on visibility changed)
On DataContextChanged (e.g. trigger an animation when new DataContext attached)
On Loaded (e.g. when the control.Loaded event fires)
or .. Once (e.g. consider OnLoaded will fire each time the control is loaded, wheareas once ensures just one-time operation)
Explicity, by binding to or setting Transition Params
Head over to the Transitionz Library wiki page for more information. We also have a small test-app bundled with SciChart.WPF.UI which demonstrates this functionality.
SciChart.WPF.UI
The SciChart.Wpf.UI assembly supports WPF / .NET 4.6.1 and above, and brings a number of useful controls to WPF applications, and metro styles based on MahApps.Metro. Controls include:
BusyPanelA panel which displays a spinner / hides content while BusyMessage is not null, shows the content when BusyMessage is null.
PopupHostA control to host popups which can be shown inside a WPF app with animated show & hide. The background can be blurred out or made darker, similar to a web popup.
WarningDialogA Metro-style warning dialog which pops up to prompt the user, and provides some Yes/No/Ok/Cancel buttons
Miscellaneous controls and classes, such as the LabelControl, ExceptionViewer,
Where to Get it
The SciChart.WPF.UI libraries are free & open source and may be used in commercial projects under the Apache 2.0 license. Packages are published to NuGet.org and source code is available on Github.
About Us
SciChart is a self-funded and profitable startup based in London, U.K., which specialises in High Performance, Realtime Chart controls as well as expert consultancy in complex .NET UI / Server applications.
Connect with me on LinkedIn to find out more about our background and capabilities. If you have a bespoke requirement and want to hire our world-class consultants, then get in touch!
SciChart iOS currently uses an in-house rendering engine which relies on OpenGL ES for hardware acceleration. While OpenGL ES is currently supported by iOS 12 devices, Apple has announced that they are deprecating OpenGL across all operating systems in the future. Exactly when that will occur we don’t know, but for now OpenGL ES and SciChart is compatible with all Apple devices.
We have been asked a few times by customers, and potential customers whether we intend to support Metal, the new proprietary graphics API by Apple, and the answer is yes, SciChart iOS v3 will support Metal on iOS and OSX.
This work to support Metal has been in progress for a while and is almost complete.
Our in-house rendering engine which uses C++ on Windows, Android and iOS and provides an abstraction layer to multiple underlying graphics APIs including OpenGL, OpenGL ES, DirectX and now Metal. The fact that we use an abstraction layer for drawing 2D & 3D Charts means we can also support new rendering technologies such as Vulkan should they become the only option on Android devices.
Be looking out for announcements and news on our site in the coming months! We are really excited to bring our 3D Charts to iOS/Android/OSX platforms and to continue building our vision of cross-platform native charts for the financial, scientific & engineering industries!
Our implementation of Metal for drawing will be packaged and published with SciChart iOS/Android v3, which will include 2D & 3D charts and is due for release in Spring 2019.
In February of next year, SciChart will complete it’s seventh year of providing high performance, flexible & visually impressive WPF charts to customers around the world. We’re really proud of what we’ve achieved as a startup which initially formed in 2010 by one person, with no capital, debt or investors, to serve now almost 6,000 customers worldwide, have a turnover in excess of a £1m pounds ($1.4mm USD) / year, high profitability margin and fiscal growth of 600% over the past 7 years.
It’s a fact that our company is continuing to grow and we’d like to expand our team, adding +3 headcount to our C# team for the following roles.
You will be joining our team of C# WPF developers to work on SciChart: High Performance Realtime Charts for Financial, Medical & Scientific Apps.
Over the next year we intend to be adding features including:
Multi-threaded rendering with async/await
Animations & Effects
New 2D & 3D Chart Types
.NET Core 3.0 Support
You will be part of the team responsible for delivering these features. Also you will work with customers in written English as we encourage direct contact with customers for tech support over email.
There are learning & development opportunities to cross over into our other technologies / business areas, including:
iOS 2D & 3D Charts (Objective-C, Swift)
Android 2D & 3D Charts (Java, Kotlin)
Xamarin & (Future) Xamarin.Forms Charts
(Future) WebGL based charts
Consultancy & application development for customers of SciChart
SciChart is embarking on an ambitious multi-year project for one of our clients to develop a cross-platform, multi-asset trading system which will utilise our High Performance Charts in WPF, as well iOS & Android (mobile) platforms. This is a green field application with a chance to develop something incredible from the ground up.
Technologies will include:
C# / .NET Core Server application for cloud deployment
Live streaming of financial prices from multiple exchanges
SignalR / Websockets for push notifications
Rest / Swagger
Strong emphasis on Rx (Reactive Extensions) and Tpl (async/await)
MongoDB
SQL Server (T-SQL)
In addition, there may be opportunity later in the project to work on other aspects of the system including
Python trade scripting
Algorithmic Trading
Machine Learning
Mobile or Windows clients
A background in trading and knowledge of Rx / TPL is a must. For this position we’re looking at expert level developers who want to join a challenging, long term project.
How to Apply
Both jobs are listed on Upwork under SciChart, however we also encourage direct applications by contacting us with a CV and cover letter. If you do apply make sure to include relevant samples of work, as much evidence as possible as to why you’re the right candidate, and also why you want to work for us!
Where are we located?
Our offices are based south of London, U.K. as well as Lviv, Ukraine.
We welcome flexible work and remote work if the candidate is right!
We are pleased to announce the release of SciChart v5.2.1. Build 11757 . This is maintenance version which includes a number of bug fixes and improvements. It is strongly advised for users of SciChart v5.x to upgrade to this version, which is a drop-in replacement.
What’s New in SciChart WPF v5.2.1?
Bug Fixes and Improvements
SC-4730 Fixes SciChart WPF Licensing Wizard not found in Start menu after installation
SC-4742 AccessViolationException in WriteableBitmapExtensions.FillRectangle
SC-4740 Heatmap crash with export and colormap defined inside of series
SC-4738 Huge font for superscript axis labels for certain regions
SC-4736 SciChart.ExternalDependencies resources don’t work from NuGet
SC-4721 When AxisBinding MVVM API used, and HorizontalGroupHelper.HorizontalGroup, XAxis is blank
SC-4687 Rarely broken bindings due to ElementName bindings
SC-4728 ExportToStream ignores size parameter,
SC-4724 Add handling of SetBasePoint nullreference exception
SC-4725 Fixed Fix SetBasePoint for DrawingTools
SC-4654 Fixed DrawingTools: PitchFork fill outside the annotation
SC-4653 Fixed DrawingTools: PitchFork disappearing fill
SC-4652 Fixed DrawingTools: Head & Shoulders disappearing fill
SC-4663 Fixed DrawingTools: FreeDraw – quite hard to hit-test for dragging
SC-4678 Fixed FreeDraw DrawingTool – cannot delete or change it when selected second ime
SC-4661 DrawingTools: add FontSize to PaletteControl for Fibonacci annotations
SC-4680 Contours With Heatmap – tooltip always report ZValue as NaN
SC-4658 DrawingTools: hit-test should work when clicked on a filled area of an annotation
SC-4668 Realtime Waterfall 3D crash
SC-4677 Fixed CursorModifier SnappingMode stopped working
SC-4060 Application crash after multiple load & export
SC-4607 always pass in texture width and height of sprites, wo when sampling the offsets are taken properly
Fixed the issue when RenderableSeries.GetXRange() would throw if the DataSeries wasn’t assigned
SC3D-481 ColumnRenderableSeries3D won’t draw if PointMetadata is not provided and XyzDataSeries3D used
SC3D-480 PointLineRenderableSeries3D line color does not respond to PaletteProvider
SC3D-479 Camera3D properties have DependencyProperty Precidence issue and cannot be bound when SciChart3DSurface inside a control template
SC3D-478 When Theme Changes series are sometimes removed in SciChart 3D
Fixed incorrect 3D text rendering, where string contains characters from different Unicode pages
Added ContextMenu binding from internal annotations to DrawingTools annotations
VHN-744-33548 Fixes PointLine 3D line color
Made the GetIndicesRange method virtual
In WaterfallSceneEntity switched coordinates calculation from float type to double, to increase a precision
[SVW-595-49808] Error in Gradient Fill Direction Along Y Axis
[QTL-387-74220] 3D charts with DateTime Z axis issues
Fixed the issue when an OHLC data series has all data points as NaNs and AutoRange would not work correctly for all other series
Improved SciScrollBar when with DiscontinuousAxis
Added missing XML comments on AnnotationCreationModifierForMVVM
Fixes binding errors in DefaultAxisTitle in some systems which use SciChart with MVVM API. Improves performance of SeriesBinding MVVM API
Our team wishes you all the best for the Holidays season. Thank you very much for your being with us this year and we are looking forward to making more beautiful software in 2019.
Office Opening Hours
Our offices will be closed on Tuesday 25th & Wednesday 26th December. During this time we will handle the most urgent enquiries either such as complete blockers (my live application has crashed etc)… Everything else will be delayed until Wednesday 27th.
Our offices will also be closed on New years day 1st January and 7th January 2019.
Finally between 25th December – 2nd January 2018 we will be operating with a skeleton crew. The response time for forum & support requests will be longer than usual.
Our team will be back in earnest in the first week of January and we will be ready to pick up where we left off.
Finally, we are wishing you a warm and happy Christmas and New Year! See you soon!
Recently one of our customers has given us to post a case-study about SciChart in their application. This is now viewable at our www.scichart.com/case-studies-consultancy page. Thank you to the customer! We love working with you! – SciChart Team
Customer Case Study – Quantitative Trading Application
“In the past we experienced a lot of pain with other third party chart controls, which failed to deliver over time”
“SciChart looks to be a great product, and has proven to us that a general-purpose chart control can be used within a specific scenario to create high performance, big data analytics applications.”
SciChart has recently carried out a licensing + consultancy project alongside a customer, a highly successful Quantitative Trading firm and global private investor. The Client’s focus is on technology and financial sector opportunities. Leveraging the unique understanding of risk management, they utilize complex quantitative research methods and leading-edge technology to develop world-class trading strategies.
The Client had a need for a powerful, general-purpose charting control, which any of the client’s application in the Windows environment should be able to use. In addition, there was a need for an application that will allow visualization of key trading related metrics using charts.
SciChart has provided our turnkey WPF Chart Software as well as developer hours as part of a licensing & consultancy deal, spanning more than a year and currently ongoing.
Read the full PDF below to find out more about how SciChart can be used in Quantitative Finance & Big Data applications, as well as the features achieved by our best-in-class WPF charts.
If you have a requirement for a charting application, and would like to hire our world class consultants, or, if you would like more information about our turnkey WPF, iOS or Android Chart components, please get in touch by contacting Sales.
The SciChart Forums are a super popular resource for customers and trial users of SciChart to ask questions how to do things, how to add certain features to the chart in either WPF, or iOS/Android platforms. Over the years we’ve collected no less than 2,388 forum questions about our charts, which have been answered mostly by our staff and sometimes by the community to!
There are however a lot of duplicate questions on the forums, and sometimes the same thing gets asked again and again… In order to help reduce this duplciate content, and to help you find answers faster, we’ve invested in adding a custom search feature to the forum.
As soon as you type in the Question box, it will now start to search the SciChart site documentation, forum questions and knowledgebase articles, returning the most relevant results. Results are powered by Elastic Search, which doesn’t exactly give the same high precision results as Google, but it is a powerful, open source search engine that provides pretty decent results on multiple sources combined. We’re hosting the search engine on a linux server, separate to the SciChart website. You can check out the test interface at https://search.scichart.com. Our forum now requests results from search.scichart.com as you type, hopefully, providing you with very useful results!
Further investment on the horizon
Watch this space as we’re hoping to invest further into small systems like this to give you a better user experience, and to help us to grow into the company we envisage, which is market leader in fast, flexible, powerful, charts on all major platforms.
If you have feedback about this system or wish to suggest some improvements, as always, we welcome you to contact us!
This is a very early prototype … but we wanted to share with you some exciting news … SciChart is working on a High Performance, Realtime Javascript Chart Component for the Web.
SciChart.js – in progress now
Known as SciChart.js, this component will utilise our extensive 2D & 3D rendering engine built in C++, we currently use across our market-leading WPF, and iOS & Android Charts. Our proprietary rendering engine provides us with the ability to draw primitives in Immediate-Mode rendering at extremely high speed as well as high performance 2D & 3D Charts on multiple platforms. Millions of lines and thousands of primitives on screen at once at not a problem for SciChart. Our rendering engine has been successfully compiled to WebGL and WebAssembly , a new native binary format for the web, enabling native speed by taking advantage of the CPU and GPU. All in a cross-platform, browser-based, javascript compatible package.
Traditional chart components for the web tend to be based on Javascript or Typescript and the HTML5 Canvas, however these are simply too slow to be able to display large amounts of data required for creating big-data applications, or realtime applications that require higher performance in the browser. SciChart however is an excellent choice for applications that require big-data visualization or applications that require real-time charts such as medical applications, or financial trading applications and we are excited about the prospect of WebAssembly for totally changing the web in the future.
So what will SciChart.js be able to do?
Well we are aiming to support our whole host of 3D Charts that we currently support in WPF (Windows), and soon iOS and Android, in the web browser for the first release. We intend the library to be fully compatible with vanilla Javascript applications as well as ASP.NET, Knockout.js, Angular, React and Vue.js.
We’re aiming to support big-data and real-time streaming 2D Charts for Javascript shortly afterwards, by releasing a 2D version of scichart.js for web applications.
OMGOSH When will it be ready?!
The first question we’re going to be asked is ‘When will it be ready!!’ We can’t tell you that just yet … It’s a big job to get our charts ready for the web, but we have already made a start a short while ago. Because we took the steps in the past to port a lot of our drawing code over to C++ for sharing with multiple platforms, its going to be easier to produce a new Fast Javascript Chart Component utilising WebAssembly and WebGL, as we are moving toward a shared code-base model as described in our Vision & Roadmap document.
So we will keep you updated. We hope to have some more results in a month, as we continue the compilation and bug fixing of our rendering engine in WebAssembly/WebGL.
SciChart is also available for mobile devices, allowing extremely high performance charts on the iOS and Android Platforms. You can find out more about SciChart by visiting our website, or watching one of the videos below.
This year we have a lot of exciting releases planned. We have been working very hard behind the scenes on research & development to improve our existing set of products, plus create new products. This work is often hidden from view but we want to give you an insight into what we are working on and when we hope to release!
SciChart – Achievements so far
We last published a roadmap two years ago and discussed how its our intention to become market leaders in cross-platform, high performance real-time charting. That was an ambitious plan for a small, privately owned company like ours without any external funding or debt! However, we are well on our way to achieving it. Here is a run-down of what we’ve achieved since the last roadmap update.
2012 – 2016
Oh wow, this is how the website looked in 2012!
We were just getting started really, during this time we went from zero (just a guy with a laptop) to a team of about 7, releasing versions 1, 2 and 3 of our WPF charts.
It’s funny to look back at those days and realise how bad our graphic design was!
April 2016
WPF 3D Charts were released in 2016
We released SciChart v4 which included WPF 3D Charts. The 3D Charts have been extremely successful and are used by companies all over the world to carry out complex, hardware-accelerated visualization of data in 3D. This work also pushed us into the position of Market Leader for High Performance WPF Charts, pushing us past our main competitors in volume (number of licenses sold).
In addition, we released hundreds of bug fixes & minor updates via our Nightly Build / NuGet feed, and have also been working very hard to move more of our chart code to C++ (the original cross-platform language) to allow us to complete our vision. These sort of things you don’t see but are a huge piece of work required to make the next steps possible.
SciChart – The Roadmap for 2019
The coming year looks set to be packed with releases which will include the following.
Just Released (now)
We just silently released a documentation update for all our three platforms. Find information more easily with improved google search results as well as a cleaner, easier to read theme. Also the Forums now have an auto-search function which has already helped reduce the number of duplicate questions!
Releasing in next 4 weeks
SciChart WPF v5.3 is in testing for release very soon, which will include Animation Functions on series, ability to rotate Polar charts natively (a many times requested feature), and option to avoid Tooltip Clipping when many charts close together (another hotly requested feature) plus many reported bug fixes.
SciChart iOS v2.5 will be released very soon with a patch to support Metal as well as OpenGL ES for the latest iOS devices.
SciChart WPF v5.4 will feature .NET Core 3.0 Support, which is in progress now and we believe will be ready before the Microsoft release of .NET Core 3 for Windows Desktop Applications
We are shortlisted for a major award which is being announced in just over a month! We can’t talk about it just yet but we are super excited (and crossing fingers and toes) hoping that we stand a chance of winning! …
We are rolling out a Features Request system on the website, allowing you to suggest features & vote on them. Vote power will be linked to your purchase history, so higher value clients will have more vote power. We will only be doing feature requests logged in the new system, so when it is released, get voting!
We are rolling out improvements to the Knowledgebase, search and support desk. These include closing the support desk to non-paid customers and ensuring that you are given relevant search results when you first request support.
We will be removing the lower cost, no-support option for our charts, instead, introducing multiple support tiers including standard and enterprise; which may include remote support, to add value to enterprise clients who demand the best and most effective support channels.
We will be releasing a new, cross-platform Licensing Wizard, written in Electron & React, it will work on Mac OSX and Windows desktops, allowing you to activate licenses, get news about updates and more on all our chart platforms.
Releasing later this year
Mac OSXsupport for our iOS Chart library. We have delayed this release for now as we wanted to focus on the re-work of our iOS charts to include 3D & Metal, but the code is largely portable. We aim to refocus on Mac OSX support soon.
SciChart.js:fast, realtime javascript charts using our C++ rendering engine ported to WebAssembly and WebGL to allow streaming, realtime 2D & 3D Charts for the web, Electron, React, Angular and Vue.js applications. This is a very exciting project which started recently. We have some early results that our charts will work in a browser and will be developing them over the course of the year.
A feature packed year!
Thank you for your continued support of SciChart. We wouldn’t be where we are today, without you, the customer. To say thank you, we have a feature-packed year planned for you!
Remember that if you are a customer of SciChart, you will receive all major & minor releases that fall within your support subscription plan. It makes good sense to keep up to date and to renew SciChart WPF, iOS or Android so that you get the latest releases.
If you haven’t yet purchased but are thinking about doing so, take a look at the above, we have come a really long way in a short period of time and we believe the best is yet to come!
As always, we welcome your feedback and comments. If you have something to say, good or bad, please contact-us, as it can help shape the business.
As part of ongoing work to improve the user-experience for our customers, we have just quietly rolled out improvements to our documentation for WPF Charts, iOS Charts & Android Charts.
Changes include:
A brand new stylish theme in SciChart Green!
Easier to read pages with cleaner styles.
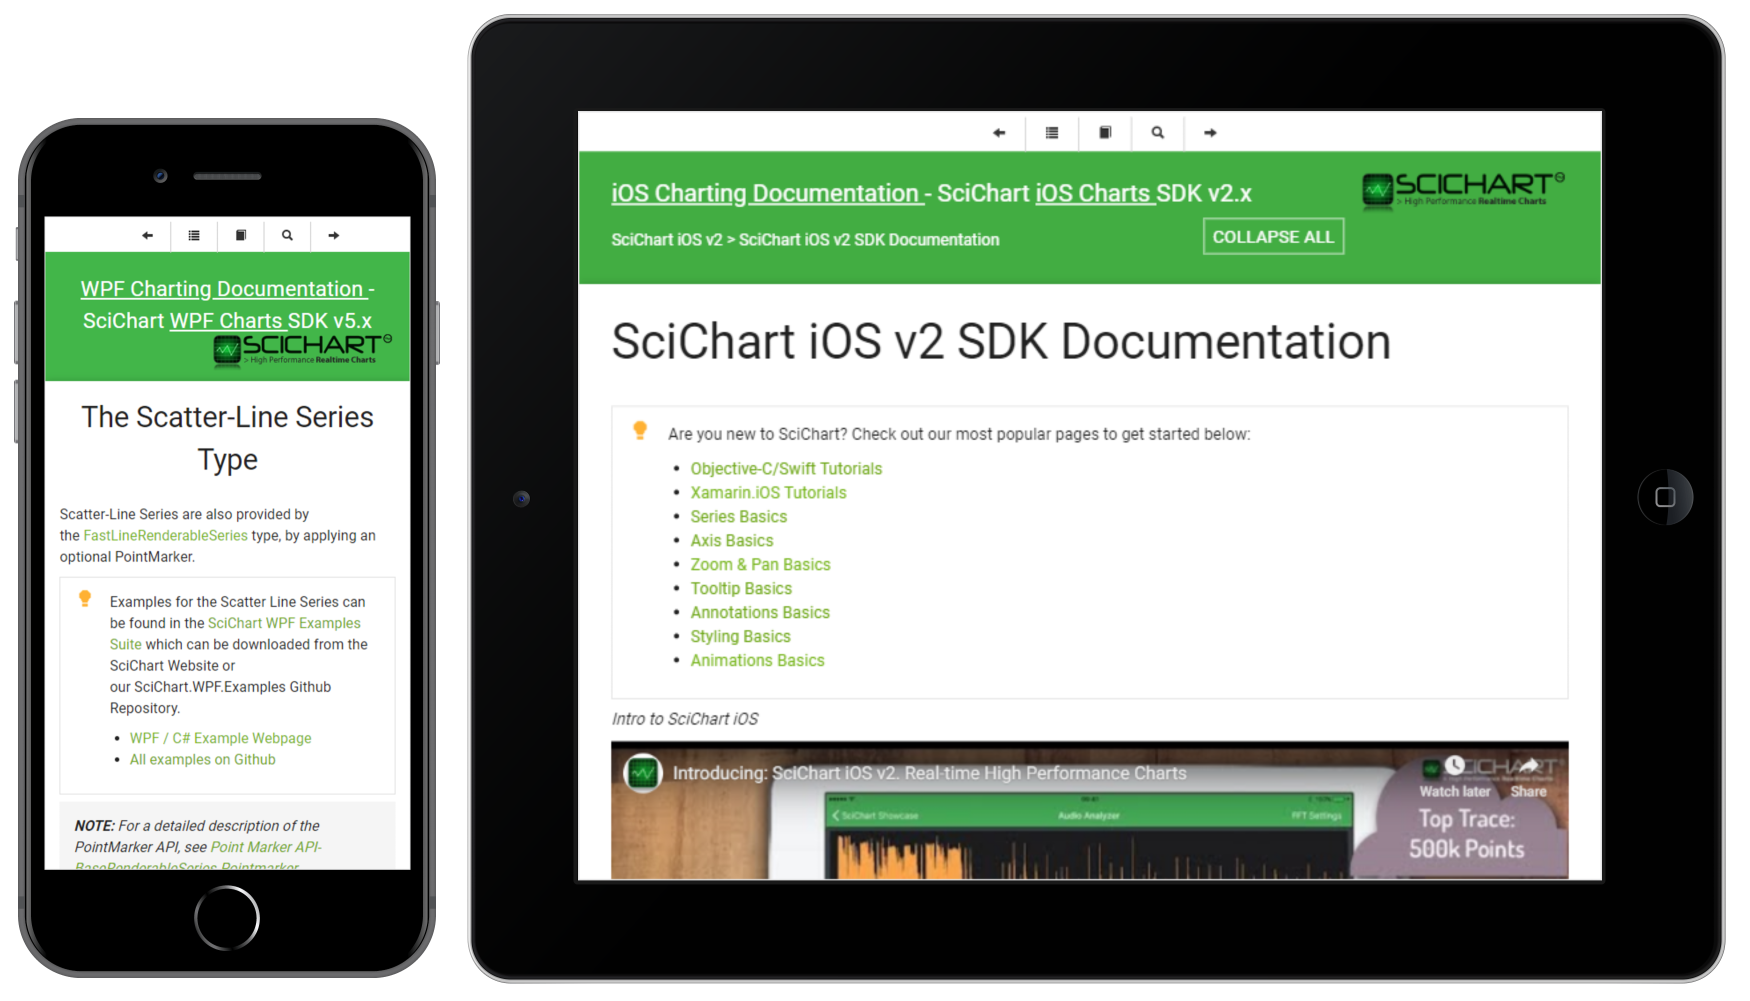
Responsive output for mobile & tablet devices.
Many small corrections and improvements to the documentation.
Making it easier to find information via Google using Title tags and structured data.
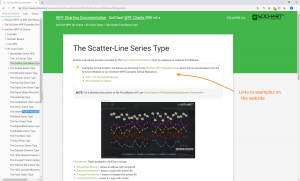
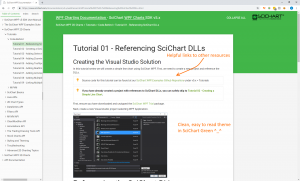
It’s now easier than ever to find what you need from Google
Useful related links are now scattered throughout the docs
A new, responsive theme in SciChart Green!
You can check out the documentation for our iOS Charts, Android Charts and WPF Charts here:
SciChart’s Charts have hundreds of hand-written documentation pages across our platforms, as well as thousands of automatically generated pages from actual .NET/Xamarin assemblies, Java libraries, and iOS Frameworks.
By creating documentation which is easy to read, easy to search, we believe it will make your day more productive as you work with SciChart. All of our documentation is online, and indexable & searchable via Google. Just try now googling for something like ‘SciChart RolloverModifier Custom Tooltip‘. There’s a high probability you will find the information you need!
Responsive design for tablet & mobile now means you can view our chart documentation on your favourite device[/caption]
More improvements on the way
We’ve recently delivered automatic search of the forum as you type questions, and more improvements are on the way soon, such as a feature-request voting system, and intelligent search as you open support tickets.
We are pleased to announce the release of SciChart WPF v5.3, build 11899 . This is a minor update which includes a number of bug fixes, improvements, and new features. It is strongly advised for users of SciChart v5.x to upgrade to this version, which is a drop-in replacement.
What’s New in SciChart WPF v5.3?
New features
WPF Chart Animation Functions
SciChart’s WPF Chart now features a new WPF Chart Animation API. Animated WPF charts will make your applications more appealing to you and your customers.
There are four standard animation types introduced in SciChart WPF:
Fade Animation
Wave Animation
Sweep Animation
Scale Animation
Animations have been included in several of our WPF Chart Examples. You may see them in the video below.
SciChart’s WPF Chart Animations API is made flexible so that you can control when an animation starts and stops, the animation start delay and animation duration. There are also several predefined EasingFunctions available in WPF, that would allow to further adjust the animation behaviour.
This is a new feature added to the polar chart, which will allow you to set the rotation of the Xaxis so that the zero is at any angle. This often requested feature will allow you to have polar Charts with the 0,360 degree mark at the top of the chart.
Show tooltips as popup option:
If you have lots of charts on the screen, or a small chart size, it was often reported that the tooltips would be clipped at the edge of the chart. With this new feature, you will be able to place a tooltip in a WPF popup, which will allow the tooltip to behave more like a standard WPF tooltip.
To enable tooltips to show up as popups just use the property: RolloverModifier/CursorModifier/TooltipModifier.TooltipUsageMode=”TooltipControl, Popup”.
An ON/OFF option to show tick labels only on chosen planes in 3D Charts:
You may now choose which planes would be showing the tick labels in the WPF 3D charts. For examples by setting the following properties on the SciChart3DSurfcae:
Almost 50 bugs and minor issues have been addressed in v5.3 since the last stable release. Bug fixes are shipped first in our nightly builds and are bundled up and tested for stable releases.
Fixed the issue with scrolling when DiscontinuousAxis is used
Fixed Static axes with changed Minor\Major delta takes no effect and no re-drawing.
Fixed SC-4747 BorderThickness and BorderBrush missed when export with clone
Fixed the issue when a Scrollbar would jitter if the track dragged when stuck at either end of the scroll area
Removed TypeMarkupExtension and FasterRandom has been moved to SciChart.ExternalDependencies. This removes all CPOL code from the commercial SciChart library
Removed class LayoutTransformer due to CPOL Open Source license objection by one of our customers. Have used default WPF ‘LayoutTransform’ instead
Removed s:Static markup extension (CPOL) Open Source license objection by one of our customers. Have used default WPF x:Static instead
Changed DataContext of child annotations in TradeAnnotations
Fixed annotations not exported when VerticalSliceModifier added
Fixed SC-4759 where VerticalLineAnnotation with String LabelValue would throw with a TimeSpanAxis
Fixed SC-4758 duplicate AnnotationLabels when removing and then add same annotation instance in MVVM
Fixed Directx 2D Bubbles when they are big, refactor to use just one TEX Coords
Our approach to product feedback & feature requests
Here at SciChart, we take product feedback extremely seriously.
We have built our company from the ground up by listening to customers, their team members and prospects – by taking their ideas & suggestions on board – to build the best WPF, iOS & Android Charts in the world!
We use your feedback to identify the most important features, ideas, pain points, and opportunities so that you can get more value from our product as efficiently as possible.
How to give us your product feedback
Submitting your feedback couldn’t be simpler! We have just implemented a new Feedback & Feature Request System, which will allow you to submit your requests directly to us.
To use it, click the button in the right sidebar of the website.
Request a Feature
To request a feature, click on the button ‘Submit a Feature Request’. Please give us as much detail as possible including images to show what you need and why.
Vote on Features you want
You can vote on features. If you want something, vote on it, or click the ‘I want this’ button. If you don’t want something, click the ‘I don’t want this now’ button.
Set your Feature Priority
Prioritise your features by using the sliders in the app. The priority will tell us what you need the most.
Leave Comments and Discuss!
Don’t forget to leave comments or discuss feature requests. The more info we have from you, the better!
What Happens to your Product Feedback
Any of our customers, trial users and prospects with a scichart.com account can request a feature, or vote on a feature-request by clicking the link in the right of the website.
New Requests
All new requests are set to ‘Awaiting Feedback’ status so that more people can vote, prioritise and give us information. This allows us to gauge demand, gather use cases and automatically establish impact and value.
Setting Priority
Every month, our development team holds a product feedback meeting. We discuss the highest priorities for our customers, team members and prospects and look at how feature requests align with our own strategy. As the team goes through, they will update the status of each feature request in our system so you can immediately know the outcome.
Creating the Roadmap
If we decide to build a feature or make an improvement, the status will be changed to “Planned” or “Building”. It will be added to our product roadmap which you can view at any time.
Anyone who has submitted or voted on a specific request will be notified when the status so the request if updated. We will always provide an explanation as to the nature of the status update.
Our product feedback portal always has the most up-to-date information about our products and what we are building next.
If you reach out directly to our Support or Customer Success teams, they’ll be able to look up ideas for you, but they won’t have any additional information or provide an estimate for when your request will be reviewed.
How are Votes weighted?
Votes toward feature requests are weighted in two ways.
The first, is by the number of votes on a feature request
The second, is by the relative voting power of the people requesting.
Number of Votes
If we receive a feature request which has a high number of votes, it will be prioritised higher in our product roadmaps. For example, if 100 of you get together and voted for an insanely cool widget, then that widget we will build.
Voting Power
As a SciChart customer, trial user or prospect you will be given a Voting Power value. This value changes depending on the product(s) that you have purchased with SciChart. Simply put, customers with higher product tiers have a higher voting power.
If we receive a feature request with fewer votes, but each vote had a higher power, then it is likely we will build this item also.
Voting power is calculated as follows:
License Type
Voting Power
Trial user
Support expired customer
1
SciChart WPF, iOS or Android 2D Professional
2
SciChart WPF SDK Professional
SciChart WPF 2D Enterprise
3
SciChart WPF SDK Enterprise
4
If >90 days support remaining
Add +1
If >365 days support remaining
Add +2
For example:
A customer who has 5 licenses of SciChart WPF SDK Professional with 2-years support remaining will have a total voting power = 3+2 = 5 per developer, and 25 if all developers vote on the same features.
A customer with a single SciChart 2D Professional and < 90 days support remaining has a voting power = 2.
A customer with two licenses of SciChart iOS/Android 2D Professional and > 90 days support remaining has a voting power = 2+1 = 3 per developer, and 6 if both developers vote on the same features.
Each of your votes for feature requests count, no matter the voting power, but it gives us another angle to view the relative weight or value of requests to our user-base and help us to prioritise the roadmap.
FAQs
How long will it be before the product team reviews my idea?
Items will be reviewed by the product specialist on a weekly basis; we take the top requests and update the status where appropriate. Road-mapping meetings occur monthly. Make sure your ideas are clear and concise so others can vote on it & prioritise. Also be sure to prioritise your own requests too! That way, we will know if a particular request is important to you.
Can I fast-track a feature request?
We will build the feature requests that align with our roadmap and also are the most popular / most valuable requests from our customer-base, but what happens if you want to fast track a request?
There are some instances where you might need a feature asap. In this case – you can consider hiring our team as short-term consultants. We’ve carried out a number of projects for customers where we have built new features specifically for them and they have been a great success!
Why hasn’t my request been reviewed?
If we haven’t reviewed your item yet and it is a high priority for you:
Make sure it’s at the top of your priority list
Make sure your request is clear. Why do you need this? What is it stopping you from doing? What is the impact of that? Please add these details in a comment on your idea.
Thank you for your feedback, understanding, and support as we work together to build the best charts for WPF, iOS and Android!
It’s hard to believe, but this month in March 2019, SciChart WPF is 7 years old!
Version 1.0 of SciChart WPF was coded in a spare room, first released in March 2012, and was the first WPF Chart control in the world to incorporate fast, immediate-mode drawing (bitmaps) into XAML based WPF Chart controls. This literally changed the market & made previously impossible projects become possible, because at the time existing WPF charts were not able to draw large datasets, or update fast or in realtime.
A performance comparison published in 2012 by Scott Logic showed how far SciChart and one other competitor at the time (Visiblox, now discontinued) outpaced the market in terms of chart performance: both competing for the title of ‘fastest WPF Chart’ with high drawing speed and efficient memory usage.
Fast forward to 2019, SciChart is now a feature-rich, XAML/MVVM capable WPF Chart control, capable of drawing many millions of points in realtime, with dynamically updating charts, and used by thousands of developers worldwide.
Finally, a huge thank you to our customers for making SciChart what it is today! We wouldn’t have done it without your feedback, trust in our company and support.
What’s New in SciChart iOS /Android /Xamarin v 2.5?
There is a large number of improvements and bug fixes made in SciChart iOS/ Android / Xamarin v2.5. It is recommended for all users of SciChart v2.2 to update to the latest version! Please see more information below.
// in Swift:
surface.renderSurface = SCIMetalRenderSurface(frame: surface.bounds)

// in Objective-C:
self.surface.renderSurface = [[SCIMetalRenderSurface alloc] initWithFrame:self.surface.bounds];

//in Xamarin:
Surface.RenderSurface = new SCIMetalRenderSurface(Surface.Bounds);
Please note this code should be called after initialization of SCIChartSurface object, before creating any axis, series, or styles.
Also, it is advisable to detect if the current iOS version and the current device has the full support of all the Metal features used in SCIChart using the code below:
// in Swift
if SCIChartSurface.isMetalSupported {
   surface.renderSurface = SCIMetalRenderSurface(frame: surface.bounds)
}

// in Objective-C
if (SCIChartSurface.isMetalSupported) {
   self.surface.renderSurface = [[SCIMetalRenderSurface alloc] initWithFrame:self.surface.bounds];
}

//in Xamarin
if (SCIChartSurfaceView.IsMetalSupported) {
   Surface.RenderSurface = new SCIMetalRenderSurface(Surface.Bounds);
}
We would recommend testing on multiple devices before deploying any apps to the App Store with the new Metal render surface. The OpenGL surface is fundamentally the same and considered the best choice for production apps at this time. Finally, we would really appreciate your feedback on the new Metal renderer.
New iOS and Android Documentation
The documentation for iOS Charts and Android Charts now has a new stylish theme, so it is easier and more pleasant to read. We have also taken care of making it easier to find just what you need via Google using Title tags and structured data. It is responsive and works great on all devices including tablets and mobile. There have been many small corrections and improvements made to the documentation and there is more to come!
Bug Fixes for iOS:
Updated: bindings of SCIMetalRenderSurface to have a proper constructor
Fixed: append and FIFO test cases for SciChart
Fixed: memory leak on OpenGLRenderSurface deallocation Made SCIChartSurfaceViewBase.renderSurfafe property strong to avoid warning
Added: allowing to draw outside of the main scene/end scene sequence + create the regular polygon texture once they are required + comment on the pre-creation;
Fixed yellow triangles in point markers example: new drawing command for raw triangles
Fixed: errata in swift example for scatter series
Fixed: global angle for AquireRegularPolygonSprite
Fixed: brush initialization
Fixed: styling/theming examples
Fixed: Multi-stack chart: use a projection matrix that doesn’t clip in screen space; gradient texture areaways horizontal ( width x 1 ); gradient texture need clamp sampler; approximate the output to match OpenGL by modulating the alpha of the gradient colors.
Fixed: columns don’t appear in swift examples due to long* conversion to SCIGenericType
Fixed SWIFT: heatmap chart example
Fixed for Metal: crash with logarithmic axis where there were no major ticks
Fixed: heatmap red spots issue
Fix for Metal: broken line colors ( fade should be on alpha )
Fixed for Metal: gaps between lines, new metal shaders, also AA lines should only be fading with Alpha on its edges, this way we can evade the 1.5 hackexp fixes for lines in metal
Fixed for Metal: spline line examples
Fixed for Metal: setting wrong screen size to global shader content
Fixed: the multi-surface example, by making sure the correct width and height are passed down
Fixed for Metal: ellipses example crash
Fixed: black screen while app in the background
Added display link to metalRenderSurface to bring back animations
Removed obsolete methods on renderSurface Metal
Multi sampling 4x enabled and 2x multi sampling
Fixed for Metal: drawing of grid-lines\bands with properly saving\restoring matrix state
Fixed: SetDrawingArea command
Fixed for Metal: errata in SetClipRct and updated Translate code
Fixed for Metal: scaling for lines
Fixed: memory leak in HeatMap chart examples
Fix for Metal: lines thickness to match with OpenGL
Fixed: black bar at the bottom (iPhone X)
Fixed for Metal: Colormap
SCIOS-792: fixed SCICustomAnnotation can’t be selected; Also improved moving it and scaling using available anchor points
SCIOS-791: fixed Pie\Donut series segmentSpacing is ignored
Fixed for Metal: HeatMap Example
Fixed for Metal: Using Point Marker example
Updated forMetal: Xamarin.iOS bindings to work with Metal integration
Added: new example that shows how to leave rollover on-screen
Fixed: incorrect type of RenderSurface interface
Fixed: Custom Legend Placement
Fixed: updating renderableSeriesAreaBorder / renderableSeriesAreaFill styles on SCIChartSurface
Fixed: incorrect Call of formatXCursorValue
SCIOS-609: fixed making one stacked in the group invisible makes the whole group invisible
SCIOS-712: fixed cursor modifier shouldn’t show labels on hidden axes
SCIOS-711: fixed ZoomPanModifier shouldn’t trigger inertia if velocity is very low (very gentle swipe)
Fixed and enabled displaying of ARC -related warnings
Fixed: crash on “show source code” feature in example demo
Fixed: Tooltip on RolloverModifier appear outside the Chart area
Improved: SCIRolloverModifier layout to fit chart bounds whenever it’s possible
Updated: pen style in Xamarin.iOS
Added: missing ctor which isn’t inherited from protocol in Xamarin.iOS
Updated: heatmap examples in Xamarin.iOS
Bug Fixes for Android:
SC_DROID-654: extended need to draw check in AxisTitleRendererComponent to cover the case when axis title is an empty string;
SC_DROID-653: fixed incorrect values displayed by axis tooltips in CursorModifier when using custom layout axis layout such as vertically stacked YAxes;
SC_DROID-652: added handling of the vertical chart for Horizontal/VerticalLineAnnotation;
Fixed: incorrect work of AnnotationCreationModifier when the chart is vertical
SC_DROID-649: replaced invalidateElement() on invalidateLayout() when modifying series collection because series affect layout of pie/donut chart
SC_DROID-650: modified rendering of pie and donut charts – added code which splits arc into two parts to ensure that it will be rendered;
Fixed missing jar name in path to support-annotations; updated to Android 27; updated instructions;
Fixed incorrect parameter in scroll() implementation for axis
SC_DROID-612: fixed incorrect hit test results if xAxis has flipped coordinates – added isCoordinatesSortedAscending() flag for render pass data which is used for findIndex() call with xCoordinates;
Fixed: wrong ColumnPaletteProvider, when colors changed during scrolling of chart;
SC_DROID-607: updated AxisTitleRendererComponent to correctly handle RTL title;
SC_DROID-599: changed LazyGLTexture which should prevent possible NullPointerException in case of any race conditions
SC_DROID-598: added notification about changes of axis layout when settings axis title orientation and placement;
SC_DROID-501: refactored AxisTickLabelsRendererComponent to correctly render multiline tick labels;
Fixed: issue with aapt2-proto library when building a project on new PC where there is no cached version of the library – reordered repositories which are used for downloading dependencies;
Fixed Tooltip on RolloverModifier appear outside the Chart area
SC_DROID-596: improved layout of rollover tooltip to prevent clipping of tooltip at the bottom if there is enough space to place it a bit higher;
SC_DROID-596: refactored VerticalSliceBehaviorBase to allow to override layout of rollover tooltips by creating custom SliceLayout.
Where to get iOS / Android / Xamarin v2.5?
You can get the SciChart iOS/Android/ Xamarin SDK v2.5 from the Downloads page. Source code customers can also get the latest from our Github repository as well as from Cocoapods for iOS, and Maven for Android. We also keep on delivering continuously for bug fixes, features and minor updates to the following package sources.
At SciChart we are big fans of open source! We use open source in some of our chart controls, such as SharpDX (a managed wrapper around DirectX), Rene Schulte’s brilliant WriteableBitmapEx (for line drawing in WPF), WordPress/PhP on the website and more. We’ve even written some open source components such as the popular, free WPF Transitionz library. So, we don’t want to disparage the hard work of any open source chart component developers.
However, we do often get asked the questions ‘is your software free?’ and ‘why should I buy SciChart vs. using a free open source chart component?’
In this article we compare our software vs. a few popular free WPF, iOS & Android chart libraries and present reasons & benefits when it may be better to choose SciChart over open source, free charts for your WPF, iOS, Android & Xamarin applications.
This first reason almost goes without saying. One of the biggest value-adds of using a commercial WPF, iOS or Android chart control is the insurance of knowing you have Enterprise technical support. If charts are mission critical to your project, and resolving any issues, should they occur, is important to you, it’s a very strong reason to consider a commercial chart control such as SciChart.
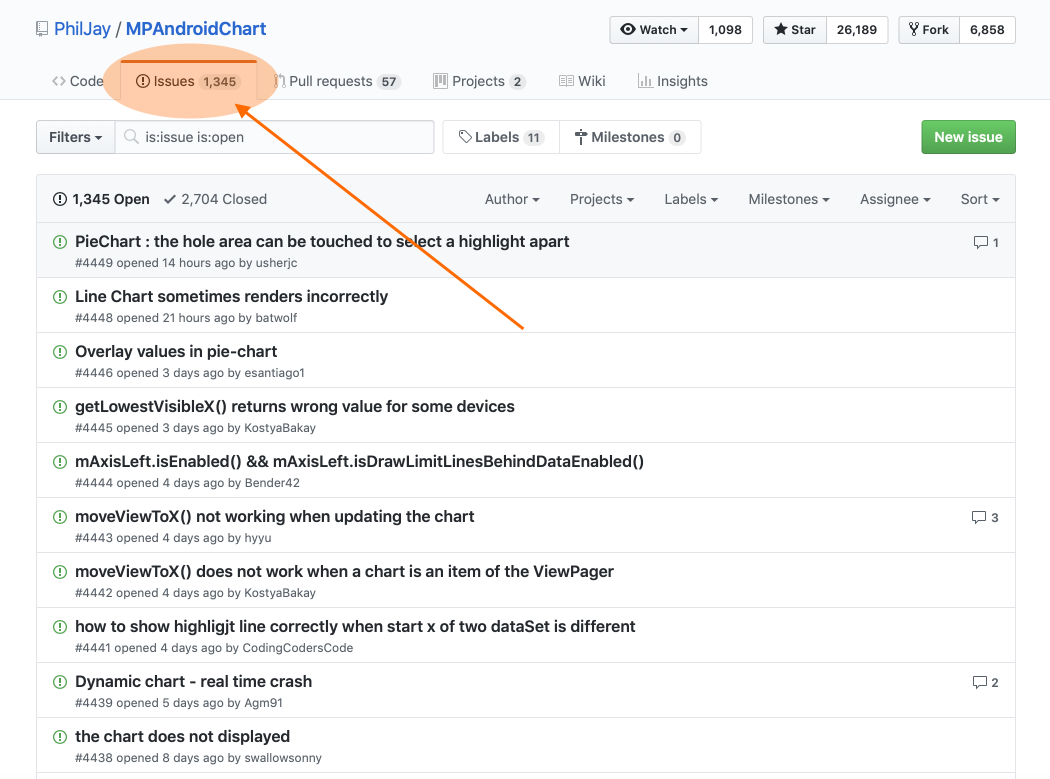
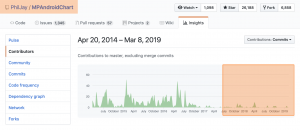
The following table shows the reported open issues on four major open source chart projects: OxyPlot (WPF Charts), LiveCharts (WPF Charts), MPAndroidChart (Android Charts) and Charts (iOS). New questions are asked every day on the github repositories for these libraries, and many are unanswered.
Table 1: Open issues on popular open source chart components
We’re not surprised! One twitter influencer described the flood of open source help requests as ‘the fire-hose of open source’: When your open source chart library becomes popular you will be flooded with requests from users asking for help, demanding bug fixes and features, and it can quickly become unsustainable to handle them. So, the open source developers (some of whom have done a great job writing software!) quite rightly stop answering. Even we find it hard work sometimes to answer as many support requests as we do: over 7,500 requests for help, technical support or forum questions to date, and its our job! I can’t imagine having to do this level of work in spare time.
Figure 1: Issues outstanding on the MPAndroidChart open source chart library
What this means for you is, if you use an open source chart control in your business-critical project and one day you need help, and stackoverflow or the community is unable to provide it, you will be stuck… This could cost your business time and money if your application development is delayed if your productivity is affected while trying to find a solution.
SciChart’s 5-star rated Enterprise tech support is an insurance policy against problems you might encounter during your project. Our tech support is not meant to be a replacement for google, or research, but if WPF, iOS, Android or Xamarin charts in your project are mission critical to your business, at some point you may encounter a problem or issue that needs our team to help you. This can save you time and money to get back to what you are supposed to do: developing your application.
Reason #2: Ease of Use & Productivity
Technical support isn’t the only reason to choose SciChart vs. an open source chart component. We think you’ll find that if an API or library is productive and easy to use, it can lead to bigger cost saving than those provided by tech support.
Consider how much is your time worth per hour or per day?
How much time might you save in a year of using SciChart vs. an open source chart?
Think about the time to get started, learn the API, to find information you need on the web. If you have a requirement that is not simple, you might need to do some research to find the answers. With SciChart, you won’t need to save much time for the license to pay for itself entirely.
Example:
Cost of developer time: $60 / hour ($480 per day)
Cost of SciChart License: approx ~$1100 for SciChart WPF 2D Professional
Only 2.3 developer days need to be saved in a year before SciChart pays for itself.
It’s quite reasonable to assume you might save an hour per week when using SciChart vs. an Open Source chart component. More if your project is chart heavy. An hour per week adds up to 48 working hours per year, or 5 days of developer time: much more than the cost of the license.
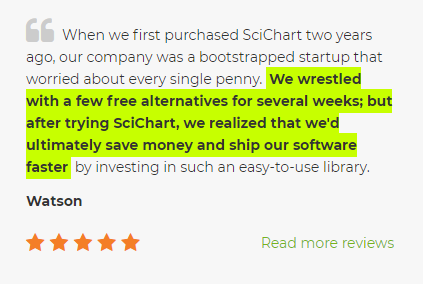
One of our customers left us a great review, which said this:
This is really an incredible review and we’re grateful, but did you notice that the author spent several weeks evaluating free alternatives to SciChart? Free software can come with a cost of your time, and although SciChart is a commercial control meaning initial cost to your team, the care and attention that has gone into the API, examples, documentation and online help resources such as tutorials and forums will lead to faster development of the application & cost savings in the long run.
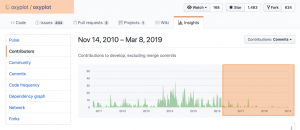
Reason #3: Developer activity & Speed of Bug Fixes
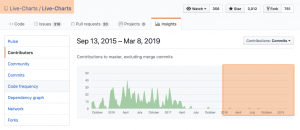
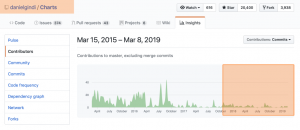
This reason is closely linked to #1. We have noticed that the development activity of many of the popular open source chart controls has declined over time, however, the demand for features and improvements has increased with their popularity.
Github activity for OxyPlot, an open source WPF Chart control
Github Activity for MPAndroidChart, open source Android charts
Github activity for LiveCharts Open Source WPF Chart control
Github activity for Charts, an Open Source iOS Chart control
Above you can see the Github activity of the four main open source chart components.
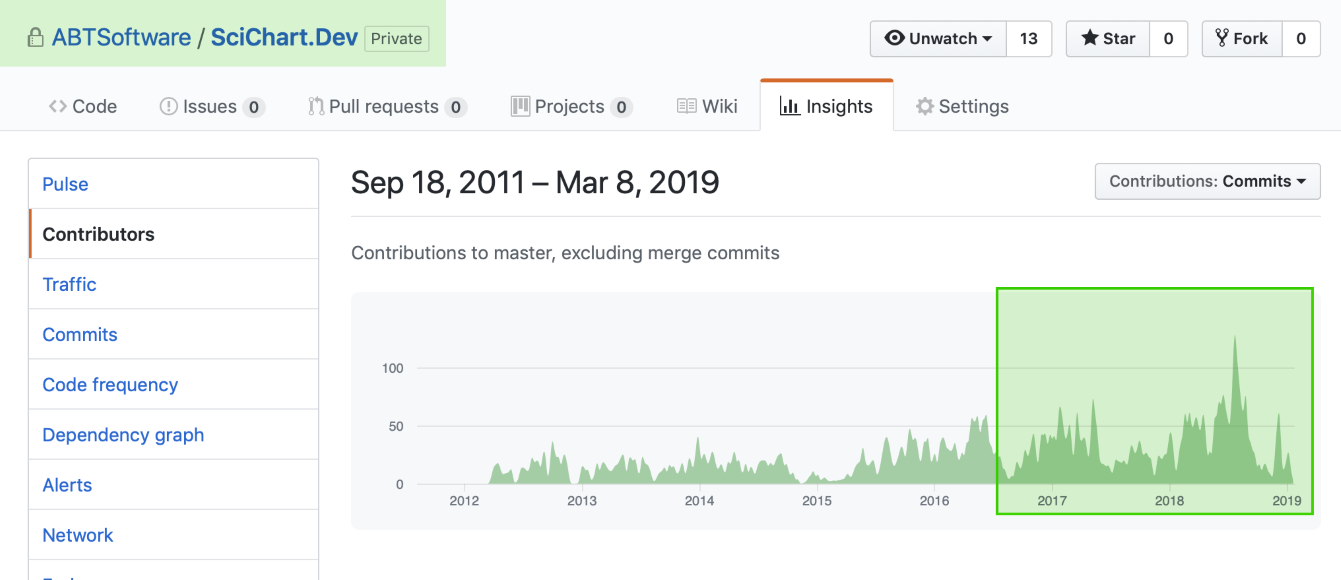
Below you can see our github activity. In contrast to the open source projects listed above, our development activity has increased; actually in the past two years it has really heated up since every day at SciChart we get new feature requests and demand for more improvements, better performance, compatibility with a new framework etc…
Figure 2: Development Activity on the SciChart Github repository
SciChart started as a project in 2012 and seven years later, we now have 14 developers now working full time on our WPF, iOS & Android charts. I cannot tell you how surprised I am (probably more surprised than you!) that charts (just X,Y values … on a screen … ) would take decades of effort…
So what does this mean for you?
If a new .NET Framework is released (Windows), new version of XCode, iOS, or Swift, a new Android SDK or Xamarin SDK is released then both commercial and open source charts have to be updated to be compatible. Sometimes a new device comes along and an application doesn’t work. Sometimes a critical bug occurs since an operating system or framework update and the chart component has to be fixed.
There is a risk you take when using any free open source or commercial chart control that the developer ceases to update their software, however, with SciChart that risk is minimized since our developer activity and popularity has been increasing over time.
When bugs are reported in our WPF Charts, iOS & Android Charts or Xamarin Charts we will aim to fix the serious ones as fast as possible, because they directly affect our customers, and therefore us!
That’s why we are charge a fee for what we do – we love free software and we think the open source chart developers do a great job, but in order to provide excellent software to you that is always up to date, fixed fast when there’s a problem and incorporating the latest features that you ask for then we must charge. We aren’t perfect, but this is our job and our livelihood and we have a strong incentive to work hard for you so that your projects are a success, plus, a good reputation to maintain!
Reason #4: Depth of Features
At SciChart, we only focus on charts. As a result, we strive to create a depth of features beyond when open source chart components are able to achieve and even beyond what many commercial vendors do too!
Take a look at the features matrix below to see what features SciChart can bring which open source components do not.
Feature
SciChart
MPAndroidChart
iOS-Charts
OxyPlot
LiveCharts
2D Plots
3D Plots
*
Active, searchable forums
Animation of Data
Annotations on Chart
Custom Series
Custom Zoom or Pan behaviours
Export / Print
Fully Documented
Hardware Acceleration
High Performance & Realtime
Link Multiple Charts
Legend Customization
Logarithmic Axis
Multiple X-Axis
Multiple Y-Axis
Per-point colouring
Programmatically Change Viewport
Technical Support
Theme or template customization
Tooltips
Touch Interaction
Zoom and Pan
Table 2: Feature comparison of SciChart vs. popular Open Source Chart components such as OxyPlot (WPF), LiveCharts (WPF), MPAndroidChart (Android) and Charts (iOS). *3D Support coming soon to Mobile
Key:
Means the feature is supported by the open source chart
Means the feature is not supported by the open source chart
Means there is limited support (requires workaround, or limited compared to SciChart)
The open source charts are in many cases, good enough for simple applications. If you want to just add a few low point-count 2D charts to your application, they can do the job. However, it’s the depth of features where SciChart really shines.
More on this below …
Reason #5: Flexibility
Most open source or commercial chart controls for WPF, iOS, Android provide the following standard features:
Many chart types (e.g. Line Charts, Scatter charts, Column Charts, Pie Charts)
Axis types (e.g. Date Axis, Time Axis, Numeric Axis)
Basic customisation features (e.g. TextFormatting, Themeing)
Inspection support (e.g. Tooltips, Legends)
Built-in zooming and panning
It would be easy to compare two chart libraries and see that they all support the above features and conclude ‘They’re the same’. Far from it.
With SciChart, you will find our API allows for complex customization is possible on nearly everything, and if we can’t support something, we will give a workaround, or, accept a feature-request for future development.
Here’s a selection of some of the deep features that SciChart supports which allow greater flexibility when creating charting applications for business.
Its really hard to get these hidden features which provide excellent flexibility of our chart controls into a short list! These are just some of the flexibility options that SciChart has that open source chart controls and even commercial chart vendors do not have. Deeper features and more flexibility means you can get more complex requirements done quickly, which adds up to big cost savings over time, and ROI for your team.
Watch the video below to learn about 15 hidden features in our WPF Chart component to find out more:
Reason #6: Chart Performance
There are plenty of reasons why to choose and consider SciChart even if your application only needs to show modest dataset sizes. However, some of our users have very demanding performance requirements, and SciChart is capable of drawing many millions of points, update charts in realtime and with a low memory and CPU footprint on all the platforms that we support (iOS, Android, Windows/WPF).
We have created the fastest iOS charts & Android charts in the world (by a long way!), and one of the fastest, high-performance charts for WPF and Windows applications. Our charts are based on a hardware-accelerated rendering engine using DirectX (Windows), OpenGL ES (Android) and Metal (iOS) so that you get the fastest charting possible in your applications.
What does this mean to you? It means that SciChart makes impossible projects, possible.
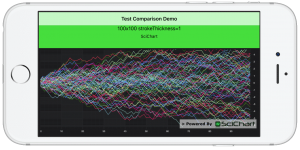
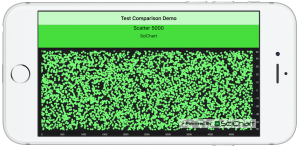
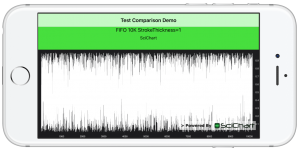
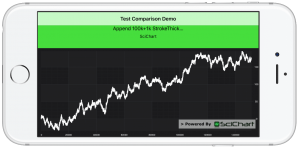
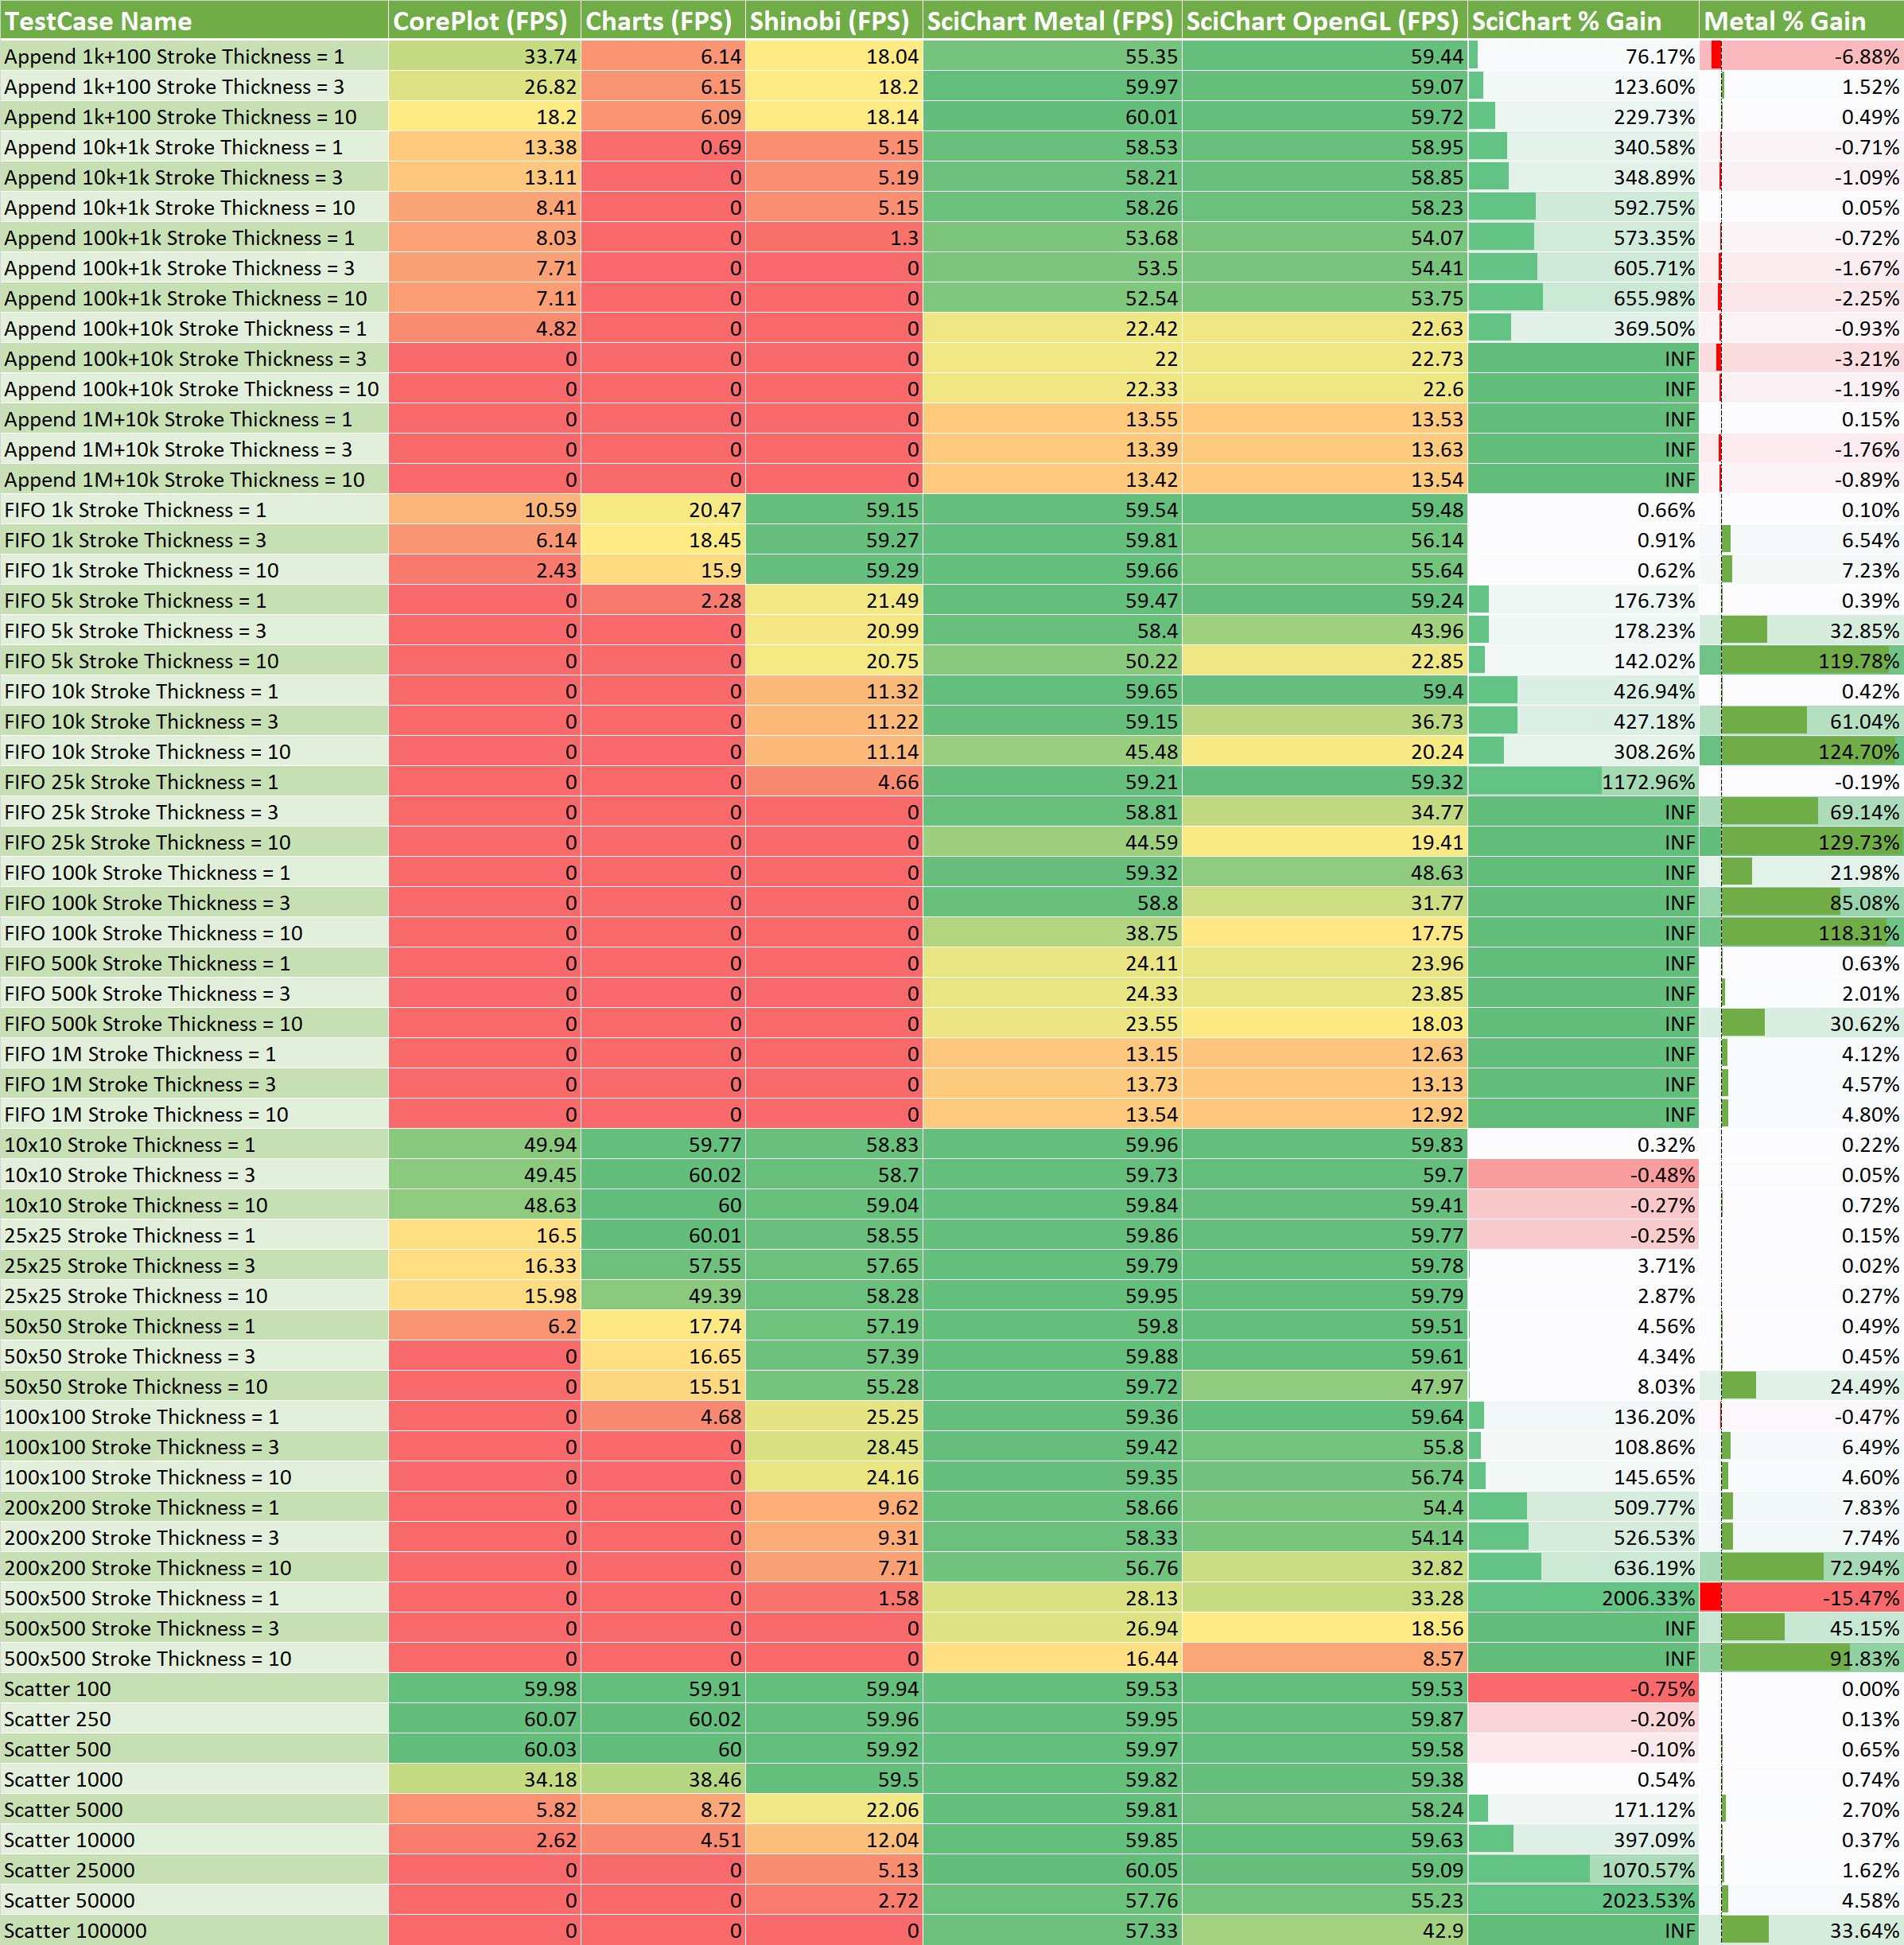
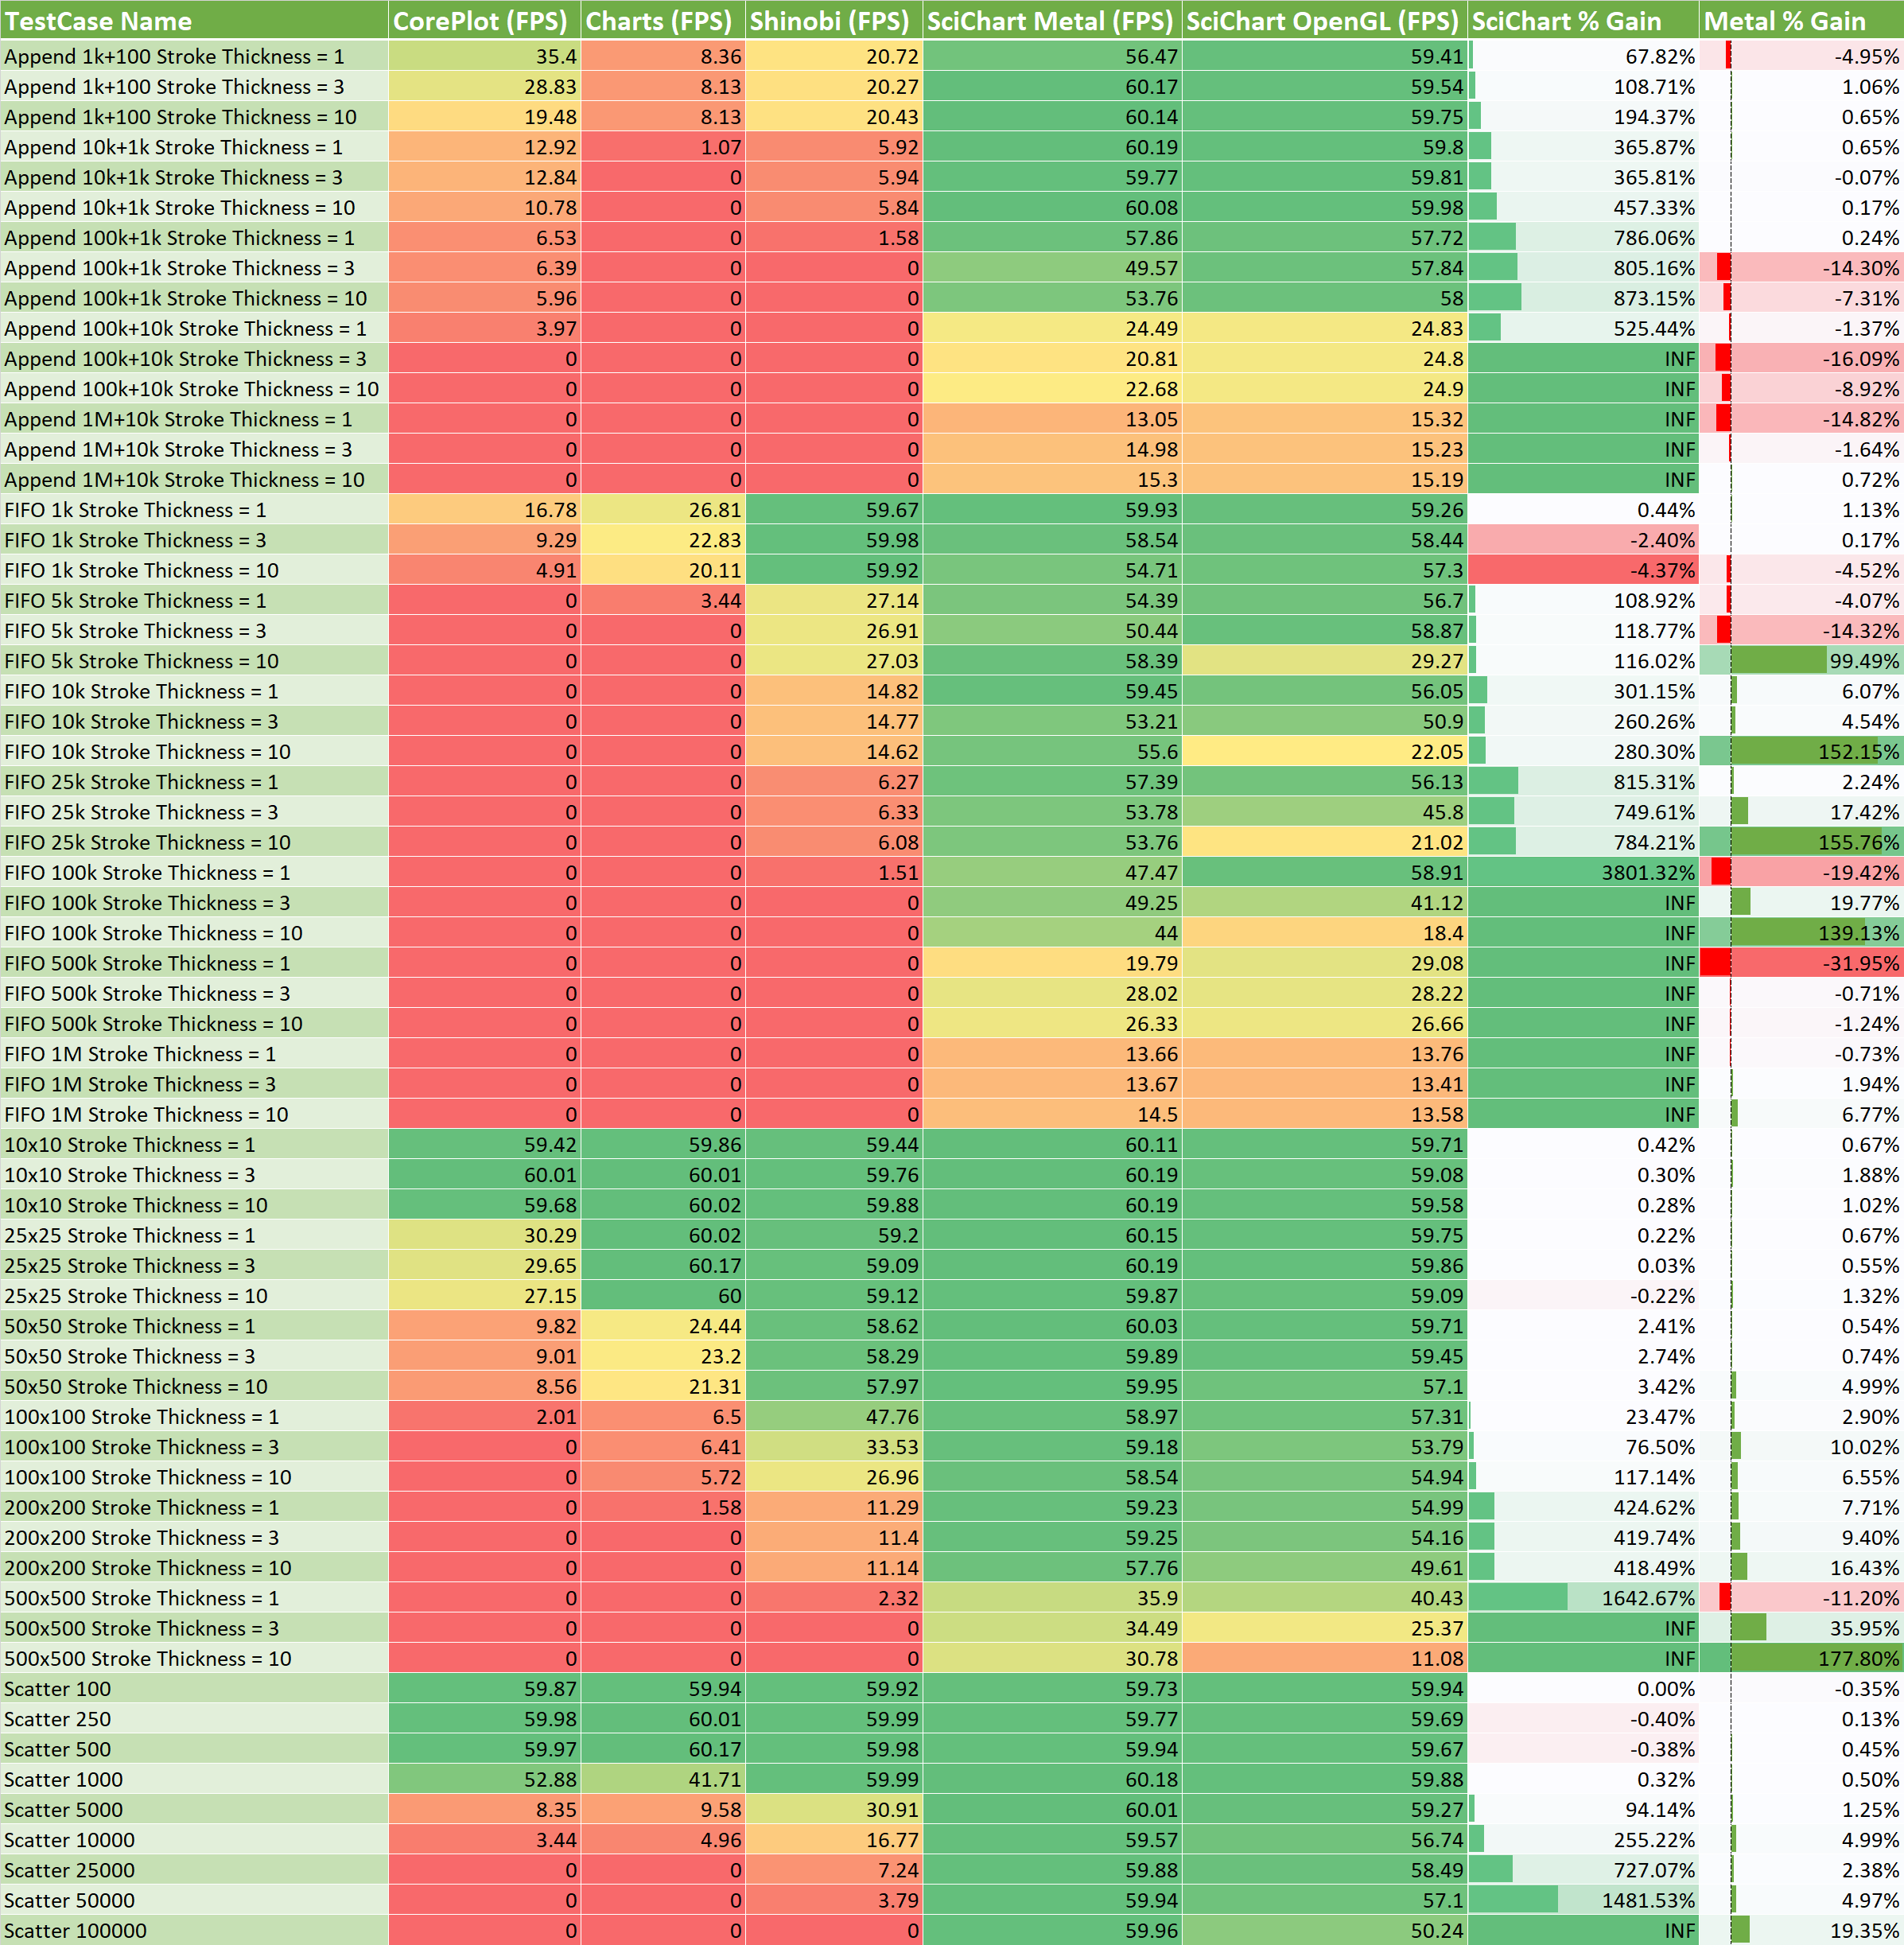
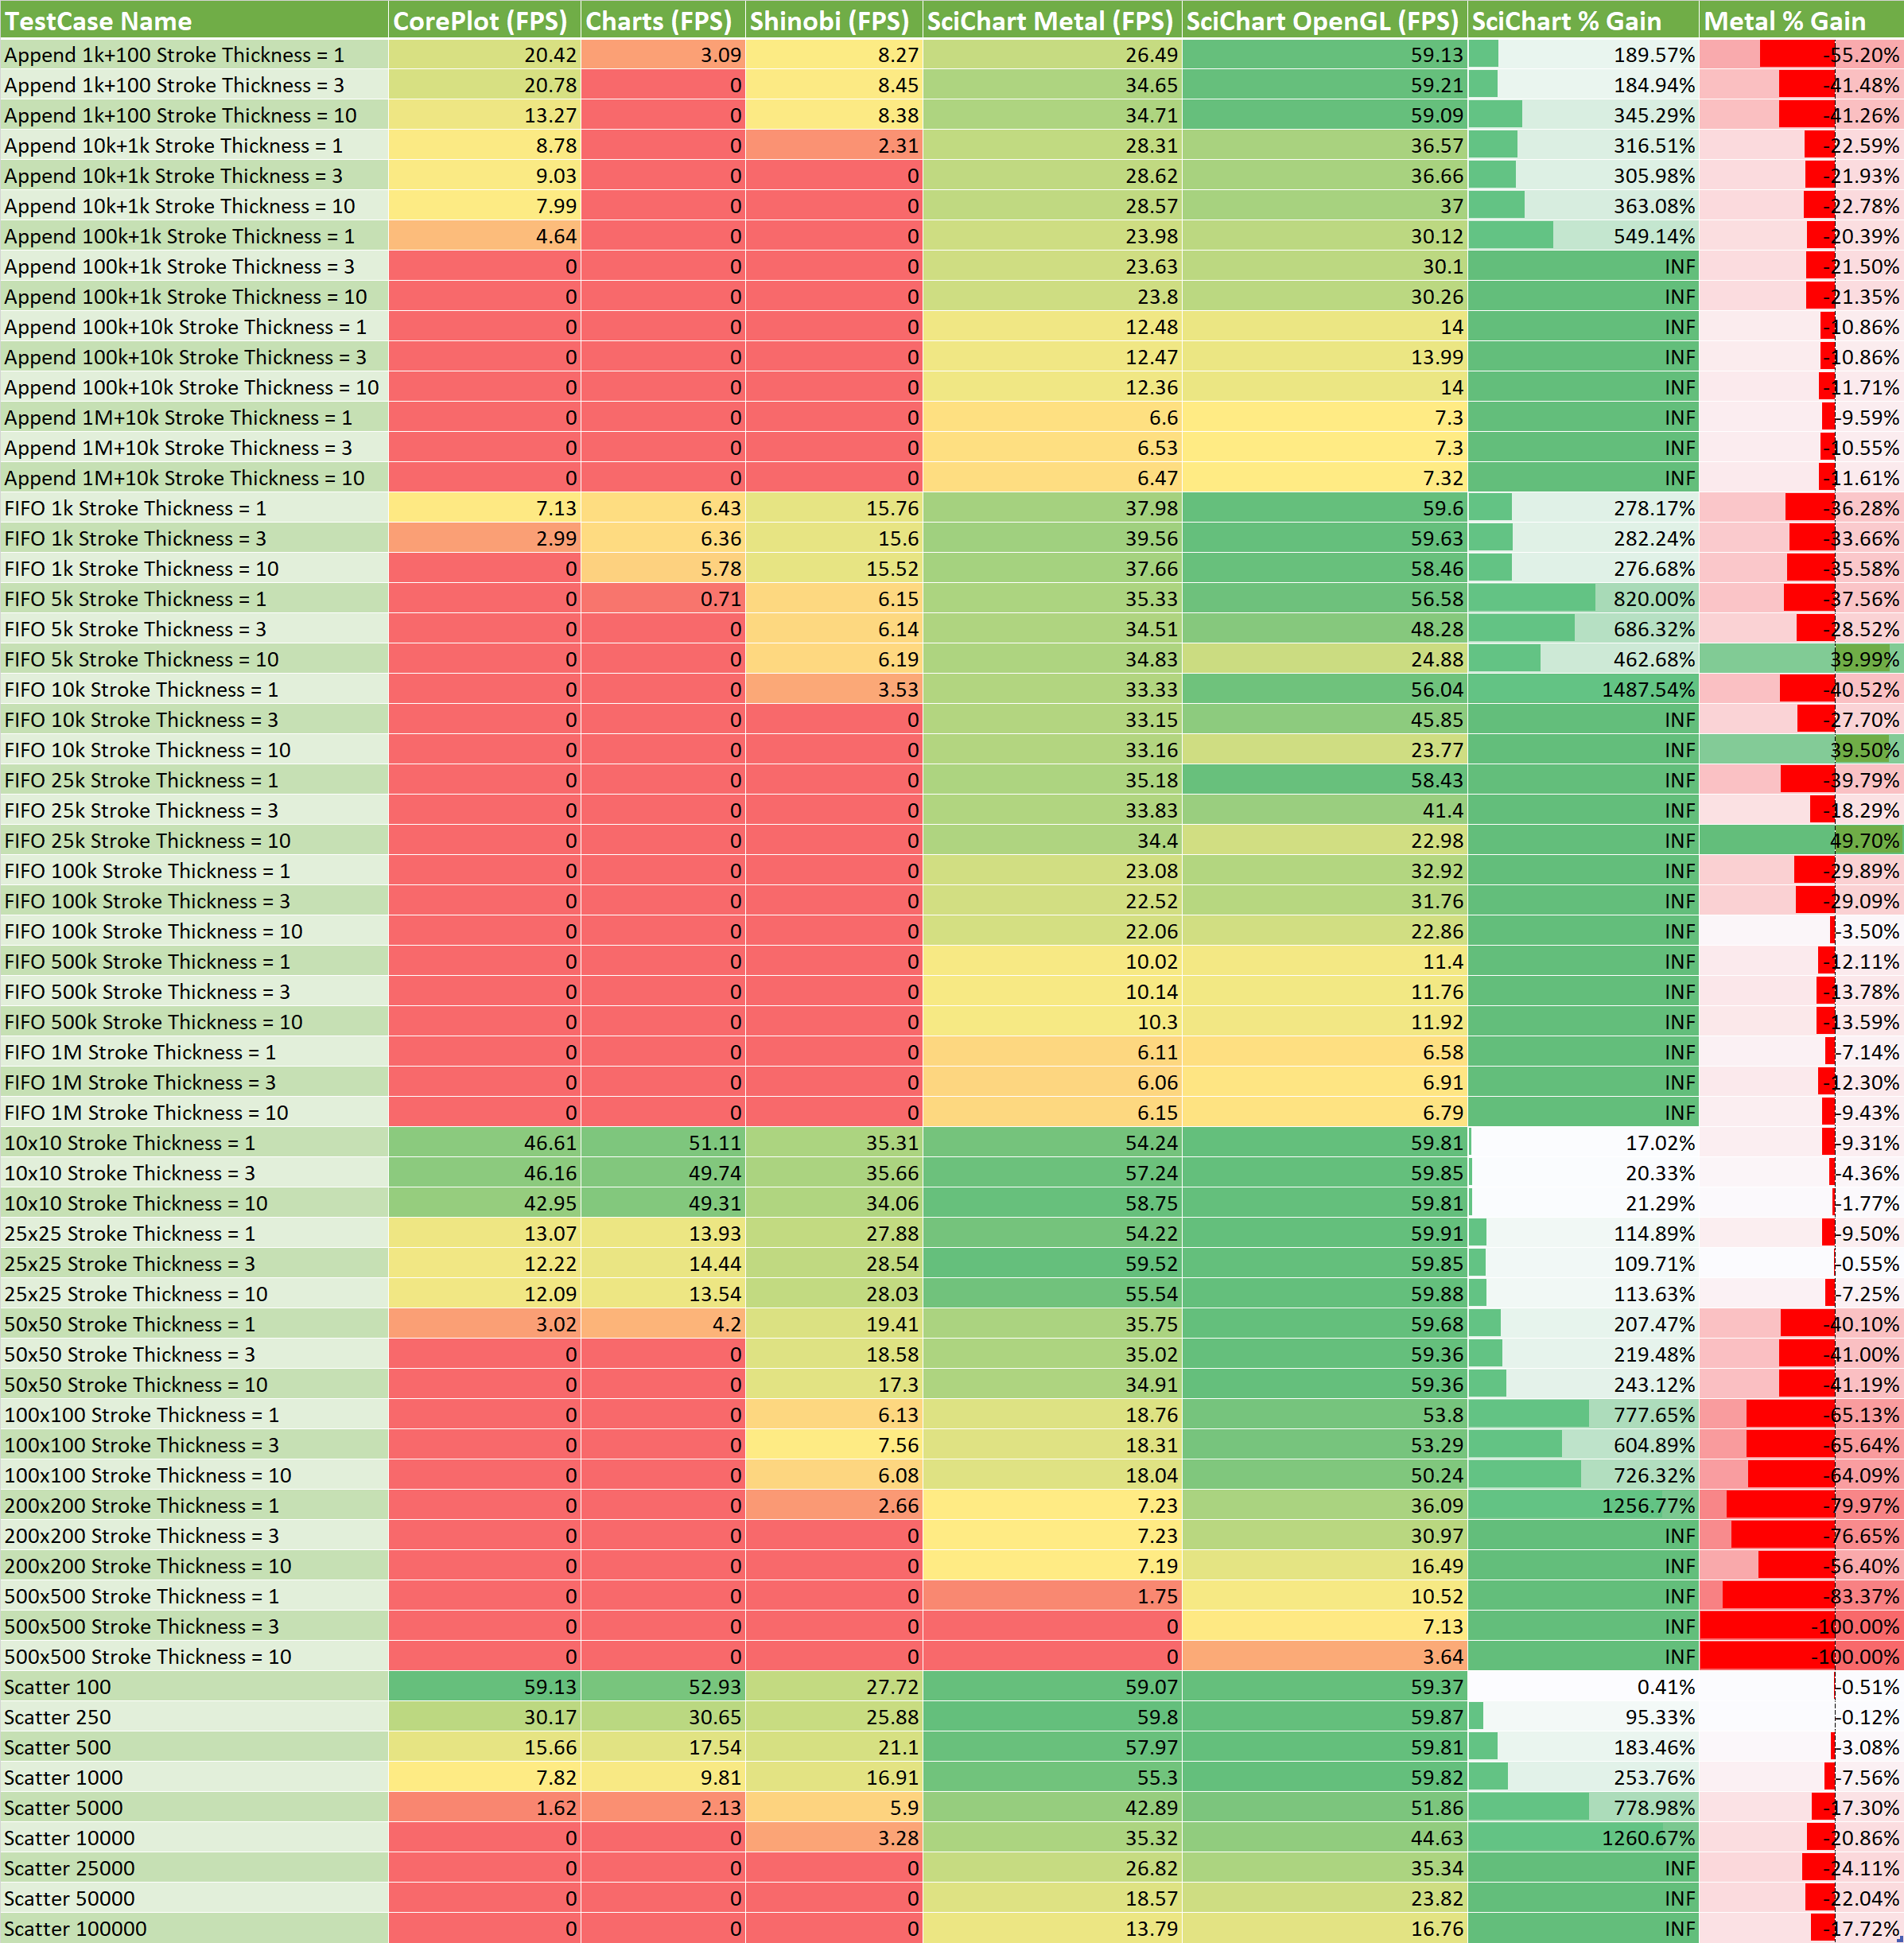
We compared the performance of SciChart vs. some well known open source chart components, and discovered that our iOS & Android charts performed an order of magnitude faster than open source libraries (See iOS Chart Benchmarks and Android Chart Benchmarks). This means more data can be shown in your apps and previously impossible app ideas can now be realised. Our WPF Charts are also similarly fast compared to open source WPF charts. We are also working continually to make better gains in this area of performance and ensure that our charts are smooth and realtime in your applications.
When to choose SciChart vs. Open Source?
So given all of the above, when should you choose SciChart vs. an Open Source Chart component? There are some good arguments above, but you will find some more in the article seven reasons not to use Open Source. Some which are cited include:
When proprietary software is easier to use
When proprietary software offers technical support
When proprietary software works better with your hardware
In conclusion: when the requirement complexity is large, or the application is business critical, when features or performance matters and you need a component which is actively developed, you should definitely consider choosing SciChart for the charts in your enterprise applications!
SciChart vs. Open Source ROI Calculations
We’ve created some simple ROI calculations below to help you get an idea of the return on investment when purchasing SciChart. Some assumptions are made and no calculator is perfect!
If you consider the number of developers on your team, and the developer rate, you can get an idea of cost for your team’s time.
Next, estimate the time saved per developer per month. For example, conservatively estimating 1-hour a week saved from productivity, you might arrive at a figure of 4-hours per month. The actual figure could be higher in applications which are charting-heavy.
Finally, estimate the number of support incidents per year. Support incidents which are serious are rare, perhaps you will only get one or two a year, but each one might block your team for a long time if not resolved. So for example, estimate 2 days per year, but 16 hours of time lost per incident.
The calculator will output the return on investment for your purchase.
These are the results:
Number of developers on team
5
Developer rate / hour
$60.00
Time saved (general productivity) per dev per month
4 hours
Time saved (general productivity) entire team per year
240 hours
Cost saved getting started / finding information / Year
$14,400.00
Number of critical support incidents / year
2
Time saved for each critical support incident
16 hours
Cost saved for critical support incidents
$1,920.00
Number of minor support incidents / year
10
Time saved for each minor support incident
4 hours
Cost saved for minor support incidents
$2,400.00
Single SciChart License Cost
$1099
Multi-Purchase Discount
30.00%
Cost of 5x SciChart Licenses for your team
-$3,846.50
Total productivity costs saved
$18,720.00
ROI ($)
$14,873.50
ROI (%)
387%
Table 3: Estimated cost savings for a 5-developer team using SciChart
Of course, cost savings depend on many factors and the above doesn’t include the time you will spend learning the SciChart API, however we believe it will be quicker to learn SciChart than an alternative charting API.
Download the ROI Calculator here as an Excel Spreadsheet if you want to play around with the numbers. We have included both single-developer licensing costs vs. ROI as well as site-license costs vs. ROI.
SciChart licensing costs decrease over time
Please note, SciChart is licensed as a perpetual license with royalty free redistribution rights (see Licensing FAQ) and a support and updates subscription. The subscription is not mandatory after 1-year – you can still use SciChart after the support subscription ends, but you won’t be ale to access technical support or updates / bug fixes to the chart (see Renewals FAQ).
Our costs decrease over time as a 2nd year renewal of a support subscription costs just 50% of the 1st year. Your ROI for year two may be even greater.
Finally, you can, if you want, purchase the source-code to SciChart. If you want to modify it, then you have one of the main benefits of open source: ability to inspect, modify and develop the source-code of the chart control.
Best regards,
Andrew
[SciChart Team]
About SciChart: High Performance Realtime Charts.
SciChart provides high performance realtime chart components on the WPF (Windows), iOS, Android and Xamarin platforms. It is our goal to create the best cross-platform WPF, iOS & Android 2D & 3D charts in the world, focusing on performance, developer productivity, ease of use, depth of features and enterprise-grade tech support.
If you have a question about what SciChart can offer you, or if you would like to get a quote, please contact us. Our friendly, helpful support team will be glad to help!
Windows 7,8,10
WPF CHARTS
The World’s Best 2D & 3D WPF Chart with DirectX Hardware Acceleration and legendary tech support!
It’s been almost three years since we released SciChart iOS: Realtime Charts for the iOS Platform. Right from the start, our goal has been to create the worlds fastest iOS Charts, but also produce visually appealing, productive, easy to use and flexible / powerful iOS charting controls, capable of being used in demanding business apps.
However, if it’s iOS Chart Performance you are looking for, then you have come to the right place! With the recent release of SciChart iOS v2.5 with metal support, we have taken the opportunity to update present new performance results of our iOS Chart control: SciChart iOS, vs. a number of competing open source iOS charts and commercial charts, as well as demonstrate the performance differences in our iOS Charts between Metal & OpenGL rendering on a variety of devices.
In this article we compare the performance of the following chart controls:
Core-plot; an Open source iOS Chart based on Core-graphics
Charts; an Open Source iOS Chart based on Core-graphics
Shinobi: a commercial iOS Chart library made by Scott Logic Ltd which uses OpenGL
SciChart (with our OpenGL renderer plugin)
SciChart (with our new Metal renderer plugin)
Tests Carried out
A number of tests are carried out to really stress the chart controls, these are:
Test 1: Hundreds of Series Line Chart Test
In this test, tens or hundreds of series, with tens or hundreds of points are added to the chart, then the chart redraws (the same data) as fast as possible by just resizing the Y-Axis for 10 seconds per test.
Performance is measured as FPS (Frames per second) using the CADisplayLink , which fires once after each drawing pass completes.
Test 2: Big-Data Scatter Chart Test up to 100k points
In this test, thousands or hundreds of thousands of Scatter points (ellipses) are appended to a series, then the chart redraws. Immediately after, the point positions are updated in a Brownian motion fashion and the chart is drawn again.
Performance is measured as FPS (Frames per second) and recorded.
Test 3: Realtime Scrolling Chart Test up to 1 Million points
In this test, hundreds of thousands or even up to one million points are appended to a line chart, but scrolled from right to left (as new points arrive, old are discarded). SciChart for iOS & Android has a built-in mode to handle this called Fifo data series which use a circular buffer. Other chart components you can simply remove a point for each point added.
Test 4: Realtime line drawing test up to 10k Points added per second
Performance is measured as FPS (Frames per second) and recorded. In this test we start off with a line chart with thousands or even tens of thousands of points. We then add hundreds or thousands of points per second to the chart, so that the series gets bigger very fast. The data is random-walk and the chart automatically zooms to fit when data is updated. This gives the appearance of a live streaming realtime chart.
Performance is measured as FPS (Frames per second) and recorded.
Test Hardware
For the Test Hardware, we’ve used three phones: an iPhone 5s, iPhone X, and iPhone XR. The results are interesting as they show the strengths and weaknesses of each phone when drawing realtime iOS Charts using both Metal and OpenGL.
Performance Test Results
Interpreting the Test Results
Below: All test result numbers are in FPS (Frames per second – Higher is Better), meaning, the average number of redraws per second during the test, as measured by CADisplayLink.
The Test Case Name column is understood as follows:
Append 1K+100 StrokeThickness = 1 means “Starting with 1,000 points on an iOS Line chart, append 100 new points in a loop with a stroke thickness of 1”
Append 100k + 10k Strokethickness = 3 means “Starting with 100k points on an iOS line chart, append 10k new points in a loop with a stroke thickness if 3”
FIFO 10k Stroke Thickness = 3 means “Load 10k points to an iOS Line Chart and scroll them to the left with a strokethickness of 3”
FIFO 1M Stroke Thickness = 1 means “Load 1 Million points to an iOS Line Chart and scroll them to the left with a stroke thickness of 1”
100 x 100 Stroke Thickness = 3 means “Load 100 line chart series, to an iOS Chart, each with 100 points, with a stroke thickness of 3 and redraw the chart”
500 x 500 Stroke Thickness = 1 means “Load 500 line chart series to an iOS Chart, each with 500 points, with a stroke thickness of 1 and redraw the chart”
Scatter 1000 means “Load 1,000 points to an iOS Scatter Chart and repeatedly draw the chart”
Scatter 100000 means “Load 100,000 points to an iOS Scatter Chart and repeatedly draw the chart”
The Results Columns (Core Plot, Charts, Shinobi, SciChart Metal, SciChart OpenGL) are understood as follows:
Numbers are in FPS (Frames per second), where higher is better. 30 FPS or above is smooth to the human eye.
Each iOS Chart has FPS reported for this test case.
SciChart iOS has FPS reported for both the OpenGL Renderer plugin and the new Metal Renderer plugin
Because many of the open source iOS charts we tested became unstable as dataset size increased, we skip running further tests once a chart has dropped below 5FPS. So a zero in a column means that test was skipped (the iOS Chart control was unable to render that data size).
Note that in the case where SciChart was able to run a test but other iOS Charts could not, the percentage gain was marked as INF (infinite).
The % Gain Columns are understood as follows:
SciChart % Gain: The Max FPS of SciChart (Metal or OpenGL) is compared to the Max FPS of open source or commercial charts and computed as a percentage.
e.g. 800% means SciChart was 800% faster than the fastest competing iOS Chart Control for this test case
whereas -5% means SciChart was 5% slower than the fastest competing iOS Chart Control for this test case.
Metal % Gain: The FPS of ScChart when Metal was enabled is compared to the FPS when OpenGL is enabled and computed as a percentage.
e.g. 99% means SciChart’s Metal renderer was 99% faster than OpenGL for this test case
whereas -15% means Metal was 15% slower than OpenGL for this test case.
Test Results iPhone X
SciChart iOS Performance Comparison vs. Open Source Charts with Metal/OpenGL on iPhoneX.
The iPhoneX shows strong performance results for SciChart, where our Metal rendering plugin is able to draw big data and real-time updates at smooth frame rates.
On an iPhone X, SciChart’s iOS Chart can draw:
A massive 100,000 scatter points at 60 FPS (nearest competitor can only draw 1,000 points at the same frame rate)
200 series with 200 points on a single chart at 56 FPS (nearest competitor can only draw 50 series)
100k points scrolling in the FIFO case at 58 FPS (nearest competitor
It can have 100k points on screen and append 1,000 new points at 54 FPS
SciChart iOS Chart Performance is 60FPS for 100k points, 200 series or 100,000 scatter points in real time on iPhone X
On an iPhone X, SciChart is considerably faster than competitors, with test cases up reporting up to 2,000% faster than the nearest competing iOS Chart component.
SciChart iOS Chart Performance gain is up to 2000% faster than competitors on an iPhone X
Finally, SciChart’s Metal renderer plugin shows strong performance, with most cases comparable to SciChart’s OpenGL plugin. Some cases, a performance boost of over 100% is realised just by using the Metal renderer.
Test Results iPhone XS
SciChart iOS Performance Comparison vs. Open Source Charts with Metal/OpenGL on iPhoneXS.
On the iPhone XS we have even stronger performance results. The iPhone XS is a really powerful device with a 6-core A12 Processor, vs a 6-Core A11 in the iPhone X. The iPhone XS also has a 4-core GPU vs. a 3-Core GPU in the iPhone X, and provides up to 50% faster graphics performance (source: Forbes – iPhone XS vs. iPhone X, What’s the Difference?).
This is reflected in the performance results. While some of the cases are comparable to the iPhone X, some are up to twice as fast. SciChart iOS is still able to draw hundreds of thousands of scatter points at 60 FPS, and now 500 series at 30 FPS, or a half a million points in a realtime scrolling chart at just under 30 FPS. Truly a big-data iOS Chart control. For the fastest test case SciChart iOS performs 3,800% faster than the nearest competitor.
Test Results iPhone 5s
SciChart iOS Performance Comparison vs. Open Source Charts with Metal/OpenGL on iPhone5S.
We’ve included the iPhone 5s as a testing device in our set of tests as well. The iPhone 5s is the oldest iOS Device which supports iOS 12 and Apple’s Metal graphics API. Because the processor is older and graphics processor less powerful, it isn’t as fast as the newer devices.
The iPhone 5s has a processing power approximately 1/4 of the iPhone X and XS, so it is not a surprise that SciChart iOS is performing slower on these devices. However, it is still outperforming competing iOS Charts by a long way.
You will also note that Metal performance on the iPhone 5s is slower than OpenGL, in some cases up significantly slower. This is because the A7 processor in the iPhone 5s has less powerful GPU features than newer devices. It is therefore advisable to detect operating system and device before applying the Metal rendering plugin in SciChart iOS. You can find out how in our iOS Chart Documentation.
Conclusions
It’s hard to draw much conclusion from these test results other than SciChart’s iOS Chart Control is really, really fast!.
> SciChart iOS: Up to 3,800% faster than competing iOS Charts, able to draw millions of points in realtime
These kind of performance results may seem over the top however consider that mobile computing is really starting to grow as a platform not just to surf the web and use simple apps, but actually create real big-data utility applications for scientists, engineers, medical professionals and businessmen.
Datasets are only getting larger, and the performance demands of applications are growing. With SciChart’s iOS Charts you can add visually appealing, animated line, column, scatter, bubble charts to your iOS application, or, create new kinds of apps that enable you to visualise massive amounts of data. Never before has this second case been possible for developers of iOS Applications.
Verifying the Results
If you wish to verify the performance test results, we are happy to share a copy of our iOS Chart Performance Comparison app on request.
Why SciChart?
SciChart provides powerful, flexible, high-performance realtime iOS Charts, Android Charts and WPF Chart controls to thousands of users in 80 countries. Our customers have use SciChart to create completely novel iOS apps such as capturing and displaying large volumes of heart-rate data during physical training sessions, for realtime visualisation of cardiovascular data for medical diagnostics, visualising telemetry and more. Without SciChart’s High Performance iOS & Android charts, these kind of apps would simply not be possible.
Far from just a fast 2D line or scatter chart, our iOS, Android & Windows (WPF) Charts are powerful, flexible, fully-featured chart controls and provide a compelling alternative to open source and commercial chart libraries. You can find out more about SciChart in the articles Comparison of SciChart vs. Open Source Chart Controls, and Why SciChart, the Best WPF Charts.
For more information about how some of our customers have used SciChart iOS, please see our case studies. We have included some below, and the full set is available at www.scichart.com/case-studies-mobile. If you have any questions, or wish to get in touch to discuss what SciChart can do for you, then please contact us.
Big-Data iOS/Android Chart Case studies
Avicena Heart (iOS)
Avicena is a medical device company focused on providing critical information to patients and physicians through their mobile app. Bespoke proprietary sensors stream cardiovascular data directly to a mobile device via Bluetooth to aid in diagnosis. Avicena chose SciChart as a reliable iOS charting solution to display Realtime, High-Bandwidth Cardiovascular data in up to 90 series streamed from sensors whilst maintaining a smooth UI and allowing for bespoke customizations and annotations.
Ihealth needed to display 70,000 points of Realtime Cardiac data for their revolutionary health and fitness app.
Custom iOS Charts were integrated alongside their existing styling adding great features and maintaining a smooth UI.
Keen to know more? Click below and find out what SciChart did to get this project off the ground!
IMT AG’s custom hardware project, the Citrex H5 had a range of hardware and cost requirements. SciChart was able to work with these and get IMT’s Android powered Gas Flow Analyzer off the ground with custom features and a slick high-performance interface despite the limitations of low-cost embedded hardware. Read on to learn more and have a look through our full case study.