In preparation for this, we’ve done some work to ensure that SciChart’s popular WPF Chart is compatible with the upcoming framework and that we can deploy dotnetcore compatible libraries to our users.
SciChart WPF for .NET Core 3.0 now available on Github
If you are a SciChart WPF Source-code customer, you can now access our .NET Core 3.0 Preview directly from Github. To get access (if you haven’t already), you can follow the steps at our page Github Repository for Source-Code Customers.
The two repositories: SciChartWPF (accessible only to customers of SciChart WPF 2D Enterprise) and SciChartWPF3D (for customers of SciChart WPF SDK Enterprise) now have new solutions which are compatible with Visual Studio 2019 and dotnetcore 3.0 Preview. Open these solutions & build to get a .NET Core 3.0 ready version of SciChart!
NuGet Packages for non-source-code customers coming soon
We intend to publish NuGet Packages of the compiled DLLs for regular customers of SciChart without source-code access soon. We have to change our licensing component because the one we’ve used since 2013 is not compatible with .NET Core 3.0. This may involve a breaking change (new type of license mechanism required), however, fundamentally the chart API will be the same, and will be a drop in replacement for SciChart WPF v5.x in the .NET Framework.
Once we have done this, we will announce on our Releases page and customers will be informed by our email newsletter.
Give us your feedback!
If you are a SciChart Source-code customer, and interested in using our WPF Charts in .NET Core 3.0, then please try out the solution on Github, and give us your feedback!
After years of researching and developing cutting-edge technologies to bring big-data, realtime charting to the Windows, iOS & Android platforms, SciChart has been awarded the coveted Queens Award for Enterprise, Innovation category.
What are the Queen’s Awards?
The Queen’s Awards for Enterprise are for outstanding achievement by UK businesses in the categories of Innovation, International Trade, Sustainable Development or Promoting Opportunity through Social Mobility.
It is the Innovation category which SciChart has been awarded, and we are proud to be one of only 61 companies to win this category in the U.K. in 2019.
What are the Criteria to Win?
In the category of Innovation, a company must demonstrate that it meets the strict criteria, which include:
Creating an innovation that has not been sold before.
Having the innovation available on the market for at least 2 years.
Has recovered all the investments made in the innovation or show that the innovation will recover its full costs in future.
Has shown outstanding commercial success as a result of innovation over 2 years – or continuous commercial success over 5 years.
How did SciChart meet these criteria?
Innovation
In the case of SciChart, we were able to demonstrate our novel & innovative technology in two areas: mixing of graphics rasterization technology with the much slower immediate-mode rendering provided by platforms such as WPF to dramatically speed up business and scientific charts, as well as novel data-reduction and lossless resampling algorithms enabling large datasets to be displayed in record time on desktop, mobile devices and embedded systems.
SciChart: used by the University of Illinois in cutting-edge IR Spectroscopy imaging research
These changes have dramatically shifted the market, first in WPF (Windows desktop) charts and now in iOS Charts & Android mobile charts, where prior to SciChart’s existence it was simply not possible to display big-data or real-time charts with large datasets on these platforms. Thanks to SciChart’s innovations in these fields, many impossible software projects have now become possible. Many competitors have imitated some of these innovations and as a result, the market and demand for fast, real-time, big-data charts in business applications on desktop & mobile grown considerably.
Commercial Success
SciChart has been able to demonstrate outstanding commercial success, including almost 500% growth over 5 years, year on year growth in revenue and not one year without a profit, with very strong international trade: 90% of orders coming from outside the UK. The criteria for meeting commercial success by the Queens Award examiners are quite strict and needed to be audited and confirmed by chartered accountants.
SciChart is used by financial companies to create trading & financial analysis applications
Furthermore, SciChart’s charting & graphics software has made an important contribution to the wider world enabling previously impossible projects to become possible. Some such projects, which have been made possible with SciChart’s fast, realtime WPF, iOS & Android charts include:
Development of low-cost ECG devices using bespoke, low-cost hardware and an android phone apps for monitoring of foetal heartbeats in the developing world.
Monitoring the impact force on the feet of autonomous, bi-pedal robots at the Massachusetts Institute of Technology.
Finally SciChart’s charitable work whereby we aim to donate 10% of profits to various charities, including; child sponsorship of 40 children in the developing world through Compassion UK and donations to rehab & homelessness charity Inside Out in Hull, U.K. have shown that SciChart is a socially-responsible organisation which wishes to make a positive impact in the wider world beyond technology.
About SciChart
Based in London, UK, SciChart is a privately-owned business with $1.4million USD in turnover and thousands of customers in almost 80 countries. Led by Director and software architect Dr. Andrew Burnett-Thompson, SciChart designs, develops and sells a software component to business and enterprise to draw fast, visually-appealing graphs, graphics and visualizations for the scientific, medical, financial and engineering industries.
The SciChart Team has grown from 1 person in 2010 to 16 full time staff in 2019
SciChart’s game-changing innovation was to combine proprietary data resampling algorithms and technology from the gaming industry for speed & performance of graphics with enterprise software applications, resulting in a software library which was able to draw charts, graphs and other visualizations many orders of magnitude faster than competitors.
SciChart’s fast, real-time charts & graphs enabled customers to bring to market cutting-edge new innovations at a fraction of the cost and time of developing the graphics software themselves. As a result, SciChart has grown organically from a single-person company to an international business with just under 20 full-time staff, with thousands of customers worldwide and all without outside investment or debt, overtaking established competitors with larger resources.
SciChart has secured a position as “Best in class” for charting & graphics software and continues to innovate, driving performance improvements, supporting new platforms & features helping its customers to conquer new sectors and drive market share.
We are performing a migration and upgrade of our support-desk portal. The support desk is currently functional.
However, there’s a couple of minor issues persisting. These are:
– Log in to support.scichart.com is currently not operational
– Live chat has been temporarily disabled.
We are appologizing for any inconvenience and are working on fixing this as we speak. Everything sent to our support emails is getting through and we can reply to your enquiries just as always.
We suggest using the following emails: support@scichart.com for technical support and sales@scichart.com for sales and licensing questions.
We are pleased to announce the release of SciChart WPF v5.4, build 12119. This update includes a number of bug fixes, improvements, and new features requested by our customers. It is strongly advised for users of SciChart v5.x to upgrade to this version, which is a drop-in replacement.
SciChart WPF v6.0-alpha with .NET Core 3 support is also released.
What’s New in SciChart WPF v5.4?
At SciChart we have recently added a feedback and new features’ request system which helps us improve our communication with the customers. It seems to work great so far! We have had some very valuable interaction with our customers. This update includes features that have been requested by our user base!
New features
SciChart Waterfall 3D Color Brush Feature
This feature allows developers to change waterfall ‘Stroke’ color into a gradient brush and make 3D waterfall charts more readable.
Gradient BrushColorPalette used for coloring waterfall ‘Stroke’ property along Z-Axis
Gradient BrushColorPalette used for coloring waterfall ‘Stroke’ property along Y-Axis
We are looking forward to hearing more from you. If you want to submit a feature request, please see how here.
SciChart v6.0 Alpha with .NET Core 3 Support
At the same time we have released SciChart v6.0.0-alpha with .NET Core 3 support. The .NET Core 3 SDK is in Preview right now and Microsoft plans to release this by September 2019. We have published v6.0.0-alpha binaries to our Nightly Build Feed on Nuget as well as source-code for a version of SciChart which supports both the .NET Framework 4.5.2 and up, plus .NET Core 3 SDK.
The features of v6.0.0-alpha are so far a complete mirror of v5.4.0, and we will be mirroring development in both branches, however, be aware that over the coming months we will be deploying new features to v6.0.0 alpha which may include breaking changes. As a result, this version is not recommended for production use, but is available as an early preview for customers who wish to move to .NET Core 3 as soon as possible.
We are looking forward to you to try it out and let us know your feedback!
Bug Fixes
About 30 bugs and minor issues have been addressed in v5.4 and included into 6.0-alpha. Bug fixes are shipped first in our nightly builds and are bundled up and tested for stable releases.
Fixed: SC-4961 the issue when Annotations would set DataContext to Null in OnDetached,
Fixed: SC-4960 AnnotationCreationModifierForMVVM requires 2 clicks for CustomAnnotations,
Fixed: SC-4959 System.IndexOutOfRangeException after the attempt to clear the DataSeries and load a new one,
Fixed: SC-4954 NullReferenceException when empty RenderableSeries and (LogarithmicNumericAxis as XAxis),
Fixed: QNR-298-94133 Problem with Multiple 3D SurfaceMesh Series and AutoRange,
Fixed ZoomPanModifier.ZoomExtentsY does not work for non-master chart surfaces,
Fixed QNR-298-94133 issue with Multiple 3D SurfaceMesh Series and AutoRange,
Fixed SC-4932 ZoomExtentsModifier ignores VisibleRangeLimit for XAxis set as LogarithmicNumericAxis,
Fixed: SC-4929 CustomLabelProvider does not work in the LogarithmicNumericAxisViewModel,
Fixed: SC-4924 Make PieChart paddings configurable,
Fixed: SC-4927 Wrong calculation of major ticks,
Fixed: SC-4511 AnnotationLabels cannot be added via Annotations MVVM API,
Fixed: SC-4920 Heatmap charting performance difference using doubles vs float,
Fixed: invalid Gradient Color Palette when created in code behind,
Fixed: SC-4920 Investigate slow performance of Non-Uniform Heatmap when any type other than Double is used,
Fixed: SC-4916 NonUniformHeatmap continues collapsing on ZoomExtents when x is Double,
Fixed the issue when Hittest test cases would not fill the surface with series sometimes,
Fixed: SC-4918 Polar Chart RolloverModifier Broken When using PolarXAxis Rotation Angle,
Added improvements contributed by the customer for Annotation Modifier 3D,
Fixed: SC-4888 Added color helper to generate random RGB colors. Code refactoring for related test cases,
Fixed: the issue in the Hit-test test case when RenderSeries from previous runs weren’t cleared,
Added Annotation Drag Modifier 3D,
Fixed: SC-4892 Added test cases for many charts with multiple axes,
Fixed: SC-4890 Improved multiple chart test cases: zooming and panning, zoom history manager,
Fixed: dependency order in DotNetCore source solution. Fixes deployment of 3D Source script removing some files needed in twister/model/obj,
Fixed: the 3DChartScatterSeriesOnWalls example camera aware,
Added example to show drawing of scatter series on 3d chart axis walls,
Fixed: RubberBandXyZoomModifier incorrect behavior with the rotated polar chart,
Fixed: SC-4890 issue with reading .csv values for custom culture,
Fixed: SC-4909 the issue when AxisMarkerAnnotation reset the AnnotationCanvas property, added the FormattedValue property to AxisMarkerAnnotationViewModel; cleared code for AxisMarkerAnnotationViewModel.
Fixed: DirectXHelper.TryApplyDirectXRenderer now only applies DirectX when not in the Visual Studio designer, to avoid the DLLNotFoundException of SharpDX dlls reported by our users.
What else are we working on?
We are making some pretty major improvements internally to SciChart as well as continuing to work on our cross-platform 2D & 3D Charts for iOS, Android and in the future Mac OSX and Web. You can find out more about our current roadmap & progress, plus suggest a feature or vote on a featur-request over at https://features.scichart.com.
The SciChart Roadmap is constantly updating. Visit our Features Request portal at features.scichart.com or click on the ‘Request a Feature’ button to find out more
Where to Get SciChart WPF?
We plan to support both versions at the same time now, SciChart WPF v5.4 stable and ScichartWPF v6.0.0-alpha.
Both versions WPF 5.4 and WPF v6.0 are available from:
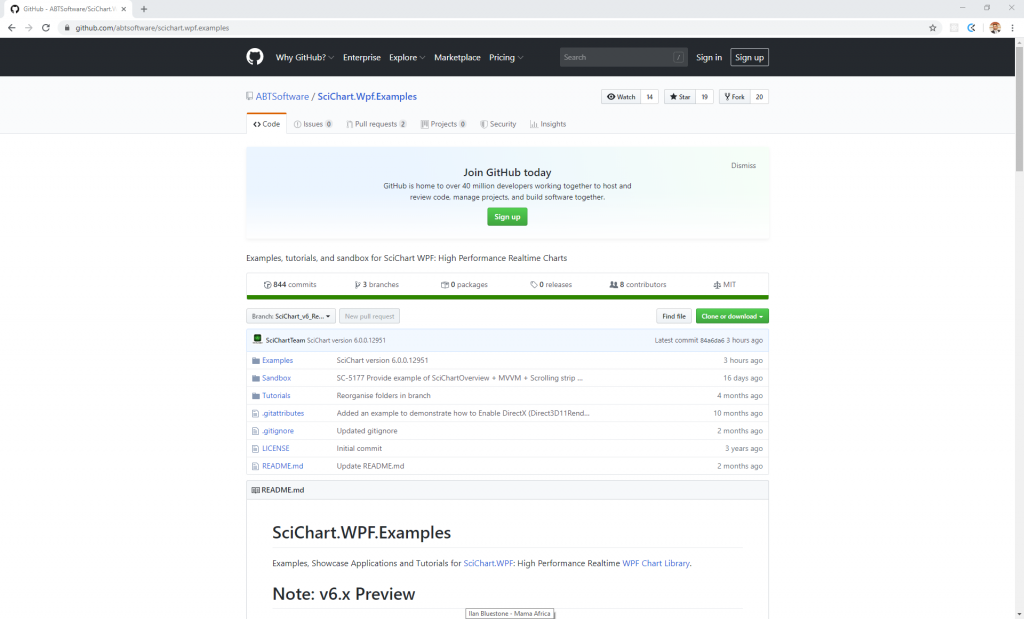
By cloning or downloading the source code on Github (source code customers only).
Please ensure you uninstall the previous version(s) of SciChart before installing the latest version as this can prevent some issues in the upgrade process!
Founder & co-Founder of SciChart Andrew & Adina Burnett-Thompson outside Buckingham Palace
Yesterday, representatives from SciChart, High Performance Realtime Charts attended a Royal Reception at Buckingham Palace in the presence of H.R.H Prince Charles, in honour of the winners of the Queens Awards for Enterprise.
We are honoured to be part of this prestigious award & for SciChart to be selected as a winner in the Innovation Category, 2019.
SciChart featured in the Queens Award Magazine 2019
SciChart features in the 2019 Queens Award Magazine
SciChart Ltd features in the Queens Award Magazine, 2019. The full excerpt of the publiciation is found below.
Founded in 2010, SciChart Designs, developers & sells a software component to businesses and enterprises to draw fast, visually-appealing graphs, graphics and visualisations for the scientific, medical, financial and engineering industries.
Drawing upon his experience as a software consultant from investment banking to scientific research, director and software architect Dr Andrew Burnett-Thompson identified the need for faster graphics and visualisation in business applications in order to quickly display the large amount of data that scientific or financial firms generate.
SciChart’s game-changing innovation was to combine proprietary data resampling algorithms and technology from the gaming industry for speed and performance of graphics with enterprise software applications. This resulted in a software library able to draw charts, graphs and other visualisations many orders of magnitude faster than competitors.
SciChart is published in the Queens Award Magazine, 2019.
As a result, SciChart’s software opened up new markets for its clients, allowing them to create previously impossible projects, where competitor charting software was simply too slow to be usable.
SciChart’s software is now used by all kinds of industries that require fast, real-time, big-data charts, graphs or visualisation on Windows desktop, mobile or embedded systems. Example end-user applications include visualisation of tumour imaging data in cutting-edge cancer research, tracking Formula-1 vehicle parameters during races, analysing real-time financial data for making trading decisions, and providing the charts and graphs for bespoke low-cost ECG devices used in the developing world.
In each of the above examples, SciChart’s fast, real-time charts and graphs enabled customers to bring to market cutting-edge new innovations at a fraction of the cost and time of developing the graphics software themselves. As a result, SciChart has grown organically from a single-person company to a small business with just under 20 full-time staff, with thousands of customers worldwide – and all without outside investment or debt, overtaking established competitors with larger resources. SciChart has secured a position as ‘Best in class’ for charting and graphics software, and continues to innovate, driving performance improvements and supporting new platforms and features, helping its customers to conquer new sectors and drive market share.
Our Commitment to you
We believe that in order to be great, we need to serve our customers well and continue to do what we have been doing so far, for a long time to come.
Our commitment to you in 2019 and beyond is to continue to deliver excellence in the areas of WPF, iOS & Android (mobile) 2D & 3D charts, but also to continue to drive innovation in new areas.
Andrew & Adina at the Queens Awards 2019 Royal Reception
Later this year we will be releasing some major updates to the SciChart SDK as well as continuing to innovate our cross-platform 2D & 3D graphics engine in order to support our current & future products.
Keep an eye on our Roadmap (on the Features request system) as this will tell you where we are taking the product…
We are grateful for our customers who have supported us, some since the very beginning when we started as a small family-owned independent business (Note: we are still family-owned & independent!).
Finally, we believe, for SciChart, the best is yet to come!
When SciChart WPF was born, our first prototype of software
in 2011 aimed to be able to draw 100,000 points in line charts in real-time. At
the time, the nearest competitor in WPF Charts was able to draw no more than
10,000 points, and many competitor WPF charts could draw just a few thousand points
before the computer became too slow to operate.
SciChart’s WPF chart was the first software component in the world to use Bitmaps (rasterized graphics) instead of WPF’s slower, vector graphics. Later we integrated DirectX to WPF. As a result, we have created a new market customers building high-performance, real-time WPF charting applications and our award-winning software now makes impossible projects possible.
Over the years, our performance has improved considerably, but today we give you a new breakthough! In the upcoming SciChart WPF v6, we have increased the performance of our charts up to 100x (10,000%) so that you can now render insanely high point-counts in your application.
Coming soon! Performance Improvements in SciChart WPF v6
We will be making an announcement soon about SciChart WPF v6 – a complete re-write of our charts, containing a completely new proprietary, cross-platform graphics engine enabling a massive performance boost to our WPF charts: up to 100x faster, or 10,000%.
As a preview & tech demo of this incredible technology, we’ve included a tech demo below of drawing 1 billion (1,000,000,000) data-points in real-time at 60 FPS.
Draw hundreds of millions, or up to a billion points in your WPF Chart Applications with SciChart.
Drawing 1 Billion Points in Real-Time
Watch the video below to see a preview of SciChart WPF v6 drawing up to 1 Billion Data-points in real-time. This kind of chart can be used in real-time monitoring or visualising output of telemetry sensors which produce huge data-sets.
The memory usage is extremely efficient, with this application consuming just 8GB of memory to render a billion points. That’s how much memory is required to hold 1,000,000,000 elements of floating-point X,Y data. Our lightweight C++/DirectX charting engine needs just a few hundred megabytes. Your applications will be faster, smoother and more efficient thanks to SciChart’s engineering team.
Download & Run the Source Code
To test out the billion points demo using SciChart WPF v6 Beta, you can download and run the application for yourself. Note that there are some nuget steps to setup in the Readme.md.
In the code you will notice some flags are enabled on the chart to achieve this incredible, record performance:
<!--
	s:VisualXcceleratorEngine.IsEnabled enables our new super fast DirectX 9,10,11 engine

	FallbackType means fall back to this renderer if DirectX not supported

	DowngradeWithoutException=False means it will throw exception if you don't support DirectX, otherwise, silent downgrade

	EnableImpossibleMode enables experimental data-processing algorithms which are up to 100x faster for massive data-sets such as 1-billion points
-->
<s:SciChartSurface s:VisualXcceleratorEngine.IsEnabled="True"
				   s:VisualXcceleratorEngine.FallbackType="{x:Type s:HighQualityRenderSurface}"
				   s:VisualXcceleratorEngine.DowngradeWithoutException="False"
				   s:VisualXcceleratorEngine.EnableImpossibleMode="True">

     <!-- the rest of the SciChart API is unchanged -->

</s:SciChartSurface>
That’s it. The rest of the API is largely unchanged, so you’ll still have the benefit of our XAML-friendly, MVVM capable WPF API and the benefit of backward-compatibility while seeing the performance increase in your WPF Chart applications by up to 100x!
The new Cross-platform SciChart Engine
Our new engine is codenamed Visual Xccelerator. We’re going to be talking about this a lot in the coming weeks and months, but in short, it’s a completely in-house, proprietary, cross-platform C++ game engine, fully GPU accelerated using pixel & vertex shaders, which we’ve built layers on top of to create 2D/3D charts.
With our new engine enabled, we swap out the rendering pipeline for our new, faster, leaner, cross-platform DirectX drawing engine. However, with VisualXcceleratorEngine.ImpossibleMode enabled, we use an experimental data-processing technique resulting in charts with BILLIONS of data-points at 60FPS+. An incredible feat of engineering.
That means the kind of insane performance you see above, we will be able to roll out to other current platforms (iOS, Android) as well as future platforms (MacOS, Javascript/WebAssembly) as we build the API layers.
In fact, the coming performance increases don’t just apply to line charts. We’ll be talking about this in more detail soon, but this is what customers of SciChart WPF have to look forward to in terms of wide-reaching performance improvements.
So how did we achieve this quite frankly incredible charting
performance in a WPF Chart control?
Well, first of, we use DirectX, however we have used DirectX for a long while. What we have done in SciChart WPF v6 is we’ve streamlined our usage of this in every way possible, being as memory efficient as possible, using the GPU rather than CPU to perform intensive computations, even choosing the right techniques to draw geometry that best leverage graphics card resources. In other words, a complete re-write of our DirectX rendering engine to achieve this kind of speed.
Secondly, we’ve moved the core algorithms of SciChart to C++ code. More than just drawing algorithms, we also have a tonne of data-processing algorithms which have been ported over to C++ and now seamlessly interop with C#. Now that the algorithms are in C++ we can do all kinds of techniques to boost speed.
As a SciChart WPF developer you won’t notice that under the hood our chart is using C++, as it will work seamlessly on workstation PCs, you can get our packages from NuGet, you don’t have to worry about C++ deployment at all – we’ve done all the hard work simplifying this difficult task so you don’t have to.
Lastly, we have tuned, tuned and re-tuned again and again
all our critical code paths.
We’ve made huge algorithmic and design changes throughout SciChart.
We’ve analysed hotspots (CPU usage) but also memory usage, to ensure that our charts are super memory efficient, with as few allocations as possible.
We’ve gone so far as to introduce C# / C++ interop to move performance intensive algorithms out of managed code.
During this process we have become experts in ultra-high-performance
graphics & data-processing and have a learned a lot about how modern CPUs
and GPUs work. If you want to hire us to analyse, optimise your applications and algorithms, you
can do so by contacting us, we’d be happy to talk!
The SciChart WPF v6 Release Date
The release for SciChart WPF v6 is imminent, and we will be announcing very shortly. Here’s some notes you need to be aware of prior to the release date.
If you are a customer of SciChart in support subscription, you will be upgraded to SciChart WPF v6 for free. There’s nothing you need to do, and your license key will be re-issued for the next major version upon the release date.
If you are considering whether to buy SciChart now or wait for the release, we are also planning to change our pricing structure and the cost of SciChart WPF will go up. Therefore, its a very good time to contact sales to buy now as you’ll get the new release for free when it comes out.
If your support has lapsed, and you have an active project that still uses SciChart, I’d honestly recommend contacting sales and renewing now before the release date. It will be more cost effective to lock in the renewal price before our big announcement.
Other than that, that’s it! Everything will be announced in due course and we will be rolling out this incredible new version of our high-performance, real-time charting software very shortly.
About our High Performance Team
Founded in 2010, Scichart is headed up by Dr. Andrew Burnett-Thompson, who holds a Masters degree in Electronic Engineering, and a PhD in electronic engineering with signal processing. Andrew and his team are high-performance experts, with experience across programming languages, and platforms, including C#, C++, Java, Kotlin, Swift and niche skills such as algorithm development, C#/C++ or Java/C++ interop, SIMD development, parallel processing, managed or native code performance analysis and more. We can squeeze so much out of WPF that it can now draw 1-billion data-points, how much more value could we add to your performance critical applications?
If you need this kind of expertise in your project, consider contacting us to arrange a consultation.
We’re excited to announce today that we’re starting to roll-out our deployment for SciChart WPF SDK v6, and an official BETA version is now available.
Over the coming weeks we will be beginning to deploy SciChart SDK v6, which features a completely re-written and improved DirectX rendering engine, .NET Core 3 support and more. The deployment will be phased due to changes we’ve had to make in our licensing system (more details on that below).
The biggest change is the introduction of our new Visual Xccelerator engine for up to 100x faster rendering in our WPF Charts. See here for how to Enable the Visual Xccelerator Engine in your applications.
SciChart SDK v6: Visual Xccelerator Engine boosts our WPF Chart performance by up to 100x (10,000%) with performance increases felt across chart types.
We also now fully support .NET Core 3, have dropped the SharpDX dependency, and have had to change our licensing & obfuscation components as third party vendors that we were using before did not support .NET Core 3.
More info will be announced showing the performance test results in great detail when we go to full release!
The SciChart.WPF.Examples source code for v6 can be fetched from Github here.
Shortly, we will be publishing to Nuget.org as well as an MSI Installer as well as a full release note as soon as we are ready.
Licensing SDK v6
The licensing mechanism is completely different in SciChart WPF SDK v6 vs. SciChart WPF v5. Your existing license keys won’t work. Over the coming weeks, we will be rolling out a new licensing server which will be used to activate / deactivate SciChart.
Why have we changed the licensing mechanism?
The old licensing server was reaching its limit of capacity so we have re-designed it as a cloud-based, micro-services .NET Core application based on Azure Functions 2.0 so that we can scale to the number of users and offer you the best possible service.
As part of this work, we’ve had to build a completely new in-house licensing mechanism which works across platforms. The 3rd party .NET Licensing component we were using stopped being supported, so we were unable to use this in .NET Core applications, and since we are now cross-platform and nobody sells cross-platform licensing solutions, we decided to make our own.
This means we’ve not only had to build a server, but also a a new licensing component and also a new Cross Platform Licensing Wizard. All of this is going to be released soon but not before we’ve done really thorough testing & phased deployment of our systems.
Temporary License Keys for SciChart SDK 6
So, to test out SciChart WPF SDK v6 you’ll need to use a temporary (trial / time-limited license key). Your existing license keys won’t work. You can find a trial / time-limited key below, which expires on the 7th December 2019.
Once we are ready to release, we will be publishing new license keys to all customers that are within their support subscription (you will be upgraded for FREE if you are in-support).
// SciChart SDK temporary license key. Expires in 30 days!
// Full license keys will be given for free to customers within support
// subscription when we go to full release

// Call this code, once and once only in your App.xaml.cs constructor
// before any SciChartSurface is instantiated
SciChartSurface.SetRuntimeLicenseKey(@"{
  ""ActivatedBy"": null,
  ""Customer"": ""SciChart v6 BETA (November)"",
  ""DeveloperCount"": null,
  ""ExpiryDate"": ""2019-12-07"",
  ""Features"": [
    ""WPF-2D"",
    ""AND-2D"",
    ""iOS-2D"",
    ""WPF-3D"",
    ""AND-3D"",
    ""iOS-3D""
  ],
  ""IsTrialLicense"": true,
  ""KeyCode"": ""7b6ae352dba5a13a22fc4c51e56e62f4b9811979c1919c8884bbb815c068162a10ca98d9efea5a10522b72af9a6cde8698a9a14f23f90532e6a2aa226a906c793f3ddfe20f59bba6d250634bb3d4434a835a5ac6a07518c7f9e6f99afe13159179ee51cf30efdc296556a6de8000f3a52e5d9be63044e74e03ee77246dac5d16b113983abd4091ca37e77c5a7cca7518676eeb212ac2e4fd154621699033adbbf401b76bdcf5cb05"",
  ""MachineId"": null,
  ""OrderId"": ""NA"",
  ""ProductCode"": ""SC-BUNDLE-SDK-PRO"",
  ""SerialKey"": null,
  ""TicketQuantity"": null
}");
Pricing for SciChart WPF v6
The release for SciChart WPF v6 is imminent, and we will be announcingas soon as possible. Here’s some notes you need to be aware of prior to the release date.
If you are a customer of SciChart in support subscription, you will be upgraded to SciChart WPF v6 for free. There’s nothing you need to do, and your license key will be re-issued for the next major version upon the release date.
If you are considering whether to buy SciChart now or wait for the release, we are also planning to change our pricing structure and the cost of SciChart WPF will go up.
Therefore, its a very good time to contact sales to buy now as you’ll get the new release for free when it comes out.
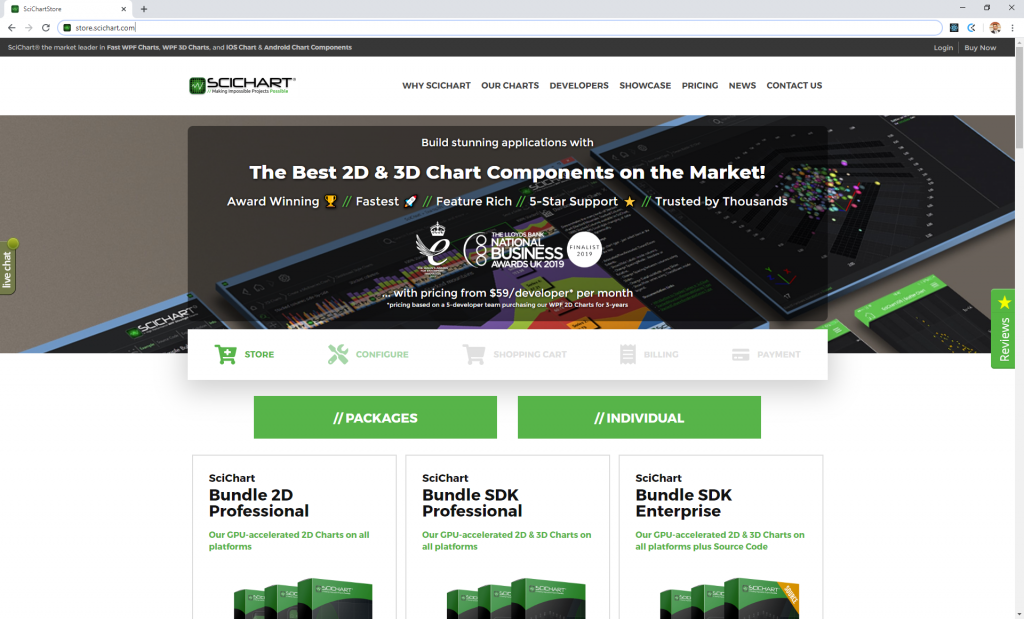
If you want to preview the new pricing, see the development store here showing you what SciChart SDK v6 will cost when we go-live.
If your support has lapsed, and you have an active project that still uses SciChart, I’d honestly recommend contacting sales and renewing now before the release date. It will be more cost effective to lock in the renewal price before our big announcement (see point 2 above)
We will be announcing new product tiers where you can buy all our platforms at once (currently Windows, iOS, Android). These will be called Bundle packages, and will include 2D Charts, as well as Bundle SDK (2D & 3D) and Bundle Enterprise (2D & 3D plus Source Code).
Other than that, that’s it! Everything will be announced in due course and we will be rolling out this incredible new version of our high-performance, real-time charting software hopefully, very shortly.
Please give us your feedback about the new release. Any bugs you report will be fixed & published to the abtsoftware-bleeding-edge nuget feed as soon as possible.
Bear in mind this is BETA software. There are some crashes we know about, namely one or two exceptions in the D3D engine. We do want your feedback, and are working very hard to get it perfect and published as soon as possible.
We’re excited to announce today that we’re starting to roll-out our deployment for SciChart Mobile SDK v3, and an official BETA version is now available.
Over the coming weeks we will be beginning to deploy SciChart Mobile for iOS, Android & Xamarin v3, which features a completely re-written and improved iOS Chart API, performance improvements, and 3D Charts using our new cross-platform in-house 2D/3D graphics engine ‘Visual Xccelerator’.
The deployment will be phased due to changes we’ve had to make in our licensing system, and we are now collecting feedback from our customers & users on the new SDK!
What’s New in SciChart iOS/Android v3?
The biggest thing we’ve added in SciChart iOS/Android v3 is Realtime 3D Charts on mobile devices. Bringing the ability to visualise all kinds of 3D Data, from Surface Meshes for scientific plots, to 3D Point-Clouds for LIDAR data, to 3D Bubble or Scatter charts, 3D Column Charts and more to iOS & Android devices. SciChart is a fully hardware-accelerated (OpenGL, Metal) 2D & 3D chart component allowing you to make impossible projects possible.
SciChart iOS/Android v3 BETA: Supports 3D Surface Mesh charts on native ios, android and Xamarin
Full list of new 3D Chart types can be found below:
All our Mobile 3D Charts are full interactive, with pinch to zoom, touch to orbit/rotate, with dynamic tooltips, legends and more. A quick demo can be found below:
Improved Performance throughout SciChart iOS/Android
By using our cross-platform 2D/3D C++ graphics engine code-named Visual Xccelerator we are bringing hardware-accelerated iOS/Android 2D & 3D charts to iPhone, iPad, Android phone/tablet and Android embedded systems. For the first time making impossible projects in 2D/3D mobile applications a reality.
The SciChart Roadmap includes a cross-platform C++ / OpenGL / Metal / DirectX graphics engine codenamed Visual Xccerator. Rolled out across platforms this is delivering insane performance improvements in our scientific & business chart components.
Performance is improved across platforms, and we will be bringing even more to the mobile platforms in the future, enabling you to build extremely demanding medical, scientific and financial mobile applications that impress your users.
A quick demo of our iOS, Android and Xamarin chart performance can be seen below. SciChart has the world’s fastest chart components on mobile platforms, allowing you to create impossible applications in the medical, engineering, financial or scientific sectors.
View the video above to see SciChart iOS/Android rendering hundreds of thousands, or up to millions of data-points in real-time on mobile devices, enabling a whole host of incredible, dynamic applications which measure and display data from sensors or large datasets.
Add real-time, scientific 3D Charts to your Xamarin applications, as well as blazing-fast real-time 2D Charts using SciChart.
Xamarin.iOS and Xamarin.Android 3D Charts fully hardware accelerated are now possible with SciChart!
Improved and revamped iOS Chart API / Better Support for Swift
SciChart iOS v2 had a flaw which made it difficult or clunky to use in Swift through to the use of a SciGenericType decorator which made the code, well, look bad. By completely revamping the SciChart iOS API we have made some significant strides forward, unifying our API from iOS further with Android/Windows and making it easier to support and to customise the SciChart iOS Charts.
Improvements include:
A completely new, refined for Swift API, while still supporting Objective-C for legacy or performance critical applications.
Improved Metal support (first introduced in SciChart iOS v2.5) for even faster performance. Particularly multi-chart interactions are smoother and faster.
Accessibility hooks allowing you to add accessibility gestures and feedback to your apps.
Re-design of critical parts presentation layer making it easy for us to port to Mac OSX in the coming few months.
Accessibility Hooks
We’ve added accessibility hooks to SciChart iOS & Android v3, so that you can make your application more accessible.
This uses the built-in accessibility options in Android and iOS. You can now add and customise accessibility hooks such as voice-over, talk-back, use of connected keyboard, accessibility gestures across chart elements such as series, Axis, Chart surface and more. We’ve also added accessibility styling including responding to inverted colours. Documentation coming soon on this topic.
Improved Documentation & Tutorials
One of the main complaints we had from iOS/Android v2 was that our documentation was incomplete, with some topics missing or not detailed enough to do the kind of in-depth applications that our customers want to build.
As a result we’ve worked to revamp our documentation throughout, every topic has been updated in SciChart iOS/Android v3 docs, which you can read below.
Due to the massive amount of improvements in SciChart iOS v3, from v2-v3 there are significant breaking changes on the iOS side. On android there should be no breaking changes.
We have prepared a short iOS migration guide here, and if you try to migrate your apps you will find lots of compilation errors.
Send us examples of the error messages you receive and the code which causes it, and we will update our migration guide to cover as many cases as possible.
Bespoke consultancy is also available. If you require a few hours of our development team’s time to help migrate an application, then contact sales and we will do our best to help.
Where to get Mobile SDK v3 BETA
At the moment we are only publishing to package managers at the moment, however all the locations are found below:
Github repositories containing our v3 Examples code (which reference nuget, cocoapod) can be found above.
At release time we will be publishing frameworks and examples at www.scichart.com/downloads as well as full getting-started guides.
Licensing Mobile v3
The licensing mechanism is completely different in SciChart Mobile SDK v3 vs. SciChart iOS/Android v2. Your existing license keys won’t work. Over the coming weeks, we will be rolling out a new licensing server which will be used to activate / deactivate SciChart.
Why have we changed the licensing mechanism?
As we are moving toward a cross-platform, high performance real-time graphics & visualisation company, and due to a number of challenges we faced on our Windows charts in terms of licensing, we have built our own in-house cross-platform licensing component and cross-platform licensing wizard.
This will give a unified experience across platforms and we will be rolling out the new licensing mechanism soon, once we have thoroughly tested our systems.
With SciChart Mobile SDK v3, developers will need to activate developer licenses to access technical support, and to be able to access source-code (if purchased) and develop applications with the SciChart software. Our licensing terms have not changed – we are still selling perpetual licenses, licensed at design time, with royalty-free redistribution for your apps. All your existing apps in the field will continue to work without any change.
Temporary License Keys for SciChart Mobile SDK v3
So, to test out SciChart Mobile SDK v3 you’ll need to use a temporary (trial / time-limited license key). Your existing license keys won’t work. You can find a trial / time-limited key below, which expires on the 21st December 2019.
Once we are ready to release, we will be publishing new license keys to all customers that are within their support subscription (you will be upgraded for FREE if you are in-support).
Upgrade Pricing to SciChart Mobile SDK v3
The release for SciChart Mobile SDK v3 is imminent, and we will be announcing as soon as possible. Here’s some notes you need to be aware of prior to the release date.
If you are a customer of SciChart iOS or Android in support subscription, you will be upgraded to SciChart iOS or Android v3 for free. There’s nothing you need to do, and your license key will be re-issued for the next major version upon the release date.
If your support has lapsed, then you will not be able to use the new version. In this case, we would recommend contacting sales to renew your subscription.
If you are considering whether to buy now or wait, you can buy now, and will be upgraded for free when Mobile SDK v3 comes out (see above).
We will also be announcing some pricing changes on release date, including new product tiers where you can buy all our platforms at once (currently Windows, iOS, Android). These will be called Bundle packages, and will include 2D Charts, as well as Bundle SDK (2D & 3D) and Bundle Enterprise (2D & 3D plus Source Code).
We welcome your BETA Feedback!
Please give us your feedback about the new release. Any bugs you report will be fixed & published to Cocoapods/Maven/Nuget as soon as possible.
Bear in mind this is BETA software. There are some issues we know about. We do want your feedback, and are working very hard to get it perfect and published as soon as possible.
Following on from last weeks announcement on the BETA of version 6 of our WPF Charts SDK, in this article we talk about the new cutting-edge overhaul to our High Performance Real-time WPF Chart component, which we’re calling ‘SciChart WPF: Xccelerated Edition’.
SciChart SDK v6 brings you performance increases of up to 100x (10,000%) across WPF Charttypes, allowing you to create the most demanding scientific, financial and big-data enterprise applications, all without changing or sacrificing our powerful & flexible XAML-friendly, MVVM ready WPF chart API.
Why did we improve performance?
Our charts already provided the cutting edge in data visualisation, providing high performance for real-time and big-data projects, and are used by market leaders in scientific & financial sectors to deliver unbelievable results.
However, our top feature request by our customers was to push the boundaries and limitations of WPF Chart performance even further. Our customers have demanding projects, innovating globally, with a need to visualise more and more data every year. Our users found that as the number of data-points they wanted to visualise increased, or when including intensive graphics such as Band charts, Mountain, or Stacked Column charts in their applications, or complex multi-chart dashboards, better performance was needed to handle hundreds of millions, or even billions of points, especially in real-time.
Above: The SciChart Feature Request portal had ‘improve performance of SciChart WPF’ as the highest rated feature request in 2019. So, you asked, we delivered!
SciChart WPF was already very fast, exhibiting outstanding performance due to our DirectX rendering pipeline, and optimised data-processing algorithms. However, our clients in sectors such as Aerospace, Engineering, Medical Device manufacturers or even Formula 1 keep pushing the boundary of what is possible by creating dashboards with hundreds, even thousands of series, like this one below (see case study).
Above: an example of a real-time racing car dashboard built by a customer of SciChart. Telemetry data from over 300 sensors was transferred from the race car to the WPF software, which monitored braking, acceleration, engine performance acceleration and forces. Complex applications will benefit from the extreme performance enhancements in SciChart WPF v6.
Knowing what our top clients in Formula 1, Medical Device, Engineering & Aerospace sectors needed to achieve in their project goals, we set about to implement a more optimal solution for complex, real-world scenarios.
Having invested into R&D and recruiting experts around the world, we have now investigated performance throughout our software and have come up with a revolutionary plan to dramatically improve performance across ALL chart types. Our work has been completed and is ready for release!
Our Solution
We’ve built the worlds most flexible, and fully featured WPF charting component, rated by users as the best WPF chart, but with this popular feature request of ‘faster performance’ we’ve focused on improving our charting speed even more, bringing cutting edge GPU-accelerated technology to sectors such Finance, Scientific, Medical, Aerospace, F1 & more.
SciChart brings you the world’s fastest WPF chart components, up to 100x (10,000%) faster than our previous version, and surpassing all known competitors!
To achieve this, we have built a completely new proprietary cross-platform rendering engine, code-named ‘Visual Xccelerator ’. Our engine fully leverages DirectX/OpenGL/Metal and is implemented in C++ for unbelievable performance. A world first. We’ve combined this with a complete re-write of our SciChart WPF internals, having redesigned the component from the ground up, to fully leverage GPU hardware and to scale with future hardware improvements.
SciChart is now only limited by your computer’s memory bandwidth and GPU capabilities. We’ve pushed the boundaries of graphics and data visualisation and we’ve done it in such a way that these improvements won’t affect our existing XAML-based, MVVM-friendly API and should be for many customers, a drop-in replacement to your existing applications.
Furthermore, to future proof ourselves, our Visual Xccelerator engine allows us to fully GPU accelerate our 2D/3D charts on WPF (Windows) but also iOS, Android and future platforms like MacOSX and even Web. As we roll out our cross-platform vision, we will surpass charts written in JavaScript by orders of magnitude, as the C++ engine is already capable of running on the web.
Performance Results
The resulting performance enhancements really are impossible. SciChart WPF Xccelerated Edition is up to 10,240% faster than SciChart v5.x, on average ~5,000% faster, surpassing all known WPF Chart competitors. You can buy with confidence knowing that with SciChart, you’ll have the world’s fastest WPF Chart at your fingertips, and plot real-time data at warp-speed with our new Visual Xccelerator engine.
Above: Overall performance improvements in SciChart WPF v6 compared to SciChart WPF v5. Now you can plot charts at warp speed with SciChart!
These performance improvements really are application wide, with the new engine enabled (see below), you’ll see improvements straightaway to line charts, scatter, band, mountain, area, candlestick, column, as well as real-time big-data charts.
The CPU usage is significantly lower & memory usage has been optimised as well. With SciChart WPF Xccelerated Edition, more of your computing resources will be free to perform other intensive tasks, and the UI of your applications will be more responsive under even the most demanding conditions.
See below for detailed benchmarks and performance comparisons.
The Performance Test Suite
To test our charts performance internally and measure performance gain as we developed this update, we’ve written a complete test-suite to cover all kinds of WPF Chart performance cases.
Charting performance is complex and must be measured in a variety of ways to see an overall improvement. Line series with millions (now billions) of points is one such test, but what about unsorted freeform XY data, scatter charts, real-time updates? What about band charts, or mountain charts, or thousands of series, or candlestick/OHLC charts? What about chart window resizing tests?
Above: We built a Performance Test Suite internally to check all our chart types, static and real-time cases, and to help us to diagnose and improve performance throughout SciChart, so that we can comprehensively measure, test and demonstrate performance improvements across chart types.
The SciChart WPF performance test-suite (above) has chosen test-cases which pushed our last version (SciChart WPF v5) to the limit, then shows the massive performance improvements in SciChart WPF v6. It includes a number of complex scenarios, such as:
Real-time Chart Performance, When many series (up to 1 Billion Points), when massive arrays or when real-time updating
Real-time Line Charts with appending tens of millions of new data-points per second.
Line charts with unsorted XY Freeform data (up to 10-Million points)
Scatter chart performance, when massive series of Freeform XY data (10 Million Points)
Band Series, a complex geometry when many series / points
Candlestick Series, when many series / points
OHLC Series, often used in financial applications
Column Series
Stacked Mountain / Stacked Column Series
Core data-processing algorithms which are key to the incredible performance you see in SciChart.
We’ve taken the time to develop this comprehensive performance test-suite in-house so that we can measure the improvement across a wide variety of demanding conditions, not just optimise one or two cases and declare ourselves ‘the fastest’. We have confidence that the results we present below are both accurate and a truthful representation of our WPF chart performance, as we’ve gone to extreme lengths to measure, test and optimise rendering speed.
We’ve decided not to publish this test suite, as it could be used by competitors to measure and tune their own chart performance, however, if you or your team would like a tech demo, then please contact us and we would be happy to arrange one.
Below are test results for basic drawing of several different chart types. We’ve gone further than previous iterations of SciChart by improving everything. Not just faster line series or scatter but also Band series, Mountain, Candlestick, Stacked Column … all chart types have gotten the same treatment to dramatically improve performance.
Test case
SciChart v5
SciChart v6
Performance Increase
Line Series 10M Unsorted Data
2.26
31.68
1401.77%
Scatter Series 10M Unsorted Data
6.42
36.46
567.91%
Mountain Series 1k x 1k
0.66
58.39
8846.97%
Band Series 1k x 1k
0.57
58.37
10240.35%
Column Series 1k x 1k
0.91
58.87
6469.23%
CandlestickSeries 1k x 1k
1.4
56.62
4044.29%
OHLC Series 1k x 1k
0.5
57.56
11512.00%
Stacked Mountain 10 x 10k
14.23
59.89
420.87%
Stacked Column 10x 10k
12.78
59.9
468.70%
Above: SciChart WPF v6 Performance improvements for basic chart types including Line, Scatter, Candlestick, Ohlc, Band, Mountain and Stacked Column / Mountain
In summary:
Line Charts with unsorted data (10 Million Points) are now 1,401% faster.
Scatter series (10 Million Points) are 567% faster.
Mountain and Band charts (1,000 series x 1,000 points) are between 8,846% and 10,240% faster.
Column series (1,000 series x 1,000 points) are 6,469% faster.
Candlestick series (1,000 series x 1,000 points) are 4,044% faster while OHLC charts are a staggering 11,512% faster.
Even complex Stacked Mountain and Stacked Column charts are between 420% and 468% faster.
Realtime Drawing Tests
Static chart types are tested above, but what about real-time scrolling or streaming charts?
We’ve made multiple algorithmic changes throughout SciChart to how the data is being processed for rendering on screen and to squeeze every last cycle out of the CPU. The results are staggering. SciChart WPF v6 is up to 6,157% faster for drawing realtime charts, and can now render up to 1-billion points at 60 FPS.
Test case
SciChart v5
SciChart v6
Speedup
FIFO Series Streaming 10M
57.9
59.69
103.09%
FIFO Series Streaming 50M
15.65
60.05
383.71%
FIFO Series Streaming 100M
8.15
60.05
736.81%
FIFO Series Streaming 500M
1.69
59.16
3500.59%
FIFO Series Streaming 1 BN
0.96
59.11
6157.29%
Append 3Million + 10k
37.87
59.63
157.46%
Append 3Million + 100k
14.55
54.39
373.81%
Append 30 Million + 10k
12.5
57.03
456.24%
Append 30 Million + 100k
6.82
51.84
760.12%
The FIFO Tests above show a static number of points scrolling from left to right. For instance, 10 Million, 50 Million, 100 Million, 500 Million or 1 Billion data-points with up to 3,000,000 (3 Million) new data-points added and scrolled to the chart per second, all render at 60 FPS.
The Append Tests start off with a starting number of points (either 3 Million or 30 Million) then append a certain amount as fast as it can to three series. The most challenging test case starts with 30 Million Points and appends 100k to 3 series at 51.84 FPS. A total of over 15 Million new Data-Points per second.
Above: SciChart WPF v6 performance in real-time charts, or big-data charts. We can now render 1,000,000,000 (1 Billion) points at 60 FPS.
Real-time performance improvements of SciChart WPF v6 are absolutely staggering. Make no mistake, these are the world’s fastest WPF Charts by a considerable margin.
Edge Case Drawing Tests
SciChart WPF v5 could draw line charts pretty fast, but if you added in edge-cases such as changing the colour per-point, or including gaps in series with double.NaN, or dashed lines, or digital lines, the extra processing would slow down the chart. In SciChart WPF v6, we have improved all these scenarios. Take a look at the test results below.
Test case
SciChart v5
SciChart v6
Performance Increase
Line Series 1k x 1k default
20.23
59.16
292.44%
Line Series 1k x 1k with PaletteProvider
0.89
34.48
3874.16%
Line Series 1k x 1k Dashed lines
18.3
58.21
318.09%
Line Series 1k x 1k with NaN gaps
8.89
59.49
669.18%
Line Series 1k x 1k Digital Line
12.64
58.8
465.19%
In summary:
The control test (1,000 line series x 1,000 points) is 292% faster.
However … with PaletteProvider (changing colour per point) it is 3,874% faster.
… with dashed lines is 318% faster .
… with gaps in series using double.NaN, is 669% faster.
… with digital (step) line is 465% faster.
These really are our fastest ever WPF charts and the results are astonishing: SciChart WPF v6 is on average 5,000% faster than SciChart v5, and all scenarios perform faster than our previous WPF chart version.
The World’s Fastest Chart
What about competitors? There are other chart vendors claiming they have the world’s fastest WPF Charts, or that they have unmatched performance.
Across a battery of demanding, real-time tests, SciChart not only outperforms all known competitors in terms of refresh rate, but also UI responsiveness, with lower CPU usage and Memory usage, providing you with extremely efficient big-data, real-time data-visualisation.
Note that most commercial or open-source WPF Chart components really don’t come close to SciChart in terms of performance, and the test cases below are extremely demanding (line charts up to 2,000 series x 2,000 points, charts with over 100 Million real-time points, scatter charts with 10 Million points). Against almost all competitor charts, SciChart is several orders of magnitude faster.
Below we’ve chosen one of our strongest competitors in terms of performance, and measured the speed of SciChart WPF v6 Xccelerated Edition vs. their charts.
When compared against this WPF Chart component in almost all cases, SciChart WPF v6 outperforms ‘Competitor A’. Not only higher FPS (frames per second), but also lower CPU usage and lower memory usage in almost all cases. The number of data-points processed per second is higher with SciChart, and in our tests we can comfortably process up to 15 Million new data-points per second at 50 FPS.
Above: When compared vs. even the toughest competitors and most demanding test cases, SciChart outperforms all known competitors in not only drawing speed, but also CPU and memory usage. Tests performed on i9 MacBook Pro 2018 with Radeon 560x Graphics.
You can be assured if you are selecting or evaluating chart components based on performance, that with SciChart WPF v6 ‘Xccelerated Edition’, you will be getting the world’s fastest WPF Chart control in your applications.
If you already had no issue with the performance of SciChart WPF, then you may not feel you need more, but it can’t hurt! Faster WPF Charts will allow you to run your applications on lower-end hardware without harming user experience. It will also free up your CPU for other operations. Perhaps that UI could be a little bit more responsive, or you need the processing power for other tasks on your computer.
If you are one of our customers building a cutting-edge application, or pushing our charts to the limit, we’ve just raised the bar to the point where our software makes impossible projects become possible. This means more data, more dashboards, more visualisation without having to worry about the CPU hitting 100% or user interface lock-ups.
Try it for yourself!
Don’t just take our word for it. These are our fastest ever WPF Charts by a long way, and right now, the fastest WPF chart control in the world, which will give your applications a huge performance boost. You can try it for yourself by downloading the SciChart WPF v6 from NuGet, and using this code to enable the Visual Xccelerator rendering engine.
<!--
	s:VisualXcceleratorEngine.IsEnabled enables our new super fast DirectX 9,10,11 engine

	FallbackType means fall back to this renderer if DirectX not supported

	DowngradeWithoutException=False means it will throw exception if you don't support DirectX, otherwise, silent downgrade

	EnableImpossibleMode enables experimental data-processing algorithms which are up to 100x faster for massive data-sets such as 1-billion points
-->
<s:SciChartSurface s:VisualXcceleratorEngine.IsEnabled="True"
				   s:VisualXcceleratorEngine.FallbackType="{x:Type s:HighQualityRenderSurface}"
				   s:VisualXcceleratorEngine.DowngradeWithoutException="False"
				   s:VisualXcceleratorEngine.EnableImpossibleMode="True">

     <!-- the rest of the SciChart API is unchanged -->

</s:SciChartSurface>
Our Fastest ever charts, offering world-class performance, all in a XAML-friendly, MVVM capable WPF chart library.
Above: The SciChart Roadmap is coming to fruition. We now have a cross-platform 2D/3D engine (supports DirectX, OpenGL, Metal) and are rolling out across platforms, including WebAssembly/Javascript in 2020.
The same graphics engine which is used in our WPF 2D/3D charts is also used in SciChart iOS/Android, allowing for astonishingly fast 2D/3D charts with rich graphics on mobile. By effectively leveraging CPU and GPU, our charts now scale performance with faster graphics processors, so as more powerful graphics cards and more powerful mobile devices are released, you will see even more of a performance boost in your applications.
Visual Xccelerator works on Mac OSX, and even Web. We aim to be delivering to you the worlds fastest, and only, WebAssembly and WebGL powered chart for Javascript and browser applications in 2020.
We’ve built the worlds most versatile charting component on Windows and mobile, and now have the Worlds Fastest Cross-platform 2D/3D charting component, fully focussed on performance, allowing you to make impossible projects possible.
Above: With our new proprietary, cross-platform 3D graphics engine, SciChart SDK v6 is a huge step toward our vision of becoming the market leader in cross-platform real-time charting
How to get SciChart WPF v6 ‘Xccelerated Edition’
We are currently in BETA for SciChart WPF v6, and you can find out how to access the BETA here. Upon release, we will be upgrading existing customers or allowing you to upgrade/renew as follows.
Existing Customers in Support
If you are a customer of SciChart WPF 2D Professional, SciChart WPF 2D Enterprise, SciChart WPF SDK Professional or Enterprise with an active support subscription, then good news! You will get SciChart WPF v6 ‘Xccelerated Edition’ free of charge as part of your support & updates subscription when we release.
There’s nothing to purchase, but you will need to get a refreshed licensing key as our licensing mechanism has changed (more instructions to follow). Head on over to our downloads page to get the latest SDK and install it, and you should be good to go.
Previous Customers with Support Expired
Ahhh … that’s awkward … so you let your support expire? We’re sorry, but you won’t be able to get this edition but the good news is you might still be eligible for a renewal discount if your support expired recently.
Contact sales to find out if you are eligible for any discounts, and in-future, we recommend staying up to date, so that you don’t miss out on great updates like this and have to pay full price to get them.
New Customers to SciChart WPF
If you are a new customer and not yet purchased SciChart WPF, then head over to our online store, where you can see our pricing and get a quote.
Note that SciChart WPF ‘Xccelerated Edition’ will be standard, available as part of SciChart WPF 2D Professional package. All WPF customers will be upgraded to SciChart WPF v6 with Visual Xccelerator. There is no higher edition you need to purchase to get access to our brand new DirectX ready Visual Xccelerator engine.
As a new customer, you’ll receive one-year of technical support & updates, access to our world-class support team, as well as licenses to what is now the world’s fastest, and best WPF charts. What more could you want?!
We provide generous volume discounts, as well as a 50% reduction in cost for second-year or third-year support subscriptions, exceeding many in the industry, keeping the cost per developer per month down for long-running projects. If you need a custom quote, or want to hear more about our pricing or services, then contact sales and we will be glad to help.
When will the full release be?
We’re just as excited as you are to get this release out the door. The software itself is done, we are as we say collecting BETA feedback for minor crashes or issues. What we are waiting on is the new licensing system that accompanies it, which we have had to build/upgrade to make our software fully compatible with .NET Core 3. As soon as we are satisfied that everything is working as expected, we will announce on this site as well as our LinkedIn, Twitter pages that the new release is ready to download.
Finally…
Thanks to everyone who voted on the feature request for faster performance charts! We never would have done it had we not seen the overwhelming response to accelerate our charts to new levels. And thanks to our incredibly talented tech team who have taken an already fast WPF chart and pushed it to the absolute limit of what is possible on modern computing hardware!
At 12:45 UTC we are migrating the licensing services to a new host. We will aim to keep any disruption to an absolute minimum.
Once completed, all services should resume normally!
Update: 13:30 UTC
All systems are go! We have successfully migrated the SciChart licensing, e-commerce and profile servers to new cloud-based micro-services architecture. Running on Azure Functions 2.0, our new systems are much more scalable than before and will allow us to roll out better services to our customers in the coming years.
If you experience any issues with licensing, activation, purchasing or the profile page, contact us and let us know! Although we think the weeks of testing should have paid off!
Once installed, it will automatically update when we push a new release, which is required to stay in sync with our licensing servers. Our licensing wizard entirely replaces the SciChart WPF v5 Licensing Wizard for our WPF customers, and the online activation method for mobile customers.
Running the Licensing Wizard for the First Time
After download, run the Cross Platform Licensing Wizard by searching ‘SciChart Licensing Wizard’ in the start menu (Windows), or spotlight (Mac).
Login using your scichart.com username and password. If you don’t have an account, you can create one here.
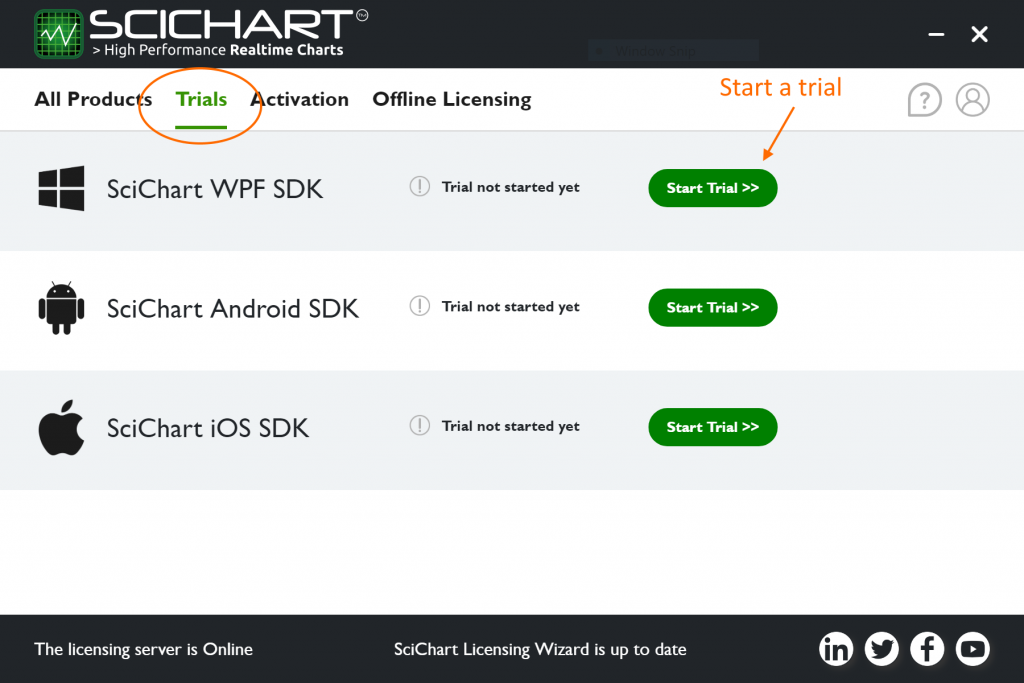
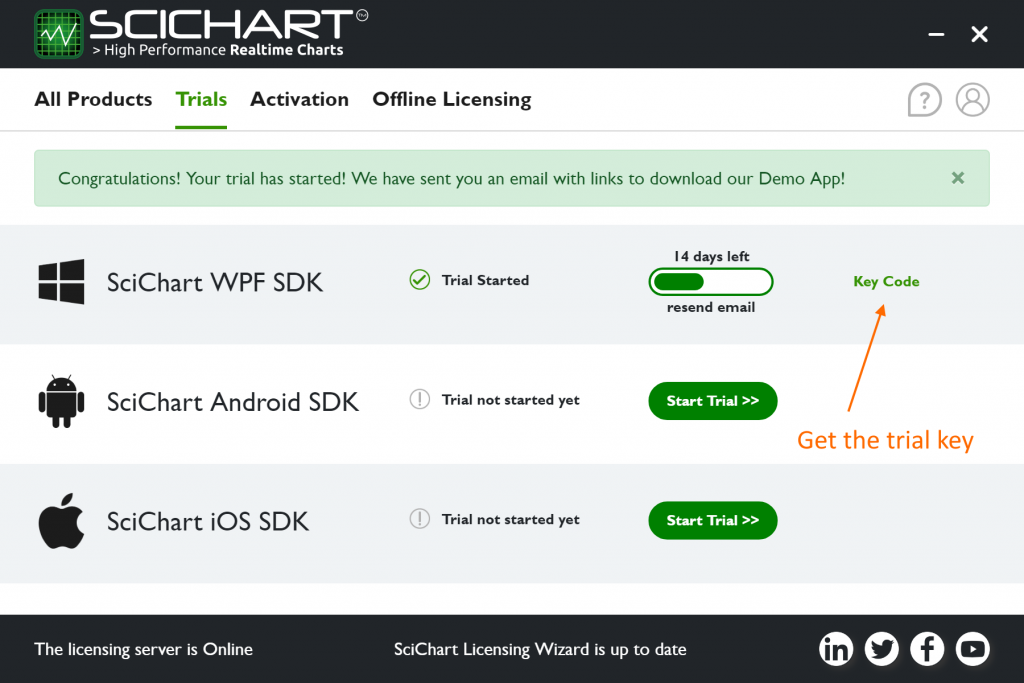
Starting a Trial
The trial mechanism for SciChart WPF SDK v6 and Mobile SDK v3 has changed. In previous versions of SciChart WPF ‘it just worked’ for 30 days. Now, you need to request a trial and include as a runtime key in your app.
The trial is fully featured and time-limited. If you require extra time after 30 days are up, contact us and we will be glad to help.
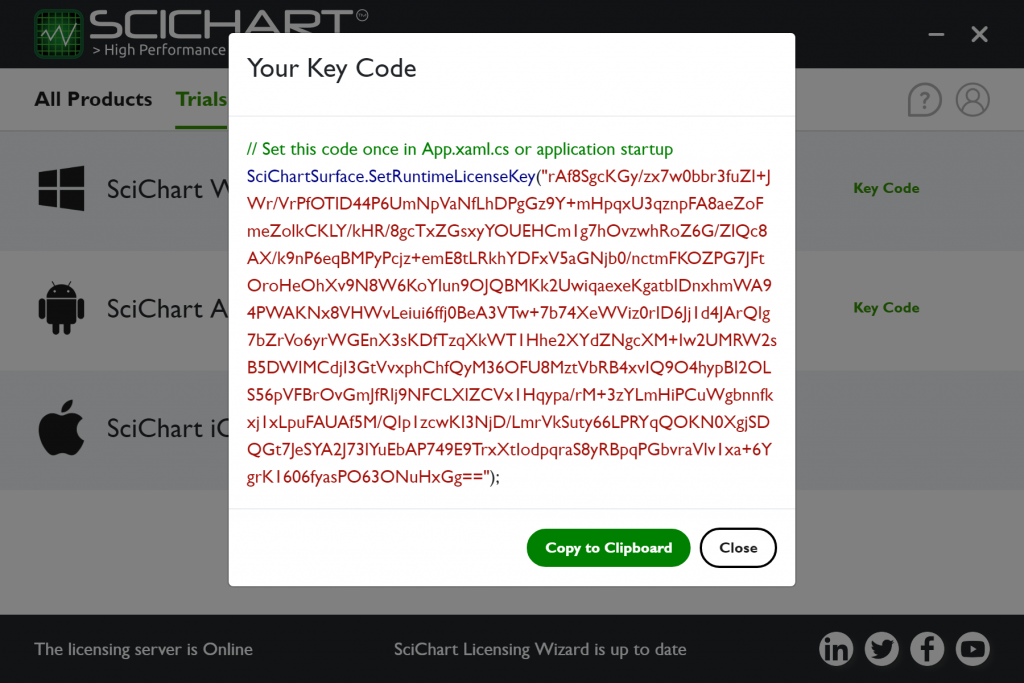
Once you have the trial key code, click the ‘Key Code’ button and include it in your application. It must be included once and once only, before any SciChartSurface is shown.
Note: Trials are machine specific on WPF/Windows. If you transfer the app to another PC, that PC will need to start a trial.
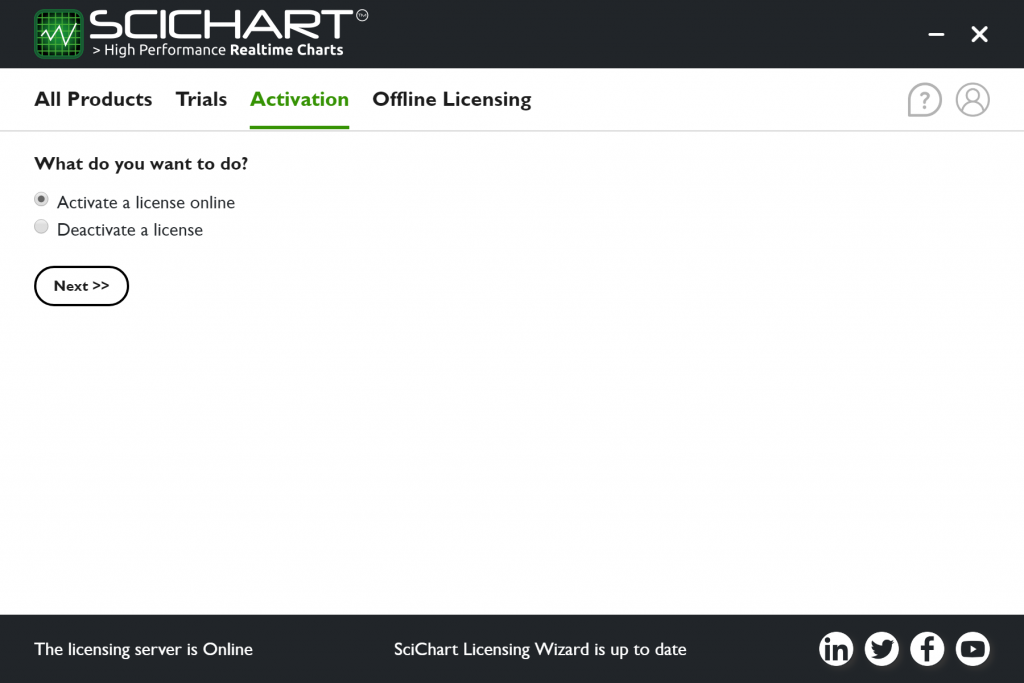
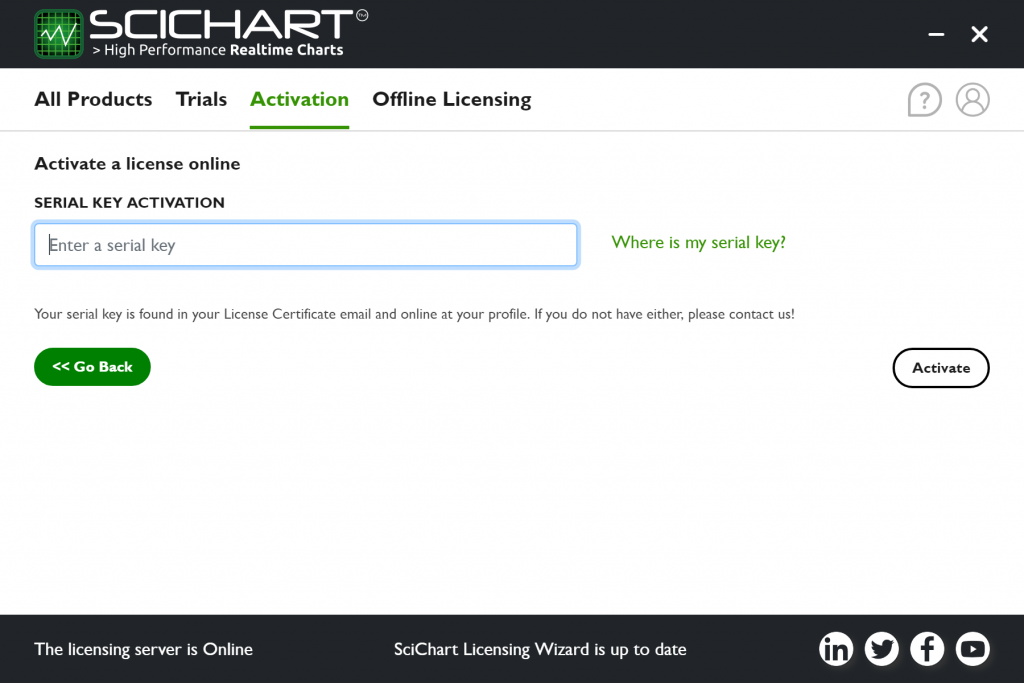
Activating a License
Once you have purchased SciChart, activating a license is simple. Go to the Activations Tab.
Select Activate and enter your serial key
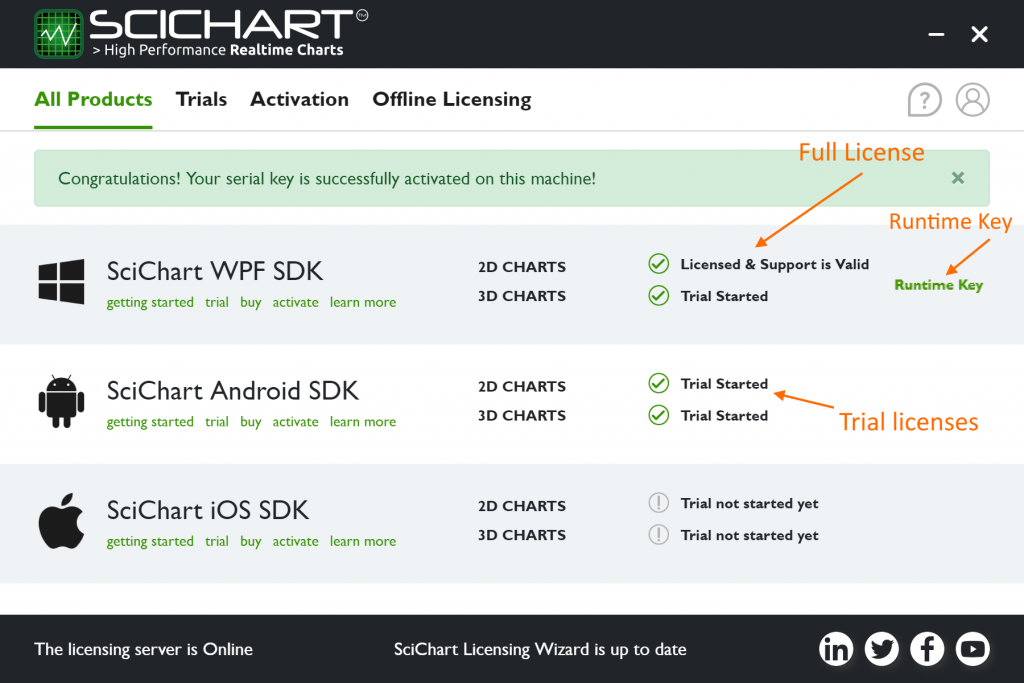
That’s it! The license is now activated on your machine.
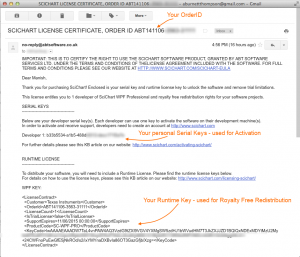
Note: Be sure to include your Runtime Key code in the app to allow you to redistribute it to users. Runtime keys must be included once and once only, before any SciChartSurface is shown.
Activating a License (Offline Mode)
If no internet, or behind a corporate firewall, we have a method to activate using an automated email inbox.
Select the Offline Licensing tab and ‘Request and offline activation code’
Enter your serial key for offline activation
For offline activation, you must email us the request code. If you have Outline or Windows live mail installed, it will open automatically when you click ‘Next’
Send us the email. The automated inbox will process and send you a response code within minutes.
Congratulations! You have successfully manually activated on this machine.
Other Functions in the Cross Platform Licensing Wizard
The SciChart Cross Platform Licensing Wizard can also perform the following functions:
Request a trial for WPF, iOS or Android (under Trials tab)
Activate a license (under Activation tab)
Manually Activate a license offline (under Offline Licensing tab)
Request an offline trial license (under Offline tab)
Deactivate a License (under Activation tab)
Logout (under user profile)
Perform a password reset (Login page)
In the future, we plan to rollout additional functionality such as latest news, updates and release notes, plus bring more platforms to you as we roll out our cross-platform vision for SciChart.
Privacy and your data
As per our previous WPF Licensing Wizard, we have taken steps to ensure privacy and that your data is treated responsibly and in accordance to international laws as per our privacy policy. Data which is collected during operation includes:
Login username, password during authentication is passed to the server (not stored).
Serial key is passed to the server for activation.
Machine ID (hashcode as a unique ID for your machine, with no identifying information) is passed to the server for activation.
IP Address is used to restrict the number of trials that can be started on a particular machine.
All communications are over https / SSL with a second-layer of encryption for sensitive info. Should you have any questions about how our licensing wizard works then contact us and we will be glad to help.
We’d like to hear your feedback!
Please do try and use the SciChart Cross-platform Licensing Wizard to try out trialling or activating SciChart WPF SDK v6, or Mobile SDK v3.
Once we have finished our testing of the new system, we will be proceeding with the release of SciChart WPF SDK v6, Mobile SDK v3 and the new licensing mechanism on 1st Jan.
Following on from our Queens Award for innovation win earlier this year we are excited to make another announcement about SciChart.
SciChart has been honoured by receiving Highly Commended in the Lloyds National Business Awards in the Innovation Category, securing a close fought Second Place!
What are the
Lloyds National Business Awards?
The Lloyds Bank National Business Awards are the flagship awards programme that recognises and rewards excellence across all sectors in the UK. The awards have a range of categories suited for business competing over various aspects.
SciChart entered the Innovation category to showcase our cutting-edge technologies that bring big-data, real-time charting to Windows, iOS & Android Platforms. We went through a rigorous multistage process including presenting live to a panel of UK Business leaders. Earlier this year we made the announcement that we were a finalist and would be attending the awards event in November 2019.
What are the Criteria to win?
This Award recognises the company that successfully applies any form of innovation, celebrating the ideas that have had the greatest impact on an organisation, company or industry.
The Highly Commended status was only afforded in limited categories for outstanding candidates where the competition was especially fierce. SciChart was honoured to be highlighted in this way, demonstrating the impact that our Software makes across sectors.
Making Impossible Projects Possible
During the awards process we had to give a presentation to a panel of tech business leaders & Ceos, including Richard Harris, CEO of Ensygnia, Simon Devonshire OBE, and Alan Rubenstein, former Chief Executive of Pension Protection fund.
A key part of our pitch was how SciChart makes Impossible Projects Possible: the innovations that we ourselves have carried out have in turn inspired innovations around the world.
SciChart demonstrated our novel and innovative approach to data visualisation. Through our initial proposal and live presentation to tech leaders including we showcased our rendering technology, highlighting the impossible projects made possible with SciChart. Key to our pitch was our new cross platform rendering engine Visual XcceleratorTM. This world first for the data visualisation sector was picked up by judges who excelled in their field who then felt it necessary to highlight SciChart with the Highly Commended title. Importantly, the process of entering the award gave us the opportunity to investigate our product, customers and successes to determine where SciChart excelled, tying into our future roadmap.
A key part of our pitch was how SciChart makes Impossible Projects Possible: the innovations that we ourselves have carried out have in turn inspired innovations around the world. From cutting-edge big-data cancer research, to treating Parkinson’s using mobile devices, from Formula One racing to finance and trading. SciChart is used by thousands of customers across industry sectors to visualise big-data: millions, or even billions of data-points in real-time.
Widespread SciChart Usage
The process of preparing for the award yielded some surprising figures discovered during the application. Some of these facts we didn’t even know ourselves, but show the power & flexibility of our charting software.
Stats & figures include:
Over 50% of Aerospace and Defence companies in the fortune 500 use SciChart
80% of Top US/UK Banks use SciChart
All top F1 teams use SciChart
We’ve partnered with over 150 leading Universities and academic research institutes through our Global SciChart Research Partner initiative, including MIT, Stanford & Imperial College London. Their flagship projects include cutting Cancer Screening times from weeks to sub one hour and pioneering Parkinson’s research amongst hundreds of other projects.
70% of top Medical Device Companies Globally leverage SciChart as well as 20% of top Pharmaceutical companies
The two leading global robotics companies use SciChart
Top 20% of US Energy firms are long term SciChart customers
You’ll notice there’s a lot of top or leading companies there and we believe that SciChart is helping these companies to make impossible projects possible, being the cutting edge in their visualisation needs and giving them the competitive edge they need to win.
The Award Ceremony
The award ceremony was attended by representatives of SciChart at Grosvenor house London on 12th November 2019.
The award ceremony was pretty impressive with a keynote speech by Astronaut Tim Peake, talking about his training & time on the International Space Station.
Our takeaway points for 2020
Although we were not winners this time, we were proud to be listed alongside industry giants and receive second place in a seriously high-brow national innovation award. Receiving the title of Highly Commended cements our position as an innovative, industry leader in graphics and visualisation, providing the world’s fastest chart controls on Windows, as well as hardware-accelerated 2D & 3D chart controls on mobile platforms.
Going forward into next year we plan to continue innovating, bringing you our iOS Charts to MacOS, and later in the year our 3D engine, which has already been ported to WebAssembly, will be wrapped for use in Javascript applications including React and possibly other frameworks.
In short, we pledge to continue innovating and making the impossible possible, so that you can make cutting-edge innovative applications which impact the world in a positive way with SciChart.
In many ways 2019 has been an incredible year of growth for SciChart, and I wanted to take the time to sit down and list our achievements this year, so we can show you where and how we are investing in your future applications.
Many customers are delighted with our software, and we consistently receive a 5* rating on external review sites. With this year’s improvements we will help you create innovative, cutting-edge charting applications with incredible performance, helping you win business & outpace your competitors.
Without further ado, here’s a recap of the incredible strides forward our team has made in 2019, plus a look forward to what’s coming in 2020.
Releases and Updates this year
Jan 2019
Last year we made the decision to invest all the previous year’s profits and into hiring staff, to expand and grow the business.
We hired several WPF developers on the SciChart team plus web developers for the site, and we made plans to further expand throughout the year.
In January we also added search-as-you-type to the forum to improve self-help. You can now get suggestions as you type a question, reducing our support load and increasing your speed of finding answers.
The decision to support Metal was an easy one for us, and had caused more than one competitor to quit supporting their products. However, with SciChart we are now future-proof and our real-time charts will work on future versions of iOS without OpenGL ES.
In February we also announced the features request system which allowed our users to request, vote on and comment on feature-requests. This would allow us to listen to our customers and give you more of what you wanted (those of you with active support subscriptions).
We dealt with 3 separate website DDOS attacks and closed out loopholes on the site where bots were overwhelming our systems. Security is high on our list of priorities.
We hired Sales staff to assist with enterprise sales and grow our business, 2D/3D game developers to develop our fast, cross-platform graphics engine as well as staff to deal with first-line tech support.
We also compiled our 3D Engine for the web and demonstrated how SciChart could be used in Javascript applications. Not only will we be able to support javascript charts in the future, but our unique proposition of re-using a C++ graphics engine for web browsers means we can outpace competitors and provide truly real-time 2D/3D graphs for web applications in the future.
We’d spent the year working hard and by now were finishing up SciChart WPF v6, publishing a tech demo of how you can render 1 Billion Points in real-time with the upcoming version. SciChart can literally now make impossible projects possible, and our performance is beyond world-class, enabling a whole host of new cutting-edge data-visualisation applications.
We made further new hires, including a Javascript tech lead who’s initial job was to sort out the Cross Platform Licensing Wizard, now in BETA and future will be leading the development of our web charts.
November 2019
The updates started to come thick and fast this month with a BETA of SciChart WPF v6 announced, featuring our new rendering engine ‘Visual Xccelerator’ with up to 100x faster charts plus .NET Core 3 support. Although we had market leading performance already, some of our clients needed more as speed of visualisation was critical to optimising their applications and workflows.
Soon after a BETA of SciChart Mobile v3, with 3D Charts, performance improvements and documentation improvements on the iOS, Android and Xamarin platforms.
Behind the scenes we had been re-architecting our licensing and e-commerce systems to scale, as at the start of the year we started to experience problems with the load & volume of users. So by December we seamlessly rolled out a new customer management and licensing system, now on a scalable Azure Functions based Micro-services architecture.
Built entirely in-house, the new system offers scalability plus a host of new features for us to issue licenses and perform business functions more efficiently.
The new licensing mechanism will enable us to know who is an active developer of SciChart and who is not, so that we can efficiently focus our technical support and feature-requests on customers with active support subscriptions, providing more value to our paid users.
Support Stats
So we built a heck of a lot of new technology in 2019! But not only that, we also handled a huge amount of technical support.
Our team efficiently managed 1,521 sales requests (4.6 per day)
1,063 support tickets (3.2 per day), each with tens of emails back & forth with tens of thousands of emails read & sent.
Added a whole host of new automated testing to our applications, streamlining further the build, QA and deployment processes to be more efficient in the future.
What’s coming soon
On Jan 6th 2020, we intend to launch SciChart WPF SDK v6 and SciChart Mobile SDK v3. Having been through a solid BETA phase and collected customer feedback, we have tested out both the chart software and the new licensing mechanism and we are finally ready to make the launch. We will do this at the start of the new year when everyone is back in the office!
Next year we will also be building out our roadmap. We intend to bring you fast realtime 2D/3D charts for MacOS as well as SciChart for web, based on our 2D/3D engine compiled to web assembly. This will be a cutting edge advancement on competitor charts on both platforms, since our shared, cross-platform C++ graphics engine enables impossible levels of performance & low CPU/memory usage in charting applications.
We also have new products being announced, and with the launch of SciChart SDK v6 we will be making changes to pricing and licensing of our software. These are detailed below.
WPF Product Pricing Changes in 2020
SciChart WPF 2D Pro – $1299
The price of SciChart WPF 2D Pro will rise from $1099 to $1499 in Jan 2020, with introductory pricing at $1299 for early adopters. This is in-line with inflation over our 7-year history and also in line with our closest competitors.
All customers with SciChart WPF 2D Pro licenses in support subscription will be upgraded for free to v6. Also, as a bonus to our valued customers, all licenses of SciChart WPF 2D Pro will get the new DirectX Visual Xccelerator Engine included, with up to 100x faster WPF Charts, when DirectX was previously only included in the higher priced SciChart WPF 2D Enterprise and SDK editions.
SciChart WPF 2D Enterprise – Discontinued
SciChart WPF 2D Enterprise will be discontinued in Jan 2020. Existing license holders will receive support, updates and the source-code of SciChart WPF 2D until their support expiry. After that, the option will be given to downgrade to SciChart WPF 2D Pro at the renewal cost (50% of list price), or upgrade to SciChart Bundle SDK Enterprise if you wish to continue to have access to source-code (see below).
SciChart WPF SDK Pro – $2099
The price of SciChart WPF SDK Enterprise will rise from $1749 to $2422 on 1st Jan, with introductory pricing at $2099 for early adopters. This is in-line with inflation and also in line with our closest competitors.
All SciChart WPF SDK Pro licenses purchased before the launch will be upgraded for free to this product tier and will receive 2D & 3D Charts as well as the DirectX Visual Xccelerator Engine with up to 100x faster WPF Charts.
With SciChart WPF SDK Pro, you will be able to create demanding scientific & financial applications in both .NET Framework and .NET Core 3 using our powerful hardware accelerated rendering engine.
SciChart WPF SDK Enterprise – Discontinued
This product will be discontinued in Jan. Existing license holders will receive support, updates and the source-code of SciChart WPF 2D/3D until their support expiry. After that, the option will be given to downgrade to SciChart WPF SDK Pro at the renewal cost (50% of list price), or upgrade to SciChart Bundle SDK Enterprise (see below).
Mobile Product Pricing Changes
SciChart iOS 2D Pro, or SciChart Android 2D Pro – $999
SciChart iOS 2D Pro and SciChart Android 2D Pro will each increase in price from $599 to $999 our launch in Jan 2020. With version 3 of our mobile charts, we now offer a feature complete mobile chart with full documentation, Xamarin 2D/3D chart support and extreme performance for enterprise scientific, medical & financial applications.
By pricing to reflect the high level of R&D that goes into these cutting-edge realtime high performance chart controls we will be able to support them for years to come, and make your impossible mobile projects possible.
SciChart iOS & Android 2D Pro – Discontinued
The dual license of combined SciChart iOS & Android 2D pro will be discontinued, however the closest new license type will SciChart Bundle 2D Pro.
Existing license holders will receive support, updates of SciChart iOS/Android 2D Pro until their support expiry. After that, the option will be given to upgrade to SciChart Bundle 2D Pro at the renewal cost (50% of list price), which includes 2D Charts on all platforms. (see below).
This product will be discontinued in Jan. Existing license holders will receive support, updates and the source-code of SciChart iOS & Android 2D until their support expiry. After that, the option will be given to downgrade to upgrade to SciChart Bundle 2D Pro at the renewal cost (50% of list price), or SciChart Bundle SDK Enterprise (see below).
SciChart iOS SDK Pro, or SciChart Android SDK Pro – $1499
As of Jan 2020, we’re introducing new products for 2D & 3D charts on iOS or Android. SciChart iOS SDK Pro will bring you hardware accelerated 2D & 3D charts on the iOS Platform.
There will also be the option to purchase 2D & 3D Charts on all our platforms together in the Bundle SDK Pro packages (see below).
New Bundle Product Pricing
SciChart Bundle 2D Pro – $1699
From Jan 2020 we will be introducing Bundle editions as flagship products.Bundle 2D Pro will include our 2D Charts across all platforms – WPF, iOS, Android, as well as future platforms that we build (during a valid support subscription).
All licensees of SciChart Bundle 2D Pro will receive our WPF charts with DirectX Visual Xccelerator Engine, iOS/Android charts with Metal/OpenGL hardware acceleration and free kick-off meetings with 5+ licenses. Some additional business benefits such as account managers and 2hrs free consultancy are available for site license customers.
SciChart Bundle SDK Pro – $2499
Buyers of the new SciChart Bundle SDK Pro will receive our 2D & 3D Chart components across all platforms – WPF, iOS, Android, as well as future platforms that we build (during a valid support subscription).
All licensees of SciChart Bundle SDK Pro will receive our 2D/3D WPF charts with DirectX Visual Xccelerator Engine, iOS/Android charts with Metal/OpenGL hardware acceleration and free kick-off meetings with 3+ licenses. Some additional business benefits such as account managers and 4hrs free consultancy are available for site license customers.
SciChart Bundle SDK Enterprise – $2999
Buyers of the new SciChart Bundle SDK Enterprise will receive our 2D & 3D Chart components across all platforms – WPF, iOS, Android, as well as future platforms that we build (during a valid support subscription).
This edition will be the only product in our 2020 line up which includes source-code, as the SciChart software is now cross-platform, with much of the codebase in a shared C++ 2D/3D engine.
SciChart Bundle SDK Enterprise will include the C# Source code for WPF 2D & 3D Charts, the Objective-C/Swift source-code for iOS 2D & 3D Charts, the Java source-code for Android Charts and the compiled C++ Visual Xccelerator engine used across platforms. This means you can include the source in your build and modify it, extend it. The C++ Visual Xccelerator Engine source will be held in Escrow for all customers and can be modified with the help of our engineers as part of customisation consultancy.
In addition, many business benefits are found in this tier, including a free kick-off meeting with 2+ licenses, 6-hours free consultancy for site licenses and 15% discount on consultancy work for site license customers.
SciChart SDK v6 Launch Date
We’re now setting January 6th 2020 as our provisional launch date subject to completed BETA testing, at which point we’ll switch over to the new store, new product pricing. All the above are in BETA now and you can test out SciChart WPF v6, as well as SciChart Mobile v3, or the new Cross Platform Licensing Wizard.
Beating the Price Change
If you want to beat the price changes, now is the best time to renew your SciChart licenses.
Get in contact with Sales, check your profile page, or check your email inbox for SciChart Renewal Reminders which contain renewal offers specific to your license. Anyone with an active support subscription will be upgraded to the new version(s) free of charge.
What else is coming next year?
We hinted above at the roadmap and what we’re planning for 2020. With SciChart WPF SDK v6 & Mobile SDK v3 out the way we plan to build the following with our world-class team.
Bringing SciChart to MacOS
Our iOS charts written in Objective-C, Swift and using our cross-platform C++ 2D/3D graphics engine are mostly portable to MacOS. In the past year we have refactored a lot of the code to make the transition to Mac desktop easier. In 2020 you can look forward to hardware-accelerated (Metal, OpenGL) 2D & 3D Charts on Mac desktop applications. This will enable real-time, big-data applications in Finance, Medical, Scientific, Engineering or business sectors on Mac Desktop, and brings us closer to our cross-platform vision for SciChart. We estimate release of this will be earlier in the year, possibly end Q1.
Bringing SciChart to the Web
As previously announced, our 2D/3D graphics engine compiles to and is compatible with WebAssembly, WebGL. We are now starting in earnest to build javascript APIs for SciChart.js – a fast 2D/3D realtime chart control for the web. The huge advantage we have over competitors is that our proprietary cross-platform technology provides fast 2D/3D graphics on all platforms and our web charts, when available, will outperform all known javascript chart vendors due to the use of the above cutting-edge technology.
We estimate release of this will be later in the year, possibly Q3/Q4, and will announce early access previews as soon as we can.
Rollout of Consultancy Services
From time to time, SciChart carries out consultancy and customisation services for our users, where you can hire members of our team for a specific time to solve difficult problems in your applications. Our main areas of expertise include:
SciChart integration, customisation, building custom features.
Performance analysis, in-depth performance tuning of Windows (C#, C++), Mobile (Objective-C, Swift, Java Android) or Xamarin applications.
A wide range of languages and tools including C#, C++, Objective-C, Swift, Kotlin, Java, Javascript, React, T-SQL, WPF, Xamarin, Azure Functions, Rest, Websockets, Encryption & security.
3D Graphics, using DirectX, OpenGL, WebGL or Metal.
Application user-interface development.
Server side & Azure development.
Complex problem solving!
Improvement of Internal Systems
As a customer you don’t see much of our internal systems, nor should you, but we spend a lot of effort making the business as efficient as possible using software. For example, the search-as-you-type on the Forums needs to be brought to the support desk. The general user experience of opening a support ticket needs to be improved. Activation/deactivation of licenses needs to be as smooth as possible, plus, e-commerce integration to allow easy purchasing, renewing and upgrading of licenses.
Throughout the next year we plan to invest in all the above and continue to bring out our cross-platform Vision for SciChart. After that, applications and services which use charts!
And finally …
So, for this year, we hope you see we’ve been working extremely hard to bring you the best possible 2D/3D charting software, having achieved some records, awards, accolades and more and we plan to keep doing so in the new year!
Thank you to all our customers who have supported us this year, reviewed us, encouraged us and of course purchased from us. We hope to make you very pleased about your purchasing decisions in the coming 12 months!
In order to license SciChart iOS v3 and unlock all its features, there is a simple procedure which must be followed. Without this you won’t be able to compile and debug applications built with SciChart iOS. Licenses are unique to all SciChart products, so licenses for another products cannot be used for SciChart iOS Charts and vice versa.
Please be aware before starting usage of the SciChart software constitutes acceptance of the licensing terms & conditions. SciChart is licensed per-developer with a royalty-free redistribution rights for your applications. A helpful licensing FAQ can be found here.
If you wish to purchase a paid SciChart license, you can do so at the store.scichart.com. Likewise, you can download the framework at our scichart.com/downloads page.
In SciChart iOS v3, trial licenses can be fetched with the cross platform licensing wizard. Trial licenses and technical support are tied to a SciChart account, so if you don’t have one, then head over to scichart.com/login and create an account now.
Download the licensing wizard from here and install on your Mac desktop.
Once installed, and you have logged in with scichart.com account, you can start a trial in your chosen platform as follows:
Apply the trial to your application by viewing the KeyCode on the Licensing Wizard.
The KeyCode must be placed in your application once before any SciChartSurface is shown or instantiated, for example AppDelegate (see below).
Applying the Trial License in Your App
The KeyCode must be set in your app once, and once only before any SciChartSurface instance is shown. Do this by calling the static SciChartSurface.SetRuntimeLicenseKey() method in AppDelegate.
//
//  AppDelegate.swift
//  SciChartSwiftDemo
//

import UIKit
import SciChart

@UIApplicationMain

class SCSAppDelegate: UIResponder, UIApplicationDelegate {

 var window: UIWindow?

 func application(_ application: UIApplication, didFinishLaunchingWithOptions launchOptions: [UIApplicationLaunchOptionsKey: Any]?) -> Bool {

        // Note! This is just an example.
        // The real License KeyCode is found by following steps above
        SCIChartSurface.setRuntimeLicenseKey("YOUR_KEYCODE")

        return true
 }

}
//
//  AppDelegate.m
//  SciChartDemo
//

#import "AppDelegate.h"
#import "SCDConstants.h"

// NOTE: Import SciChart.h
#import <SciChart/SciChart.h>

@interface AppDelegate ()

@end

@implementation AppDelegate

- (BOOL)application:(UIApplication *)application didFinishLaunchingWithOptions:(NSDictionary *)launchOptions {

    // Note! This is just an example.
    // The real License KeyCode is found by following steps above
    [SCIChartSurface setRuntimeLicenseKey:@"YOUR_KEYCODE"];

    //...
    return YES;
}

@end
using Foundation;
using UIKit;
using SciChart;

namespace XamarinTestingLicensing
{
    // The UIApplicationDelegate for the application. This class is responsible for launching the
    // User Interface of the application, as well as listening (and optionally responding) to application events from iOS.
    [Register("AppDelegate")]
    public class AppDelegate : UIApplicationDelegate
    {
        // class-level declarations

        public override UIWindow Window
        {
            get;
            set;
        }

        public override bool FinishedLaunching(UIApplication application, NSDictionary launchOptions)
        {
            // Override point for customization after application launch.
            // If not required for your application you can safely delete this method

            SciChart.iOS.Charting.SCIChartSurface.SetRuntimeLicenseKey("YOUR_KEYCODE");

            return true;
        }
    }
}
Once installed, and you have logged in with scichart.com account, you can activate the developer serial you received when you purchased.
After activation you will see your license status on the wizard homepage. You can click ‘Runtime key’ to show the runtime license key that you must include in your app.
The KeyCode must be placed in your application once before any SciChartSurface is shown or instantiated, for example AppDelegate (see below).
Applying the Runtime License in Your App
The KeyCode must be set in your app once, and once only before any SciChartSurface instance is shown. Do this by calling the static SciChartSurface.SetRuntimeLicenseKey() method in AppDelegate.
//
//  AppDelegate.swift
//  SciChartSwiftDemo
//

import UIKit
import SciChart

@UIApplicationMain

class SCSAppDelegate: UIResponder, UIApplicationDelegate {

 var window: UIWindow?

 func application(_ application: UIApplication, didFinishLaunchingWithOptions launchOptions: [UIApplicationLaunchOptionsKey: Any]?) -> Bool {

        // Note! This is just an example.
        // The real License KeyCode is found by following steps above
        SCIChartSurface.setRuntimeLicenseKey("YOUR_KEYCODE")

        return true
 }

}
//
//  AppDelegate.m
//  SciChartDemo
//

#import "AppDelegate.h"
#import "SCDConstants.h"

// NOTE: Import SciChart.h
#import <SciChart/SciChart.h>

@interface AppDelegate ()

@end

@implementation AppDelegate

- (BOOL)application:(UIApplication *)application didFinishLaunchingWithOptions:(NSDictionary *)launchOptions {

    // Note! This is just an example.
    // The real License KeyCode is found by following steps above
    [SCIChartSurface setRuntimeLicenseKey:@"YOUR_KEYCODE"];

    //...
    return YES;
}

@end
using Foundation;
using UIKit;
using SciChart;

namespace XamarinTestingLicensing
{
    // The UIApplicationDelegate for the application. This class is responsible for launching the
    // User Interface of the application, as well as listening (and optionally responding) to application events from iOS.
    [Register("AppDelegate")]
    public class AppDelegate : UIApplicationDelegate
    {
        // class-level declarations

        public override UIWindow Window
        {
            get;
            set;
        }

        public override bool FinishedLaunching(UIApplication application, NSDictionary launchOptions)
        {
            // Override point for customization after application launch.
            // If not required for your application you can safely delete this method

            SciChart.iOS.Charting.SCIChartSurface.SetRuntimeLicenseKey("YOUR_KEYCODE");

            return true;
        }
    }
}
Github Source Code Access
If you are a SciChart iOS Source-Code customer, you can now access the source code via our Github repository. To get access, please follow the steps below:
#1 Activate your SciChart License
You need to activate your SciChart License following the steps above ‘Activating a Paid License’.
#2 Link your account to Github
Now enter your Github Username in the box directly below. If you do not have a Github account, head over to www.github.com and register.
Note: You will need to be logged in to scichart to use the profile page. Please log in at or create an account at www.scichart.com/login if you haven’t already
#3 Respond to Invitation
You will receive an email with an invitation to join the SciChart iOS Github repository! Accept the invitation to get access!
Troubleshooting
If you cannot manage to get your application working with the license applied, please check out our licensing troubleshooting steps below or contact us and we will do our best to help.
Locating License Keys
Your serial key and developer runtime key is found in your License Certificate email and also online at www.scichart.com/profile. If you do not have either, please contact-us!
View your license keys at the profile page
SciChart Licensing Email Example
Trial Expired Problems
Sometimes people report that after distributing their application, the Trial Watermark still appears, or, end users see Trial Expired.
Follow the steps below to debug this.
Check support expiry date: if your support subscription has expired, then you cannot use the latest versions of SciChart. You can check your support subscription at the profile page or in the cross platform licensing wizard. Contact sales to renew your license, as generous discounts are available if you renew promptly!
Check the Runtime License Key is set: Follow the steps above to set your Trial or Paid Runtime License key. Without this, the app will not work!
Ensure Runtime Key is set once, and once only: The SciChartSurface.SetRuntimeLicenseKey method must be called once and once only before any SciChartSurface is instantiated. The best place to do this is in AppDelegate.
In order to license SciChart Android v3 and unlock all its features, there is a simple procedure which must be followed. Without this you won’t be able to compile and debug applications built with SciChart Android. Licenses are unique to all SciChart products, so licenses for another products cannot be used for SciChart Android Charts and vice versa.
Please be aware before starting usage of the SciChart software constitutes acceptance of the licensing terms & conditions. SciChart is licensed per-developer with a royalty-free redistribution rights for your applications. A helpful licensing FAQ can be found here.
If you wish to purchase a paid SciChart license, you can do so at the store.scichart.com. Likewise, you can download the library at our scichart.com/downloads page.
In SciChart Android v3, trial licenses can be fetched with the cross platform licensing wizard. Trial licenses and technical support are tied to a SciChart account, so if you don’t have one, then head over to scichart.com/login and create an account now.
Download the licensing wizard from here and install on your Windows or Mac desktop.
Once installed, and you have logged in with scichart.com account, you can start a trial in your chosen platform as follows:
Apply the trial to your application by viewing the KeyCode on the Licensing Wizard.
The KeyCode must be placed in your application once before any SciChartSurface is shown or instantiated, for example MainActivity (see below).
Applying the Trial License in Your App
The KeyCode must be set in your app once, and once only before any SciChartSurface instance is shown. Do this by calling the static SciChartSurface.SetRuntimeLicenseKey() method in MainActivity or Application.onCreate.
public class YourApp extends Application {

    @Override
    public void onCreate() {
        super.onCreate();
        sInstance = this;

        // Set your license code here to license the SciChart Android Examples app
        // You can get a trial license key from https://www.scichart.com/licensing-scichart-android/
        // Purchased license keys can be viewed at https://www.scichart.com/profile
        //

        try {
            com.scichart.charting.visuals.SciChartSurface.setRuntimeLicenseKey("YOUR_KEYCODE");
        } catch (Exception e) {
            Log.e("SciChart", "Error when setting the license", e);
        }
    }
}
// The main activity for the application
class MainActivity : AppCompatActivity() {

    override fun onCreate(savedInstanceState: Bundle?) {
        super.onCreate(savedInstanceState)

        // Set your license code here to license the SciChart Android Examples app
        // You can get a trial license key from https://www.scichart.com/licensing-scichart-android/
        // Purchased license keys can be viewed at https://www.scichart.com/profile
        //

        try {
            com.scichart.charting.visuals.SciChartSurface.setRuntimeLicenseKey("YOUR_KEYCODE")
        } catch (e: Exception) {
            Log.e("SciChart", "Error when setting the license", e)
        }
    }
}
public class MainActivity : ListActivity
{
    protected override void OnCreate(Bundle bundle)
    {
        base.OnCreate(bundle);
    SciChart.Charting.Visuals.SciChartSurface.SetRuntimeLicenseKey(@"YOUR_KEYCODE");

           // ..
    }
}
To activate the license so that you can receive Technical Support, download the cross platform licensing wizard and install on your Windows or Mac desktop.
Once installed, and you have logged in with scichart.com account, you can activate the developer serial you received when you purchased.
After activation you will see your license status on the wizard homepage. You can click ‘Runtime key’ to show the runtime license key that you must include in your app.
The KeyCode must be placed in your application once before any SciChartSurface is shown or instantiated, for example MainActivity or Application.onCreate (see below).
Applying the Trial License in Your App
The KeyCode must be set in your app once, and once only before any SciChartSurface instance is shown. Do this by calling the static SciChartSurface.SetRuntimeLicenseKey() method in MainActivity.
public class YourApp extends Application {

    @Override
    public void onCreate() {
        super.onCreate();
        sInstance = this;

        // Set your license code here to license the SciChart Android Examples app
        // You can get a trial license key from https://www.scichart.com/licensing-scichart-android/
        // Purchased license keys can be viewed at https://www.scichart.com/profile
        //

        try {
            com.scichart.charting.visuals.SciChartSurface.setRuntimeLicenseKey("YOUR_KEYCODE");
        } catch (Exception e) {
            Log.e("SciChart", "Error when setting the license", e);
        }
    }
}
// The main activity for the application
class MainActivity : AppCompatActivity() {

    override fun onCreate(savedInstanceState: Bundle?) {
        super.onCreate(savedInstanceState)

        // Set your license code here to license the SciChart Android Examples app
        // You can get a trial license key from https://www.scichart.com/licensing-scichart-android/
        // Purchased license keys can be viewed at https://www.scichart.com/profile
        //

        try {
            com.scichart.charting.visuals.SciChartSurface.setRuntimeLicenseKey("YOUR_KEYCODE")
        } catch (e: Exception) {
            Log.e("SciChart", "Error when setting the license", e)
        }
    }
}
public class MainActivity : ListActivity
{
    protected override void OnCreate(Bundle bundle)
    {
        base.OnCreate(bundle);
    SciChart.Charting.Visuals.SciChartSurface.SetRuntimeLicenseKey(@"YOUR_KEYCODE");

           // ..
    }
}
Github Source Code Access
If you are a SciChart Android Source-Code customer, you can now access the source code via our Github repository. To get access, please follow the steps below:
#1 Activate your SciChart License
You need to activate your SciChart License following the steps above ‘Activating a Paid License’.
#2 Link your account to Github
Now enter your Github Username in the box directly below. If you do not have a Github account, head over to www.github.com and register.
Note: You will need to be logged in to scichart to use the profile page. Please log in at or create an account at www.scichart.com/login if you haven’t already
#3 Respond to Invitation
You will receive an email with an invitation to join the SciChart Android Github repository! Accept the invitation to get access!
Troubleshooting
If you cannot manage to get your application working with the license applied, please check out our licensing troubleshooting steps below or contact us and we will do our best to help.
Locating License Keys
Your serial key and developer runtime key is found in your License Certificate email and also online at www.scichart.com/profile. If you do not have either, please contact-us!
View your license keys at the profile page
SciChart Licensing Email Example
Trial Expired Problems
Sometimes people report that after distributing their application, the Trial Watermark still appears, or, end users see Trial Expired.
Follow the steps below to debug this.
Check support expiry date: if your support subscription has expired, then you cannot use the latest versions of SciChart. You can check your support subscription at the profile page or in the cross platform licensing wizard. Contact sales to renew your license, as generous discounts are available if you renew promptly!
Check the Runtime License Key is set: Follow the steps above to set your Trial or Paid Runtime License key. Without this, the app will not work!
Ensure Runtime Key is set once, and once only: The SciChartSurface.SetRuntimeLicenseKey method must be called once and once only before any SciChartSurface is instantiated. The best place to do this is in MainActivity.
In order to license SciChart WPF v6 and unlock all its features, there is a simple procedure which must be followed. Without this you won’t be able to compile and debug applications built with SciChart WPF. Licenses are unique to all SciChart products, so licenses for another products cannot be used for SciChart WPF Charts and vice versa.
Please be aware before starting usage of the SciChart software constitutes acceptance of the licensing terms & conditions. SciChart is licensed per-developer with a royalty-free redistribution rights for your applications. A helpful licensing FAQ can be found here.
If you wish to purchase a paid SciChart license, you can do so at the store.scichart.com. Likewise, you can download the library at our scichart.com/downloads page.
In SciChart WPF v6, trial licenses can be fetched with the cross platform licensing wizard. Trial licenses and technical support are tied to a SciChart account, so if you don’t have one, then head over to scichart.com/login and create an account now.
Download the licensing wizard from here and install on your Windows desktop.
Once installed, and you have logged in with scichart.com account, you can start a trial in your chosen platform as follows:
Note: Once you have done this, the trial will work for SciChart applications on your PC only. If you wish to share the compiled app with a trial license, you will need to set the KeyCode in your application code.See below for instructions.
Setting the KeyCode in your Application
Apply the trial to your application by viewing the KeyCode on the Licensing Wizard.
The KeyCode must be placed in your application once before any SciChartSurface is shown or instantiated, for example App.xaml.cs (see below).
Note: WPF Trials are machine specific at design time, if another developer wants to debug the application you are working on, they will also need to start a trial using the cross platform licensing wizard.
The KeyCode must be set in your app once, and once only before any SciChartSurface instance is shown. Do this by calling the static SciChartSurface.SetRuntimeLicenseKey() method in App.xaml.cs.
using System.Windows;
using SciChart.Charting.Visuals;

namespace YourWpfApplication
{
    /// <summary>
    /// Interaction logic for App.xaml
    /// </summary>
    public partial class App : Application
    {
        public App()
        {
            // Set this code once in App.xaml.cs or application startup before any SciChartSurface is shown
            SciChartSurface.SetRuntimeLicenseKey("YOUR_KEYCODE");
        }
    }
}
Imports System.Windows
Imports SciChart.Charting.Visuals

Namespace YourWpfApplication
    Public Partial Class App
        Inherits Application

        Public Sub New()
            SciChartSurface.SetRuntimeLicenseKey("YOUR_KEYCODE")
        End Sub
    End Class
End Namespace
Once installed, and you have logged in with scichart.com account, you can activate the developer serial you received when you purchased.
After activation you will see your license status on the wizard homepage. You can click ‘Runtime key’ to show the runtime license key that you must include in your app.
Note: Now that you have activated, all applications you create will work on your PC only. To allow applications to work on another PC, you must include the Runtime License Key (see below).
Applying the Runtime Key to Your App
The Runtime Key must be set in your app once, and once only before any SciChartSurface instance is shown. This step is necessary so that you can distribute applications to third party users.
Do this by calling the static SciChartSurface.SetRuntimeLicenseKey() method in App.xaml.cs with the Runtime Key found on the homepage of the licensing wizard.
using System.Windows;
using SciChart.Charting.Visuals;

namespace YourWpfApplication
{
    /// <summary>
    /// Interaction logic for App.xaml
    /// </summary>
    public partial class App : Application
    {
        public App()
        {
            // Set this code once in App.xaml.cs or application startup before any SciChartSurface is shown
            SciChartSurface.SetRuntimeLicenseKey("YOUR_KEYCODE");
        }
    }
}
Imports System.Windows
Imports SciChart.Charting.Visuals

Namespace YourWpfApplication
    Public Partial Class App
        Inherits Application

        Public Sub New()
            SciChartSurface.SetRuntimeLicenseKey("YOUR_KEYCODE")
        End Sub
    End Class
End Namespace
Github Source Code Access
If you are a SciChart WPF Source-Code customer, you can now access the source code via our Github repository. To get access, please follow the steps below:
#1 Activate your SciChart License
You need to activate your SciChart License following the steps above ‘Activating a Paid License’.
#2 Link your account to Github
Now enter your Github Username in the box directly below. If you do not have a Github account, head over to www.github.com and register.
Note: You will need to be logged in to scichart to use the profile page. Please log in at or create an account at www.scichart.com/login if you haven’t already
#3 Respond to Invitation
You will receive an email with an invitation to join the SciChart WPF Github repository! Accept the invitation to get access!
Troubleshooting
If you cannot manage to get your application working with the license applied, please check out our licensing troubleshooting steps below or contact us and we will do our best to help.
Locating License Keys
Your serial key and developer runtime key is found in your License Certificate email and also online at www.scichart.com/profile. If you do not have either, please contact-us!
View your license keys at the profile page
SciChart Licensing Email Example
Trial Expired Problems
Sometimes people report that after distributing their application, the Trial Watermark still appears, or, end users see Trial Expired.
Follow the steps below to debug this.
Check support expiry date: if your support subscription has expired, then you cannot use the latest versions of SciChart. You can check your support subscription at the profile page or in the cross platform licensing wizard. Contact sales to renew your license, as generous discounts are available if you renew promptly!
Check the Runtime License Key is set: Follow the steps above to set your Trial or Paid Runtime License key. Without this, the app will not work!
Ensure Runtime Key is set once, and once only: The SciChartSurface.SetRuntimeLicenseKey method must be called once and once only before any SciChartSurface is instantiated. The best place to do this is in MainActivity.
The Runtime Key does not allow debugging. The Runtime Key is for running the application only. For any users that run the application in a debugger, they will need to purchase and activate a SciChart WPF Developer license.
No Internet Access / Cannot Activate Target Machine
Occasionally, due to corporate firewalls or lack of internet access on developer machines, it is not possible to use the cross platform licensing wizard to activate using the steps above.
In this case, we have a handy mechanism for activating offline, using an email bot to process the activation.
Head over to the page Cross Platform Licensing Wizard and scroll down to the section “Activating a License (Offline Mode)” to find out how.
Check out this Quickest of the QuickStart Guide below which shows you how to open the Examples Suite, work through the tutorials and see what SciChart can do.
Learning by Example – The Examples Suite
The SciChart WPF SDK Installer features a rich examples suite with over 130+ 2D & 3D WPF Chart examples, including full text search, source-code exports and more. You can find out more at the SciChart WPF Examples Suite page.
Start the examples now and have a browse of our 130 2D & 3D chart examples to get familiar with SciChart WPF. We also have a full walkthrough of starting and using the Examples Suite in the SciChart Documentation.
Learn with Tutorials
We now have a full set of tutorials online, to walk you through the basics of getting to know SciChart WPF. These can be found below:
We recommend to learn SciChart quickly, get through the tutorials (MVVM or code-behind) as soon as you can, as they will teach you a lot of techniques quickly (Series, data, real-time updates, tooltips, zooming, panning, legends, annotations and more)
We are also publishing next major versions as an early access preview to this channel.
Make sure if you try to build the examples suite from Github that you add the SciChart nightly-build NuGet feed to Visual Studio. You will also need Visual Studio 2019 & .NET Core 3 SDK to compile all the examples. This is why we have the single-example export feature! It’s quicker and faster to try just one example like this.
Ok Great! So Where is the Documentation?
All of our documentation is online. Please see the following resources to help you get started.
SciChart Documentation atSciChart WPF SDK Documentation (Also viewable from Homepage Menu -> WPF Charts -> Documentation)
We believe you will not find a better-supported WPF Chart than SciChart!
If you have a question, please try our new full site search engine (top of the page), or, dare we say it, Google! This has been custom-built to search the Forums and Knowledgebase, giving you relevant and accurate search results. There are thousands of pages on the SciChart site with content to search from, so if you have a query about SciChart WPF Tooltips, or SciChart Licensing, just try the search and you should be able to find something useful.
But if that’s not enough, you can Contact us anytime and one of our staff will get back to you. We aim to answer all requests within 1-business day.
Check out this Quickest of the QuickStart Guide below which shows you how to start a trial, run the Examples Suite, work through the tutorials and see what SciChart can do.
1. Starting a SciChart Android Trial
In previous versions of SciChart Android, you could download the AARs from Maven or our website and it would ‘just work’ for 30 days. With the release of SciChart Android v3 we have introduced a new cross-platform licensing mechanism which is common to all our platforms.
To get started, download and install the SciChart Cross Platform Licensing Wizard to your Windows or Mac Desktop.
Once you’ve downloaded it, open the SciChart_Android_v3/Examples folder in Android Studio. Next, paste in your license key and build and run the app!
This short 1-minute video shows you how to compile the SciChart Android v3 Examples and include a license key in the app.
Note: Performance is excellent in the simulator if you have Intel Haxm enabled. Also try on a device to see the extreme performance of our Android 2D & 3D Charts!
3. Creating your First SciChartSurface (Tutorials)
We now have a full set of tutorials online, to walk you through the basics of getting to know SciChart Android. Each Tutorial has an Android Studio project which you can find in SciChart.Android.Examples Github repository.
We recommend to learn SciChart quickly, get through the tutorials as soon as you can, as they will teach you a lot of techniques quickly (Creating a project, series, data, real-time updates, tooltips, zooming, panning, legends, annotations and more).
4. Ok Great! So where is the Documentation?
All of our documentation is online. Please see the following resources to help you get started.
SciChart Android v3 Documentation at SciChart Android SDK Documentation (Also viewable from Homepage Menu -> iOS Charts -> Documentation)
We believe you will not find a better-supported Android Chart Library than SciChart!
If you have a question, please try our new full site search engine (top of the page), or, dare we say it, Google! This has been custom-built to search the Forums and Knowledgebase, giving you relevant and accurate search results. There are thousands of pages on the SciChart site with content to search from, so if you have a query about SciChart iOS Tooltips, or SciChart Licensing, just try the search and you should be able to find something useful.
But if that’s not enough, you can Contact us anytime and one of our staff will get back to you. We aim to answer all requests within 1-business day.
During your trial of SciChart Android we will gladly answer your technical questions about the chart. After the trial expires, you may purchase a support subscription to maintain access to technical support & to continue developing with SciChart.
Ok so you’ve downloaded and unzipped the SciChart iOS v3 SDK. Great! Now what?
Check out this Quickest of the QuickStart Guide below which shows you how to open the Examples Suite, work through the tutorials and see what SciChart can do.
1. Starting a SciChart iOS Trial
In previous versions of SciChart iOS, you could download the framework from Cocoapods or our website and it would ‘just work’ for 30 days. With the release of SciChart iOS v3 we have introduced a new cross-platform licensing mechanism which is common to all our platforms.
To get started, download and install the SciChart Cross Platform Licensing Wizard to your Mac Desktop.
Once you’ve downloaded it, open the SciChartDemo.xcodeproj in Xcode.
You’ll need to:
Drag & drop the SciChart.Framework onto the Frameworks, Libraries and Embedded Content for SciChartDemo
Paste your license key into AppDelegate
Run the app!
This short 1-minute video shows you how to compile the SciChart iOS v3 Examples and include a license key in the app.
Note: Performance is much better on a device than in the simulator. Try SciChart iOS on an iPhone, or iPad to see our extreme performance 2D & 3D iOS Charts Library!
3. Creating your First SciChartSurface (Tutorials)
We now have a full set of tutorials online, to walk you through the basics of getting to know SciChart iOS. Each Tutorial has an XCode project which you can find in SciChart.iOS.Examples Github repository.
We recommend to learn SciChart quickly, get through the tutorials as soon as you can, as they will teach you a lot of techniques quickly (Creating a project, series, data, real-time updates, tooltips, zooming, panning, legends, annotations and more).
4. Ok Great! So where is the Documentation?
All of our documentation is online. Please see the following resources to help you get started.
SciChart iOS v3 Documentation at SciChart iOS SDK Documentation (Also viewable from Homepage Menu -> iOS Charts -> Documentation)
We believe you will not find a better-supported iOS Chart Library than SciChart!
If you have a question, please try our new full site search engine (top of the page), or, dare we say it, Google! This has been custom-built to search the Forums and Knowledgebase, giving you relevant and accurate search results. There are thousands of pages on the SciChart site with content to search from, so if you have a query about SciChart iOS Tooltips, or SciChart Licensing, just try the search and you should be able to find something useful.
But if that’s not enough, you can Contact us anytime and one of our staff will get back to you. We aim to answer all requests within 1-business day.
During your trial of SciChart iOS we will gladly answer your technical questions about the chart. After the trial expires, you may purchase a support subscription to maintain access to technical support & to continue developing with SciChart
It’s with great pleasure that we announce to you today that SciChart WPF SDK v6 has now been released! Thank you for all your feedback during the BETA period, in which we have fixed hundreds of bugs and issues, making SciChart WPF SDK v6 ready for production use.
You can get the release right away for free if you are in support subscription by visiting our downloads page.
What’s New?
A full list of what’s new can be found in the article What’s New in SciChart SDK v6. Please take a moment to read it and find out about our incredible new rendering engine which provides up to 100x faster WPF Charts, .NET Core 3 support and more.
By far our biggest feature announcement is the introduction of a brand new rendering pipeline, with up to 100x faster WPF Charts, and 1-Billion Point+ rendering now possible with fully GPU-accelerated charts.
SciChart SDK v6 brings you the world’s fastest WPF chart components, up to 100x (10,000%) faster than our previous version, and surpassing all known competitors! (read more)
Please note that older versions will be overwritten during the installation process. Uninstall previous versions if you get problems during installation.
NuGet.org
The WPF v6 Packages have been published to NuGet.org and to our private nightly build feed at MyGet.org. Note that SciChart.DirectX package has been deprecated, we now advise using the Visual Xccelerator engine in package SciChart.
The new SciChart Store has now been launched, and can be viewed at scichart.com/buy-now. You can buy online with credit card or pay by wire transfer and our automated system will issue licenses immediately.
For enterprise sales and purchase orders, please contact us and we will be glad to help!
Renewals and Upgrades
Existing customers with expired support will be able to upgrade for the next 30-days with a renewal discount (discount amount dependent on your support-expiry date), after that the renewal offer will expire. Please contact sales asap to get a custom quote.
Finally…
Thanks to everyone who voted on the feature request for faster performance charts! We never would have done it had we not seen the overwhelming response to accelerate our charts to new levels. And thanks to our incredibly talented tech team who have taken an already fast WPF chart and pushed it to the absolute limit of what is possible on modern computing hardware!


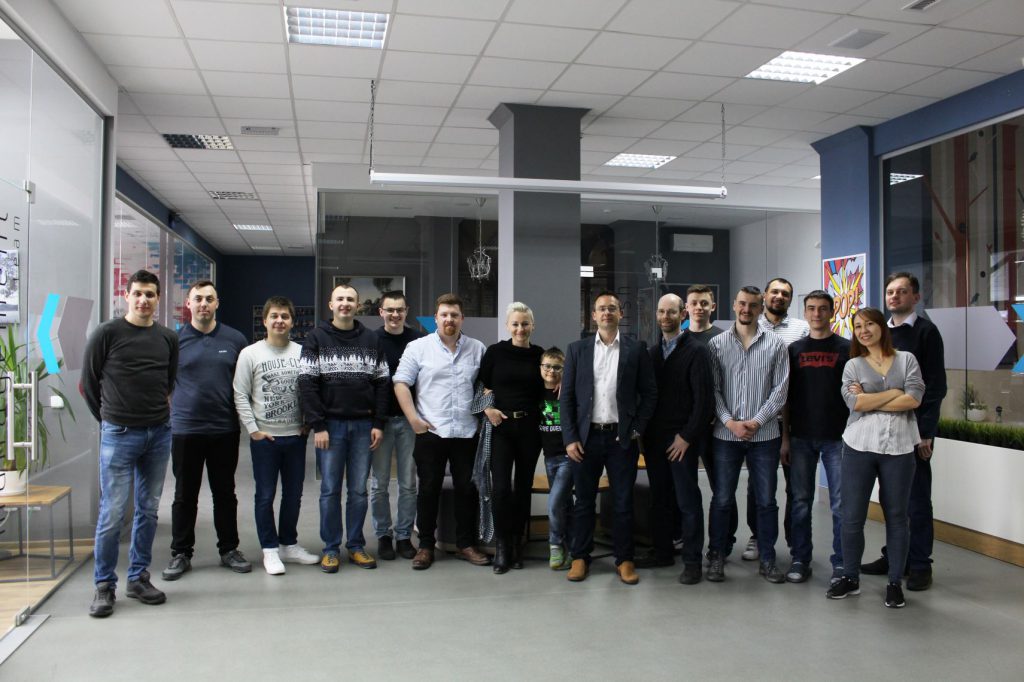


 . We’re going to be talking about this a lot in the coming weeks and months, but in short, it’s a completely in-house, proprietary, cross-platform C++ game engine, fully GPU accelerated using pixel & vertex shaders, which we’ve built layers on top of to create 2D/3D charts.
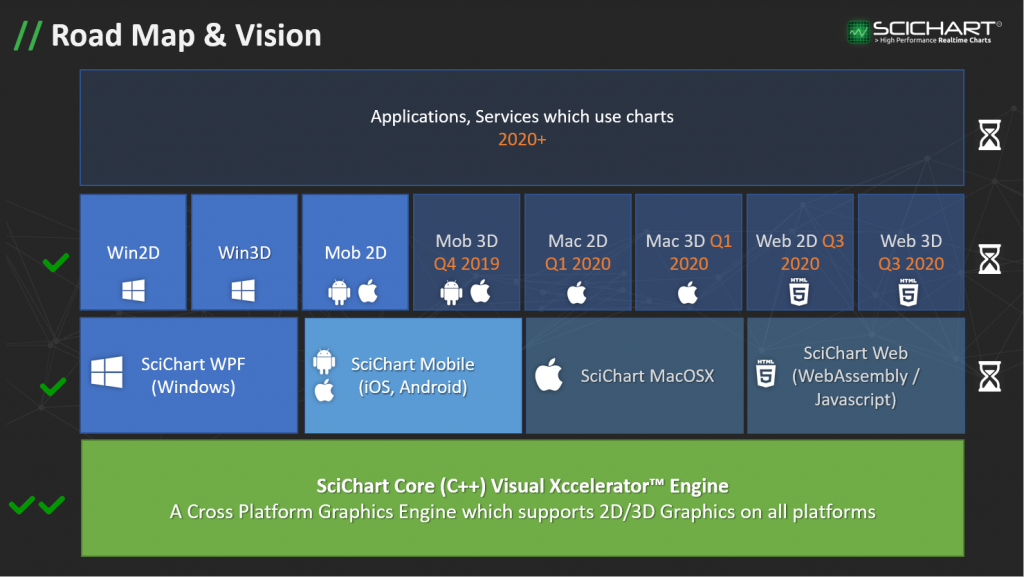
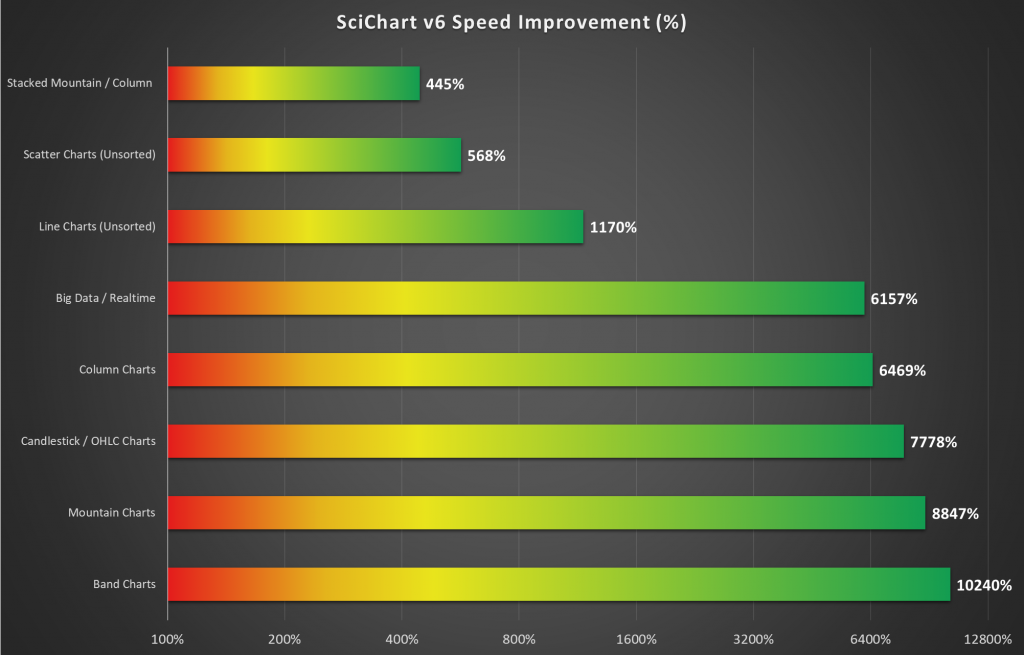

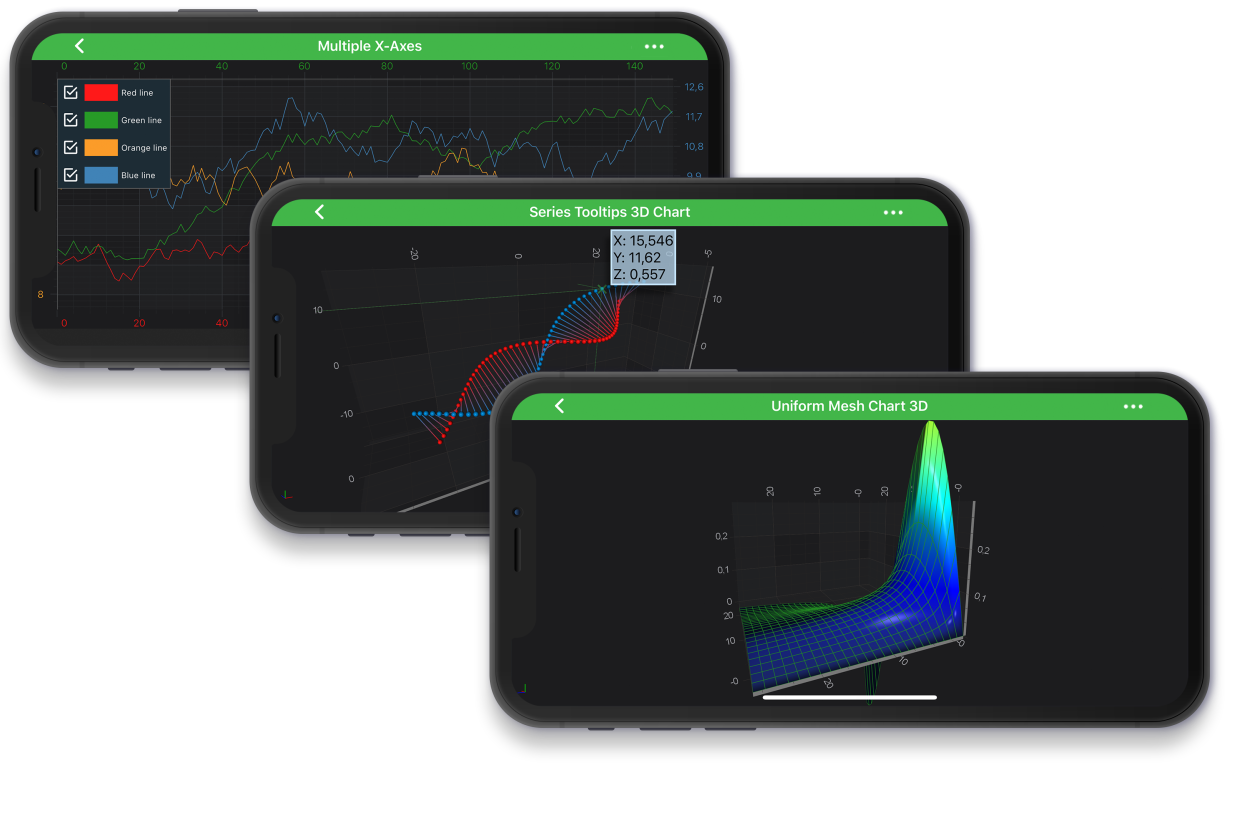
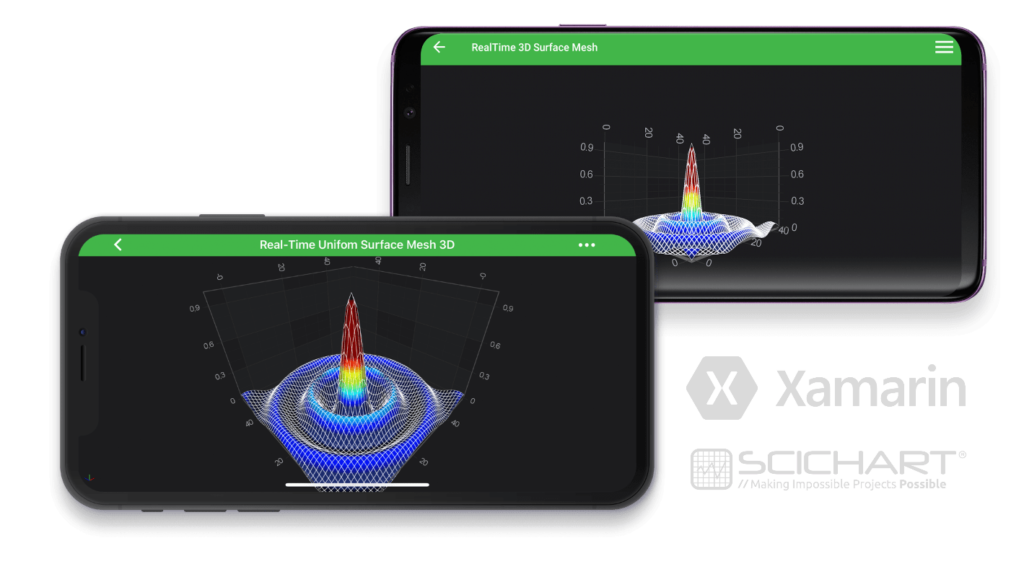
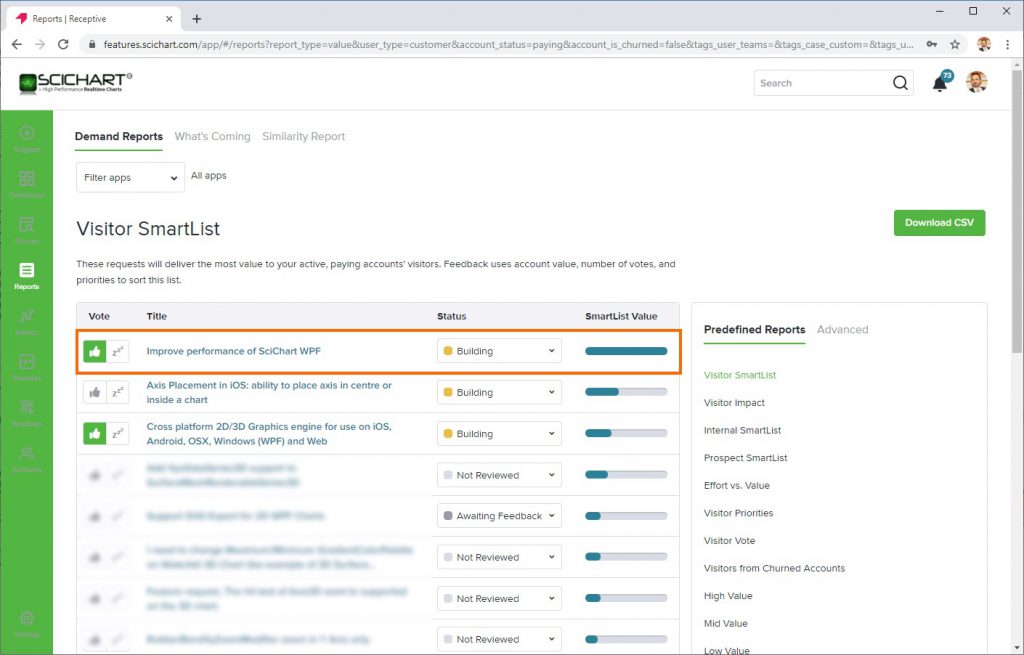
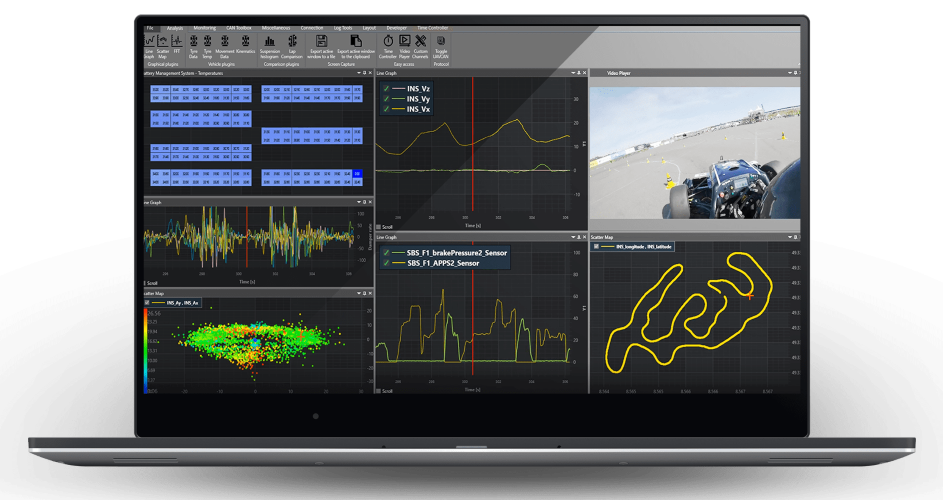

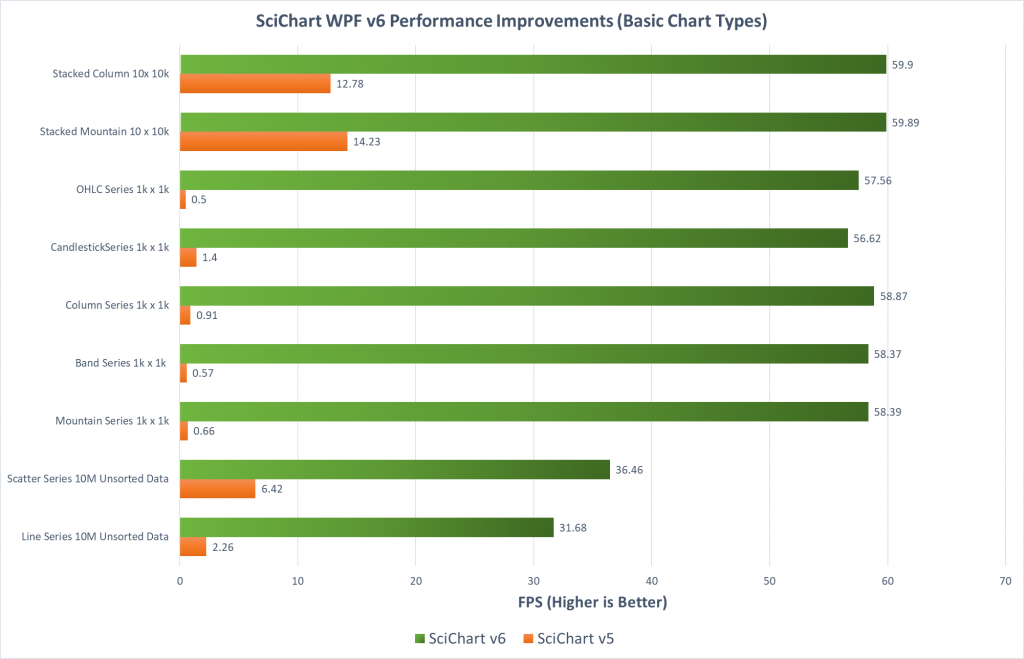
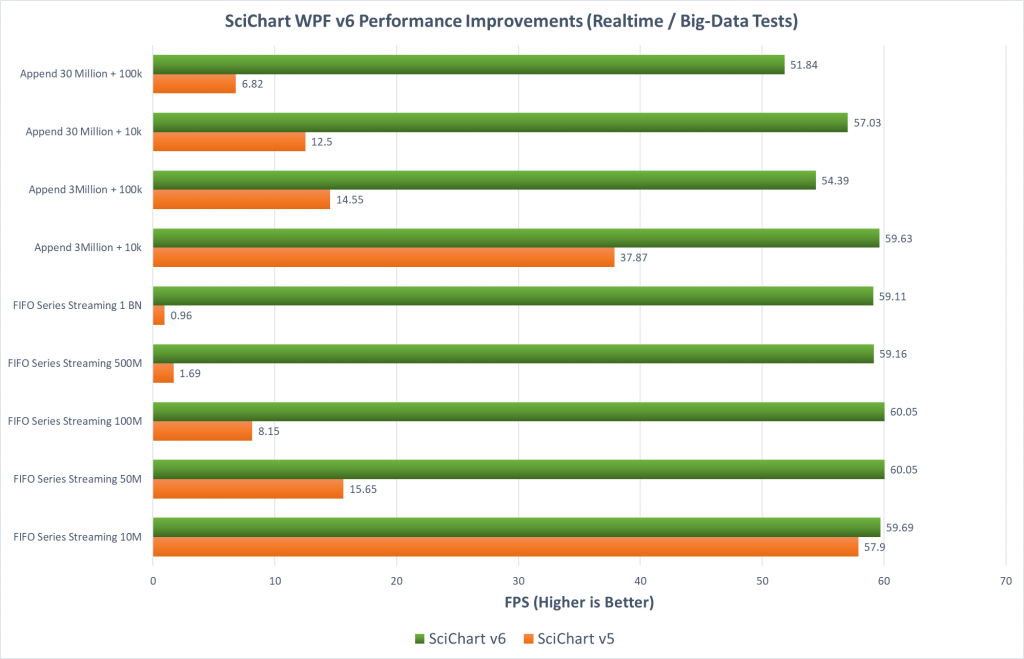
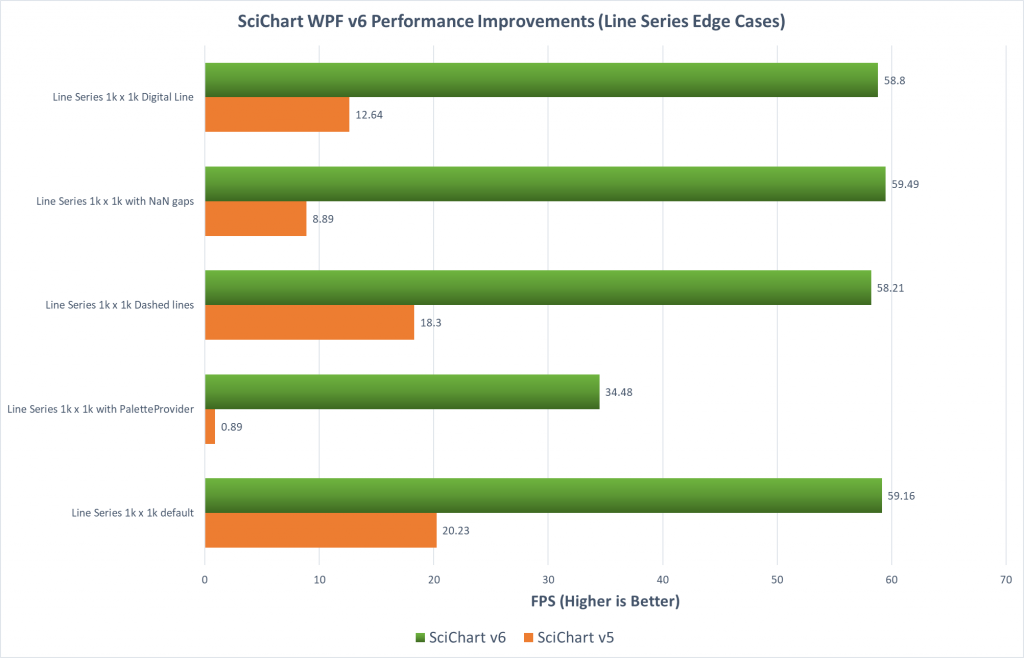
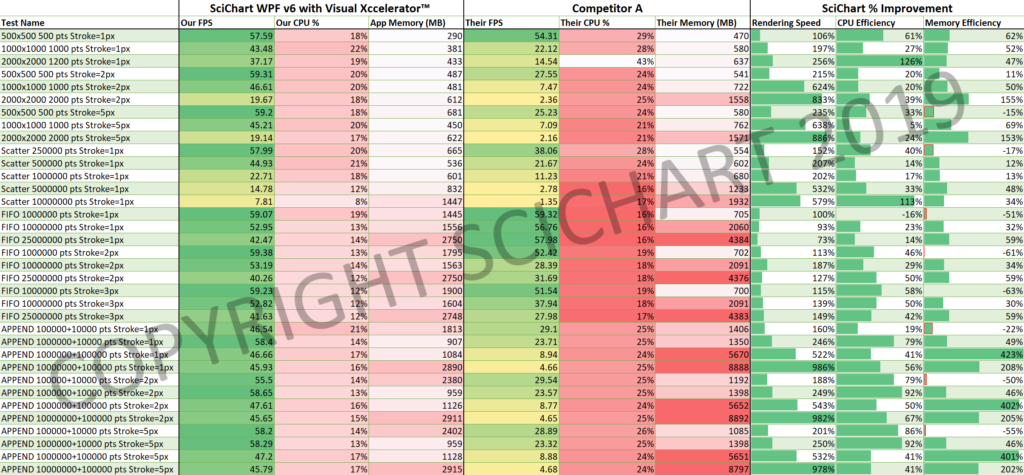

 but the good news is you might still be eligible for a renewal discount if your support expired recently.