At SciChart, we pride ourselves on excellence in technical support and we want you to get a fast resolution to your requests.
In order to maintain an excellent level of service, as of 20th October 2014, we have re-defined our support policy.
What Support Resources do we provide?
All our licenses include access to these online resources:
- Unified site Search Engine – search all of SciChart in one place;
- SciChart Forums – a public forum with Q&A format, where anyone can ask a question;
- Online API Documentation – hundreds of pages of Documentation to help you get started;
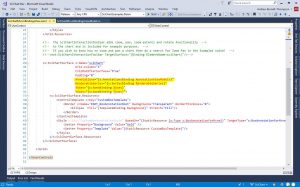
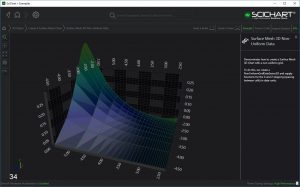
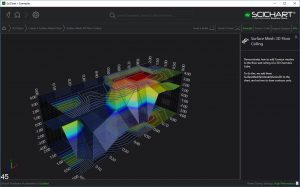
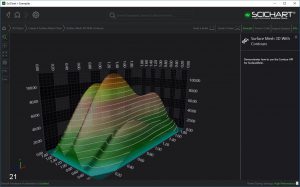
- Examples and Example Source Code – a total of 250 source code examples hosted on Github;
- Blog Posts, Tutorials – Set of 9 Tutorials for each platform;
- Youtube Instructional videos
What is Priority Support?
After 20th October 2014, SciChart customers may choose between Professional packages with and without support, SciChart Source-Code products go with 1-year support always. This is Priority Support and it includes:
- Unlimited, private Support Tickets via our support-desk support.scichart.com*
- 24-hour response time**
*Subject to Fair Usage Policy
**We will respond to your request within 24-hours Monday-Friday 9am-5pm UTC.
What does and does not fall under the support scope?
Our support is handled by the same team of developers, who wrote SciChart and are happy to help you with:
- Bug fixes, please report them with ample information and steps to reproduce;
- Learning how to do “X” with SciChart library;
- Pointing to the right getting started materials to take off with your project;
- Logging new features, which will be prioritized according to fair usage policy.
To see the full functionality of SciChart library we suggest you try to build a proof of concept of your project with the free SciChart trial.
The following is not in the scope of support, however, we are still happy to assist you where we can as a part of consultancy work:
- Creating a proof of concept for your project according to your requirements;
- Custom new features or project parts;
- Speeding up development of the features logged for the future sprints;
- One to one direct contact with our development team over Skype.
Where do the trial users or no-support customers seek for help?
All of the resources mentioned at the top are open to everyone. We welcome unlimited forum requests. Anyone can ask questions on the forum or search. The format is Q&A, similar to StackOverflow. There is also a SciChart Tag on Stackoverflow.We love to answer StackOverflow questions. If you ask questions using this tag, our team will be notified. Please don’t underestimate the self-help: across SciChart WPF, iOS, Android, and Xamarin we have prepared hundreds of pages of Documentation, sets of 9 Tutorials for each platform, 250 source code examples. This all is gathered at SciChart Getting Started Page.
For corporate trial users and purchasing requests, please contact sales@scichart.com.
What do we require from you when requesting support
In order to assist you best, please ensure when requesting support, you give us the following information:
- Your Order ID when requesting support in private tickets (not forums!)
- Clear definition of problem / or question, include screenshots where applicable.
- One question per support-ticket or forum post.
- If reporting a bug, please give steps to reproduce with our examples, or, a code sample we can execute.
- We also need to know what SciChart Version you are using.
For more information, see our Question Asking Guidelines.
What do you describe as Fair Usage?
In order to keep providing our legendary levels of technical support, we have instituted a fair-usage policy for our support services.
- If your volume of tickets or requests exceeds 10x the average, we reserve the right to delay or temporarily de-prioritize support.
- Professional and Source-Code customers will be prioritized over Trial.
- Bugs and feature requests will be prioritized based on the number of users they affect. Critical or wide-reaching bugs will always be given immediate attention.
Finally, with these changes, we hope to align ourselves with industry standards while continuing to provide an excellent level of support/service which is well above what our competitors provide.
Best regards,
[SciChart Support]
The post Support Policy appeared first on Fast, Native Chart Controls for WPF, iOS, Android and Xamarin.