We wanted to take a moment to thank our customers and supporters for the past year, as well as give you feedback on where we have been, and are planning to go as a business. In the past year SciChart has experienced 60% year on year growth, and we have some exciting plans for the future. Read on to find out more about SciChart – The Vision and Roadmap – for 2017 and beyond.
Investment in the Future
After starting business as a consultancy in 2010 and subsequently developing SciChart, by late 2013 we published a Vision for our company for the future, and in 2014 we published that we were experiencing strong sales growth in the face of declining market share from competitors. We continue to see that growth materialise with strong double digit growth figures (60% year-on-year gross sales in 2016) even in the face of very strong opposition, and as a result, we plan to continue investing in research & development of our charts. It’s time to update you on what we plan to do over the coming years, to ensure that SciChart remains a strong competitor in the market of Realtime & High Performance Charting Components.
Releases Happening in the Next Quarter
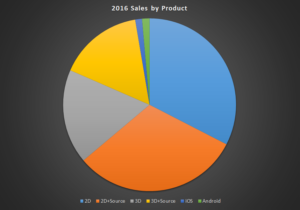
![scichart-2016-sales-by-product-2016]()
SciChart WPF: Strongest Business Area in 2016
SciChart WPF remains our most successful product. Pretty much, 90% of our business comes from the WPF (Windows) platform at the moment, and we anticipate this won’t fall below 80% for at least a year.
As a result WPF is our strongest growth area and where we are investing the most in new technologies and improvements to the SciChart WPF Charting library.
In 2016 we added 3D Charts to our WPF Charting Suite, as well as Ternary Charts, and Pie and Donut Charts. In 2017 we don’t intend to slow down innovation and development of our charting library for WPF, with several new features and chart types out very shortly.
So, below we go through the releases happening in the next quarter for SciChart WPF, iOS and Android.
SciChart WPF v5 (Q1 2017)
SciChart WPF v5 is coming soon. We have done quite a bit of work to improve our already awesome WPF Charts and the next major version (expected in the next 3 months) will include the following:
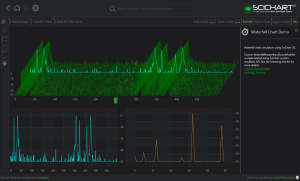
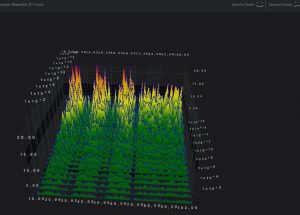
![scichart-2017-roadmap-waterfall-charts]()
SciChart WPF Waterfall3D Chart
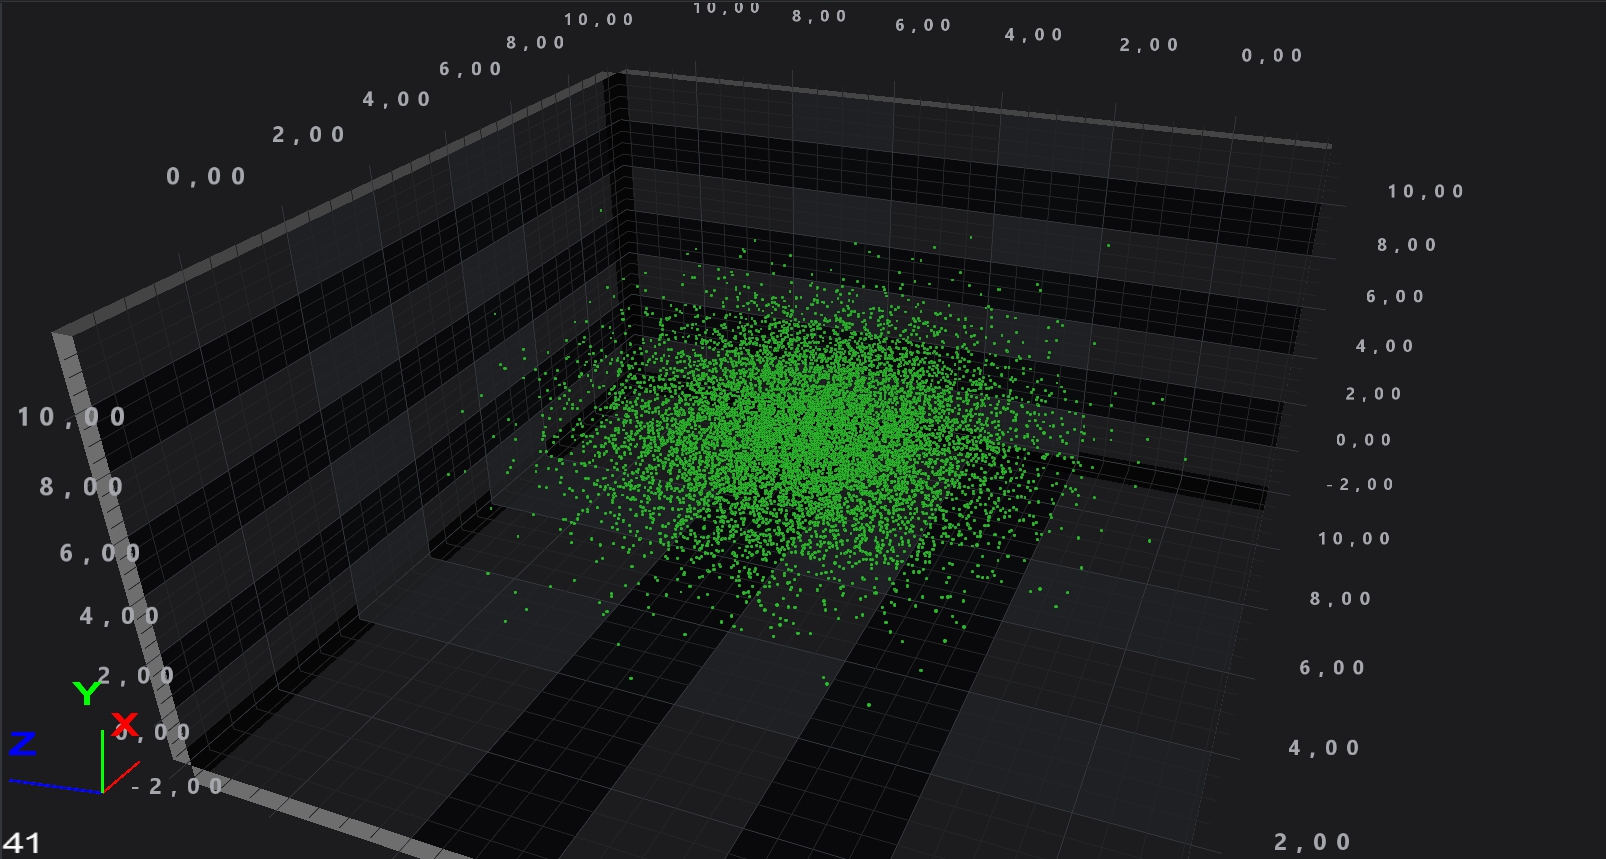
- Considerably faster realtime 3D Point Cloud / Scatter Chart. Up to 10x faster.
- Considerably faster realtime 3D Point Line Chart. Up to 7x faster.
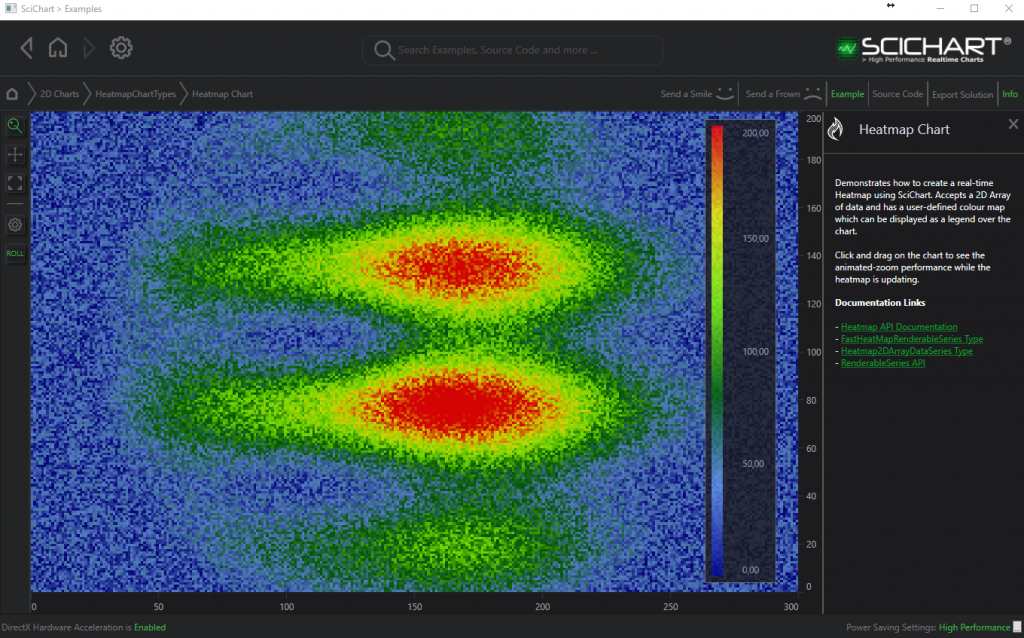
- New Uniform Heatmap 2D Chart type. Up to 10x faster for the special case of realtime uniform heat maps.
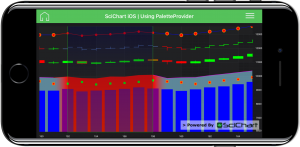
- Support for PaletteProvider in 2D Heatmaps (custom cell colour overriding).
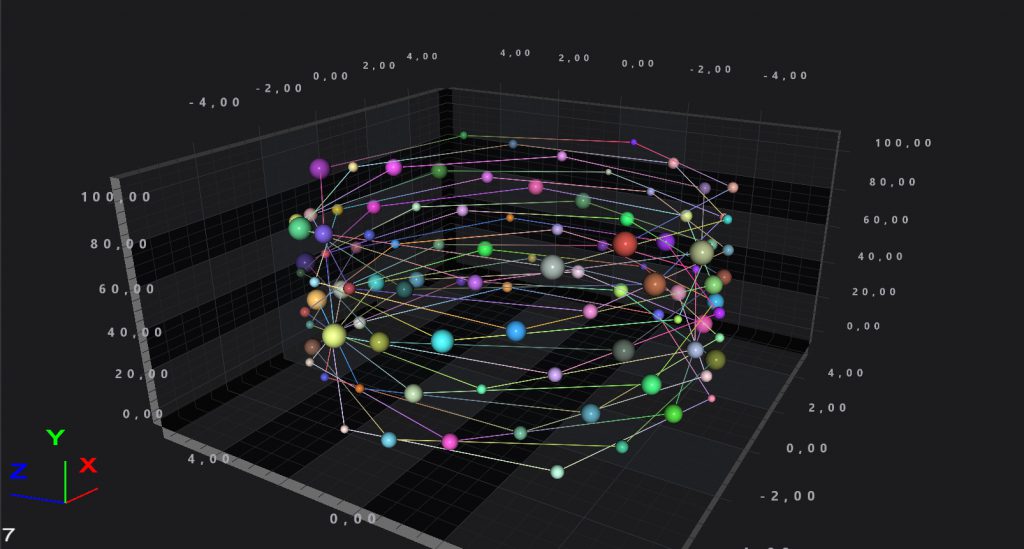
- New 3D Waterfall Chart Type, for viewing area/slices from a 2D array data series, displayed in a 3D Chart. Both realtime and static versions of the chart will be provided.
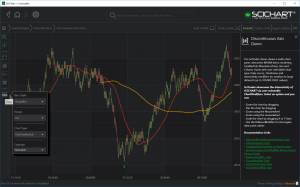
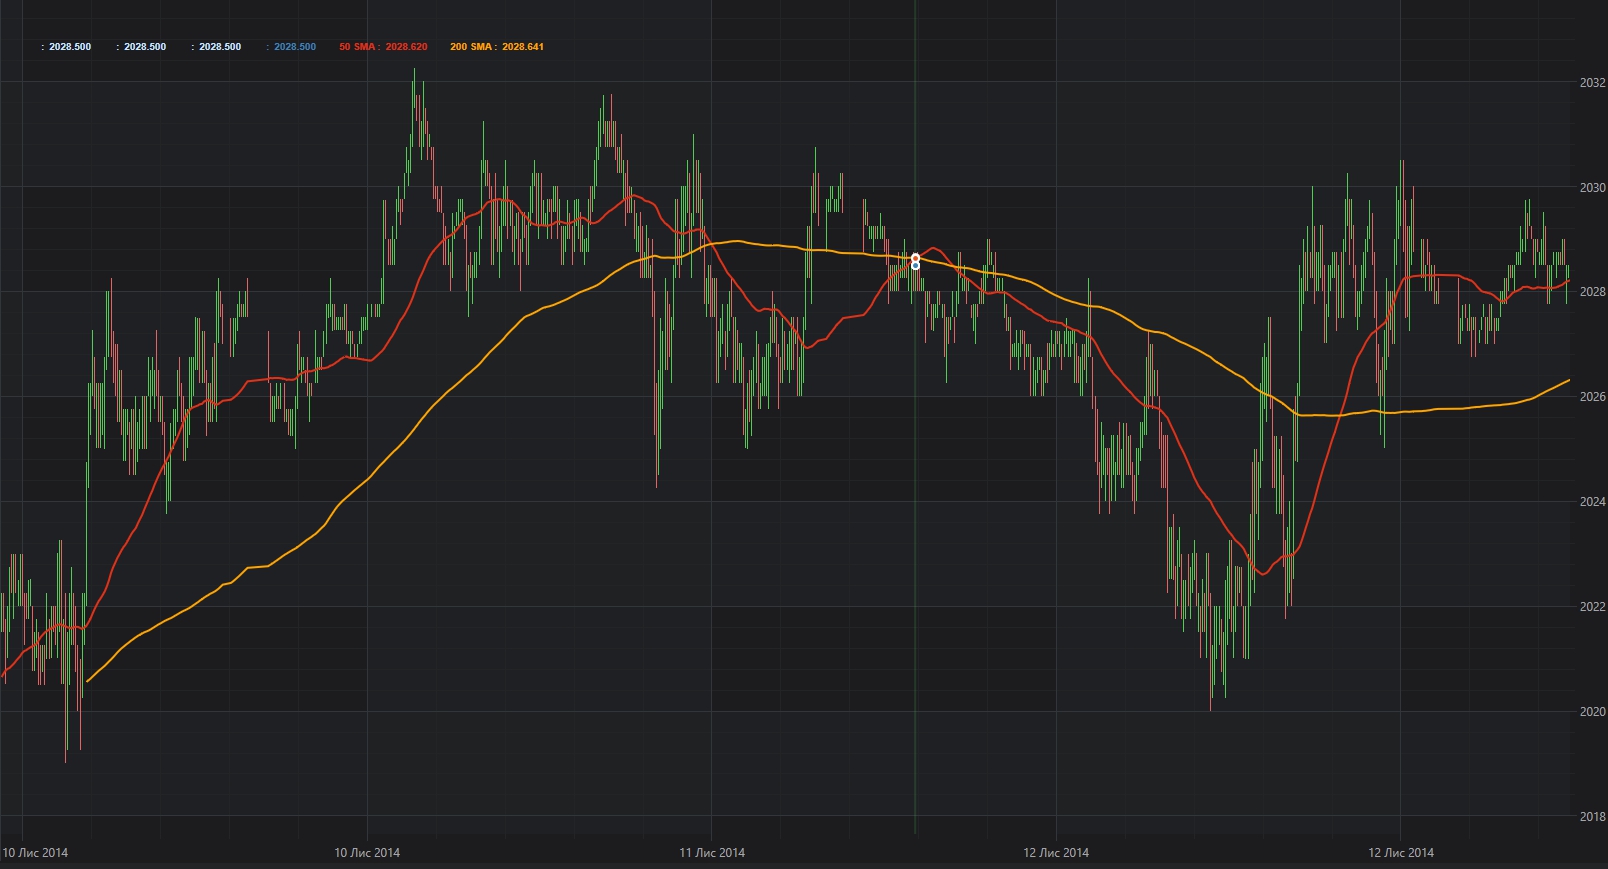
![scichart-2017-roadmap-discontinous-datetime-axis]()
SciChart WPF DiscontinuousDateTimeAxis
- New DiscontinuousDateTimeAxis type. This is a special axis type, specifically for financial / trading charts, which will allow you to skip ranges (overnight, weekend). It will support series with differing lengths for the first time in trading charts. This opens the possibility of all sorts of indicators and filtering techniques previously impossible with SciChart. It will allow you to use Range, Tick, Volume or Time based bars. It preserves the position on Annotations on time-frame changes. It allows showing/hiding of overnight trading on exchanges with extended trading data.
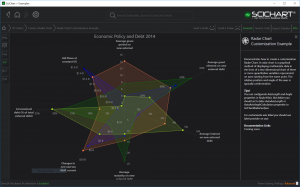
- New Radar Chart type. This 2D Chart will be added to SciChart WPF to allow displaying radars with customisable axes and selectable series or data-points. This chart type has been built from the ground up using our fast 2D drawing technology and looks great!
![scichart-2017-roadmap-radar-chart]()
SciChart WPF Radar Chart
- DirectX11 support for 2D Charts. No longer will our DirectX plugin use DirectX10, and no longer will it depend on D3DX9_43.dll/D3DX10_43.dll or outdated Microsoft technologies. It will use the latest DirectX11 and require no external dependencies (other than SharpDX), with automatic fallback to software rendering where DirectX is not available.
- Slipstreamed Visual C++ Runtime in the SciChart3D Library. No longer will end-users have to install the Visual C++ 2013 runtime to use SciChart 3D. This will be embedded in our charts.
- We are hoping to add (still working on) nulls or custom cell colouring in 3D Surface Meshs as well as a number of other improvements in the API and charts of SciChart WPF before the version 5 release.
SciChart iOS & Android v2.0 (Q1 2017)
Also expected in the next few months are version 2.0 of our iOS & Android (mobile) Charts. We have done a considerable amount of work to unify the two platforms, resolve differences in API and improve capabilities. The next version of SciChart iOS/Android will include:
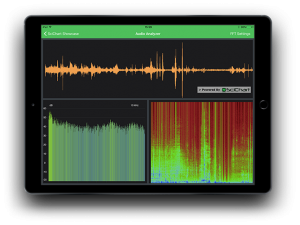
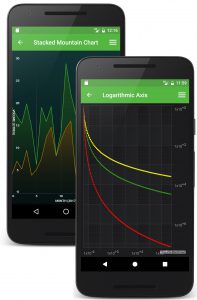
![Something]()
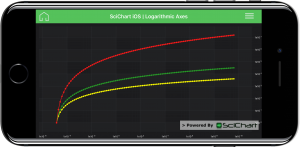
New Themes, Logarithmic Axis
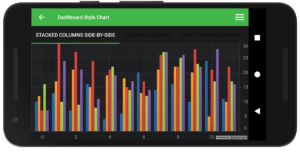
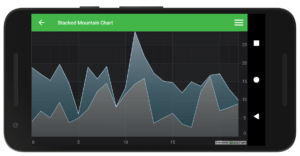
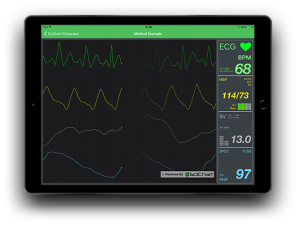
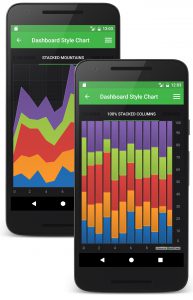
![Something]()
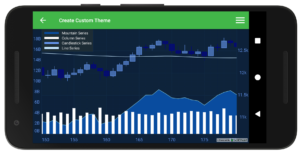
Stacked Column, Mountain Charts
- Stacked Mountain series
- Stacked Column Series
- Stacked Mountain (100%) Series
- Stacked Column (100%) Series
- Logarithmic Axis on both iOS+Android Platforms
- Gradient Lines on both iOS+Android Platforms
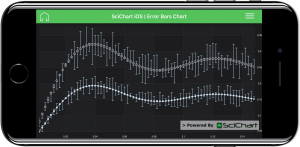
- Error Bars on both iOS+Android platforms
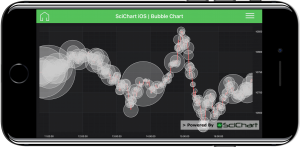
- Bubble Charts on both iOS+Android platforms
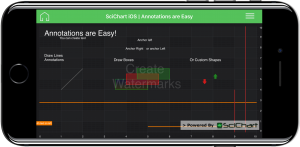
- CustomAnnotation on both iOS+Android platforms
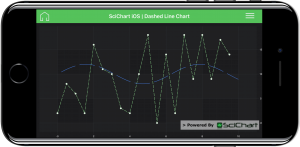
- Dashed Lines on both iOS+Android platforms
- Vertical/HorizontalLineAnnotation on both iOS+Android Platforms
- Inertial Scroll on both platforms.
- ThemeManager support and custom themes on both platforms.
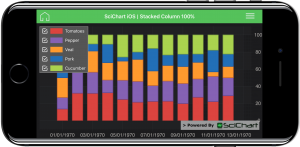
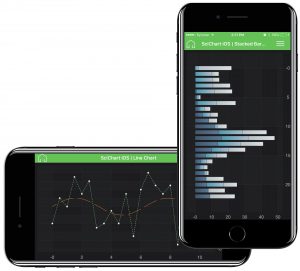
![SciChart iOS Dashed Lines, Stacked Column Charts]()
SciChart iOS Dashed Lines, Stacked Column Charts
- Unified API. SCIFastLineRenderableSeries API on iOS will equal com.scichart.FastLineRenderableSeries on Android etc..
- A set of tutorials to get started on both platforms!
- SciChart Xamarin Chart Binding Libraries. These are already published as Alpha and are being worked on as we speak.
- We are researching NativeScript bindings to allow you to use SciChart iOS & Android in this exciting hybrid platform.
We intend to release SciChart iOS & Android v2.0 soon (end Q1 2017), although, Xamarin is really hard. I mean, creating a binding library for our charts has taken nearly half a year, as we fought through several Xamarin bugs, and we weren’t expecting that. Fortunately once the library is created, making applications with the Xamarin components should be easy ![🙂]()
Pricing of SciChart WPF v5, iOS & Android v2
We do not anticipate any pricing changes after the release of SciChart WPF v5 and SciChart iOS/Android/Xamarin v2. The prices that we have listed at the SciChart Store will most likely persist beyond release date.
Also, anyone who has a valid support subscription at the time that these new version(s) are released will be upgraded for free to the latest version. That is, WPF customers in-subscription will be able to access SciChart WPF v5, and iOS or Android customers in subscription will also be able to access SciChart iOS, Android 2.0 with Xamarin support for free.
Releases/Events Happening in the Future
So what about the future? What are we going to do after these releases are out the door?
Expanding Consultancy Offerings (Q1-Q4 2017)
Currently, SciChart gains almost 100% of its revenue through licensing sales. This is pretty incredible since most similar-sized component vendors get a significant amount of sales through consultancy work. We don’t really do much consultancy work, but there is no reason why we cannot.
This year (2017) is a year where we plan to expand our consultancy offerrings, with published rates for time & materials work, and we will aim to take on a small number of projects on a contingent basis. If you have an idea for a project, or need our expertise, get in touch, as availability is expected to fill up fast.
3D Charts on Xamarin, iOS & Android Platforms (Q4 2017)
Our WPF 3D Charts are predominantly written in C++, with a cross platform DirectX, OpenGL, OpenGLES Rendering engine. That means we can potentially bring these into iOS, Android and Xamarin charts quickly, sharing the core code from our WPF charts. This is something on our roadmap for the latter part of 2017.
![SciChart 3D can be ported to iOS, Android and Xamarin using our Cross Platform C++ 3D Engine]()
SciChart 3D can be ported to iOS, Android and Xamarin using our Cross Platform C++ 3D Engine
Continuing Innovation on SciChart WPF (Throughout 2017)
Throughout 2017 we will continue to innovate on SciChart WPF, adding both 2D and 3D chart types, performance improvements, API improvements and more.
SciChart UWP or WinForms – Available on Request
We are considering to expand our WPF offering to make a UWP version of SciChart, or a maybe a WinForms version. If we do this, it will be included for free in ‘SciChart WPF’ which will become ‘SciChart Windows Edition’.
Microsoft seems to be investing a lot in the UWP Platform: Check out the #WindowsDevDay Hashtag on Twitter which heavily features UWP. Although this only runs on Windows 10 and up, it also allows XAML-based applications to run on XBox, Hololens, and a slew of future devices such as Windows 10 on ARM. Although the platform has seen a slow start, it seems to be the direction that Microsoft is taking XAML development. UWP also ties in nicely with our Xamarin charts which are in Alpha now.
Also, quite a few of our customers use SciChart in a WinForms app using the Microsoft ElementHost control. This works fine, however, for developers without WPF knowledge it can be bit of a learning curve to understand MVVM, bindings and so on. SciChart can be used without MVVM, or bindings, but the API would feel a lot more natural to WinForms users if it were a WinForms control. It might also help us to debug and develop code which uses DirectX, as the PIX Debugger cannot be attached to WPF processes.
So we want to hear from you. Do you want to see a UWP version of SciChart? Or a WinForms version? Would that influence your current or future buying decisions? If so, contact us and let us know.
The UWP platform has been discussed a lot internally. It’s not easy to write for actually. Some of the APIs in WPF are just not present in UWP however, if this becomes an area where people are seriously considering to invest then we should support it. Again, will it influence your buying decision?
Project ‘Spaceship’: Platform unification through code-reuse (2017 and Beyond)
At SciChart, our mission statement is moulding into becoming the Market Leader in cross-platform 2D & 3D native charts. Why native? Well, we believe speed and performance are paramount. We tested some of our critical data-transformation algorithms in Javascript and they lost 90-95% performance when compared to native code. That’s 90%+ of your CPU wasted due to Javascript. Even on the V8 Chrome engine which is supposed to be fast. So, yes, HTML5/Javascript is probably the future for many line of business apps, but it just cannot compete with the speed offered by native code. You can only get maximum performance when you write native code (that is, not interpreted or scripted languages). There is a significant market for native chart components where speed & power cannot be compromised.
So we have a plan for this. We call it project ‘Spaceship’ – like Benny from the lego movie man that really wanted to build a spaceship. It was the most awesome spaceship and he’d been dying to make it all through the movie ![🙂]() That’s kind of what we want to do with SciChart. We have already laid the groundwork.
That’s kind of what we want to do with SciChart. We have already laid the groundwork.
![scichart-2016-annual-report-path-to-xamarin]()
SciChart: Project Spaceship! Cross Platform, High Performance, Native 2D & 3D Charts with a common C++ core
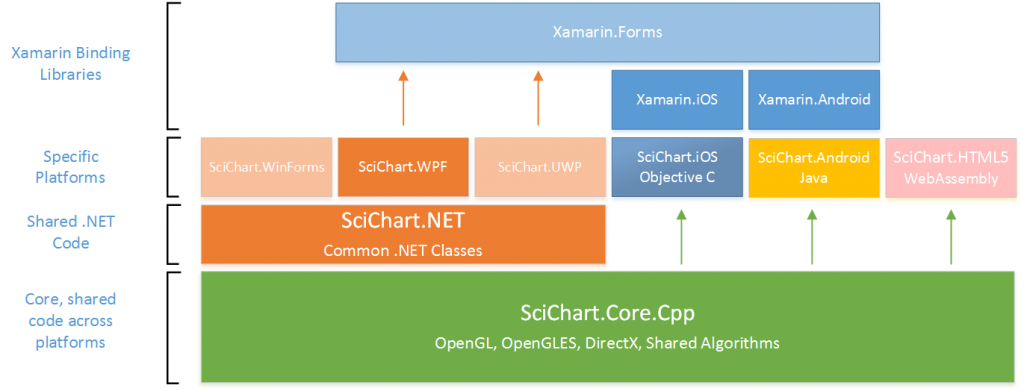
- We have a common C++ core for 3D Charts. This is a rendering engine which is cross-platform compatible and the core SciChart3D classes which are written in C++. We are working now to expand this to include core algorithms such as data-transformation, DirectX hardware accelerated drawing and data resampling used in 2D Charts.
- We already have WPF charts, but what if we were to split these into a .NET layer, then write thin layers on top for WPF, UWP and possibly WinForms (if requested)?
- We already have an iOS and Android chart component, as well as Xamarin.iOS and Xamarin.Android binding libraries in the works (to be released end Q1 2017). These could potentially share the common C++ core to allow us to introduce 3D Charts to iOS, Android and Xamarin by end 2017 as well as share code across all three platforms.
- Speed. C++ is very fast. We have actually prototyped a layer which does our WPF core rendering and data-transformation algorithms in C++ with SIMD/Vectorization. While this is not ready for production, the initial results were very promising, giving an overall speed increase of 3-3.5x in our WPF Charts.
- More importantly code-reuse. Writing code three or four times in different languages is very costly and error prone. C++ is the original cross-platform language! It compiles onto pretty much everything if you write it correctly. It might even work on Web, if WebAssembly ever becomes standard.
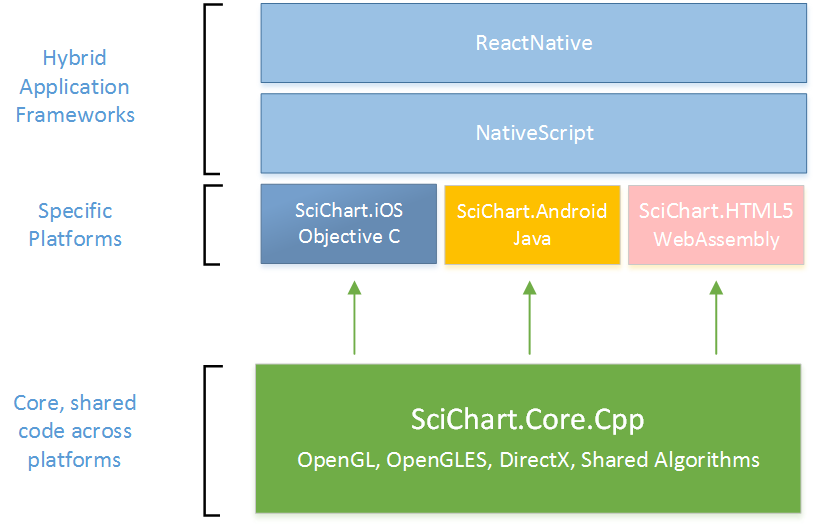
The above lays a path to complete coverage of Rich, Interactive Charting across Windows, as well as iOS & Android mobile platforms natively, as well as with Xamarin. We are also currently investigating writing NativeScript and ReactNative examples to see if we can use our iOS & Android charts in these exiting new hybrid frameworks.
![scichart-2016-annual-report-path-to-nativescript]()
SciChart: iOS & Android Realtime Charts in NativeScript & ReactNative?
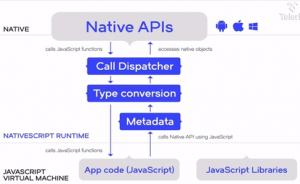
If you don’t know what NativeScript is, take a look…
T![nativescript]() his and ReactNative are ingenious frameworks which allow you to write code in HTML5/Javascript or TypeScript which compiles down to native code, meaning speed, performance, on mobile and web platforms, in a very popular language set. You can consume native iOS and Android libraries in both NativeScript and ReactNative. We are working on a prototype now to see if it is possible to use SciChart iOS/Android with NativeScript – allowing Realtime, High Performance NativeScript Charts. If so, we plan to publish examples of how to use our iOS & Android charts with NativeScript soon after the SciChart iOS & Android v2.0 release.
his and ReactNative are ingenious frameworks which allow you to write code in HTML5/Javascript or TypeScript which compiles down to native code, meaning speed, performance, on mobile and web platforms, in a very popular language set. You can consume native iOS and Android libraries in both NativeScript and ReactNative. We are working on a prototype now to see if it is possible to use SciChart iOS/Android with NativeScript – allowing Realtime, High Performance NativeScript Charts. If so, we plan to publish examples of how to use our iOS & Android charts with NativeScript soon after the SciChart iOS & Android v2.0 release.
Our Mission Statement
The Best WPF Charts -> The Best Cross Platform Charts?
SciChart is the unofficial ‘Worlds Best WPF Chart’ and we receive excellent reviews and testimonials from our customers for flexibility, speed, power, easy of use as well as for our helpfulness on tech support and willingness to help you get the job done. We are so pleased to be able to serve you and you our customers make this possible.
What we want to do is to expand our offerings into many platforms so as to future proof ourselves, and also give some of you a path to upgrade. We know that some companies are considering other platforms and are moving away from WPF. However, the vast majority of business users are staying on the Windows and .NET ecosystem, leveraging the expertise they have in house from existing, established C# .NET teams. As a result, we continue to bet on Microsoft while expanding into mobile and possibly web platforms in the coming years.
Your Feedback Welcome!
We’d love to hear your feedback on our plans. Tell us how we are doing. Whether good or bad, we want to hear it.
We’re aware of some areas that we are doing really well, and some not so well. We are working hard to improve our working processes and get better at delivering while growing, as well as maintaining the quality you have come to expect from us.
Your feedback welcome, contact us anytime!
Best regards,
Andrew
Managing Director,
SciChart
The post SciChart 2017: The Vision & Roadmap appeared first on WPF Charts, iOS and Android Charts | SciChart.


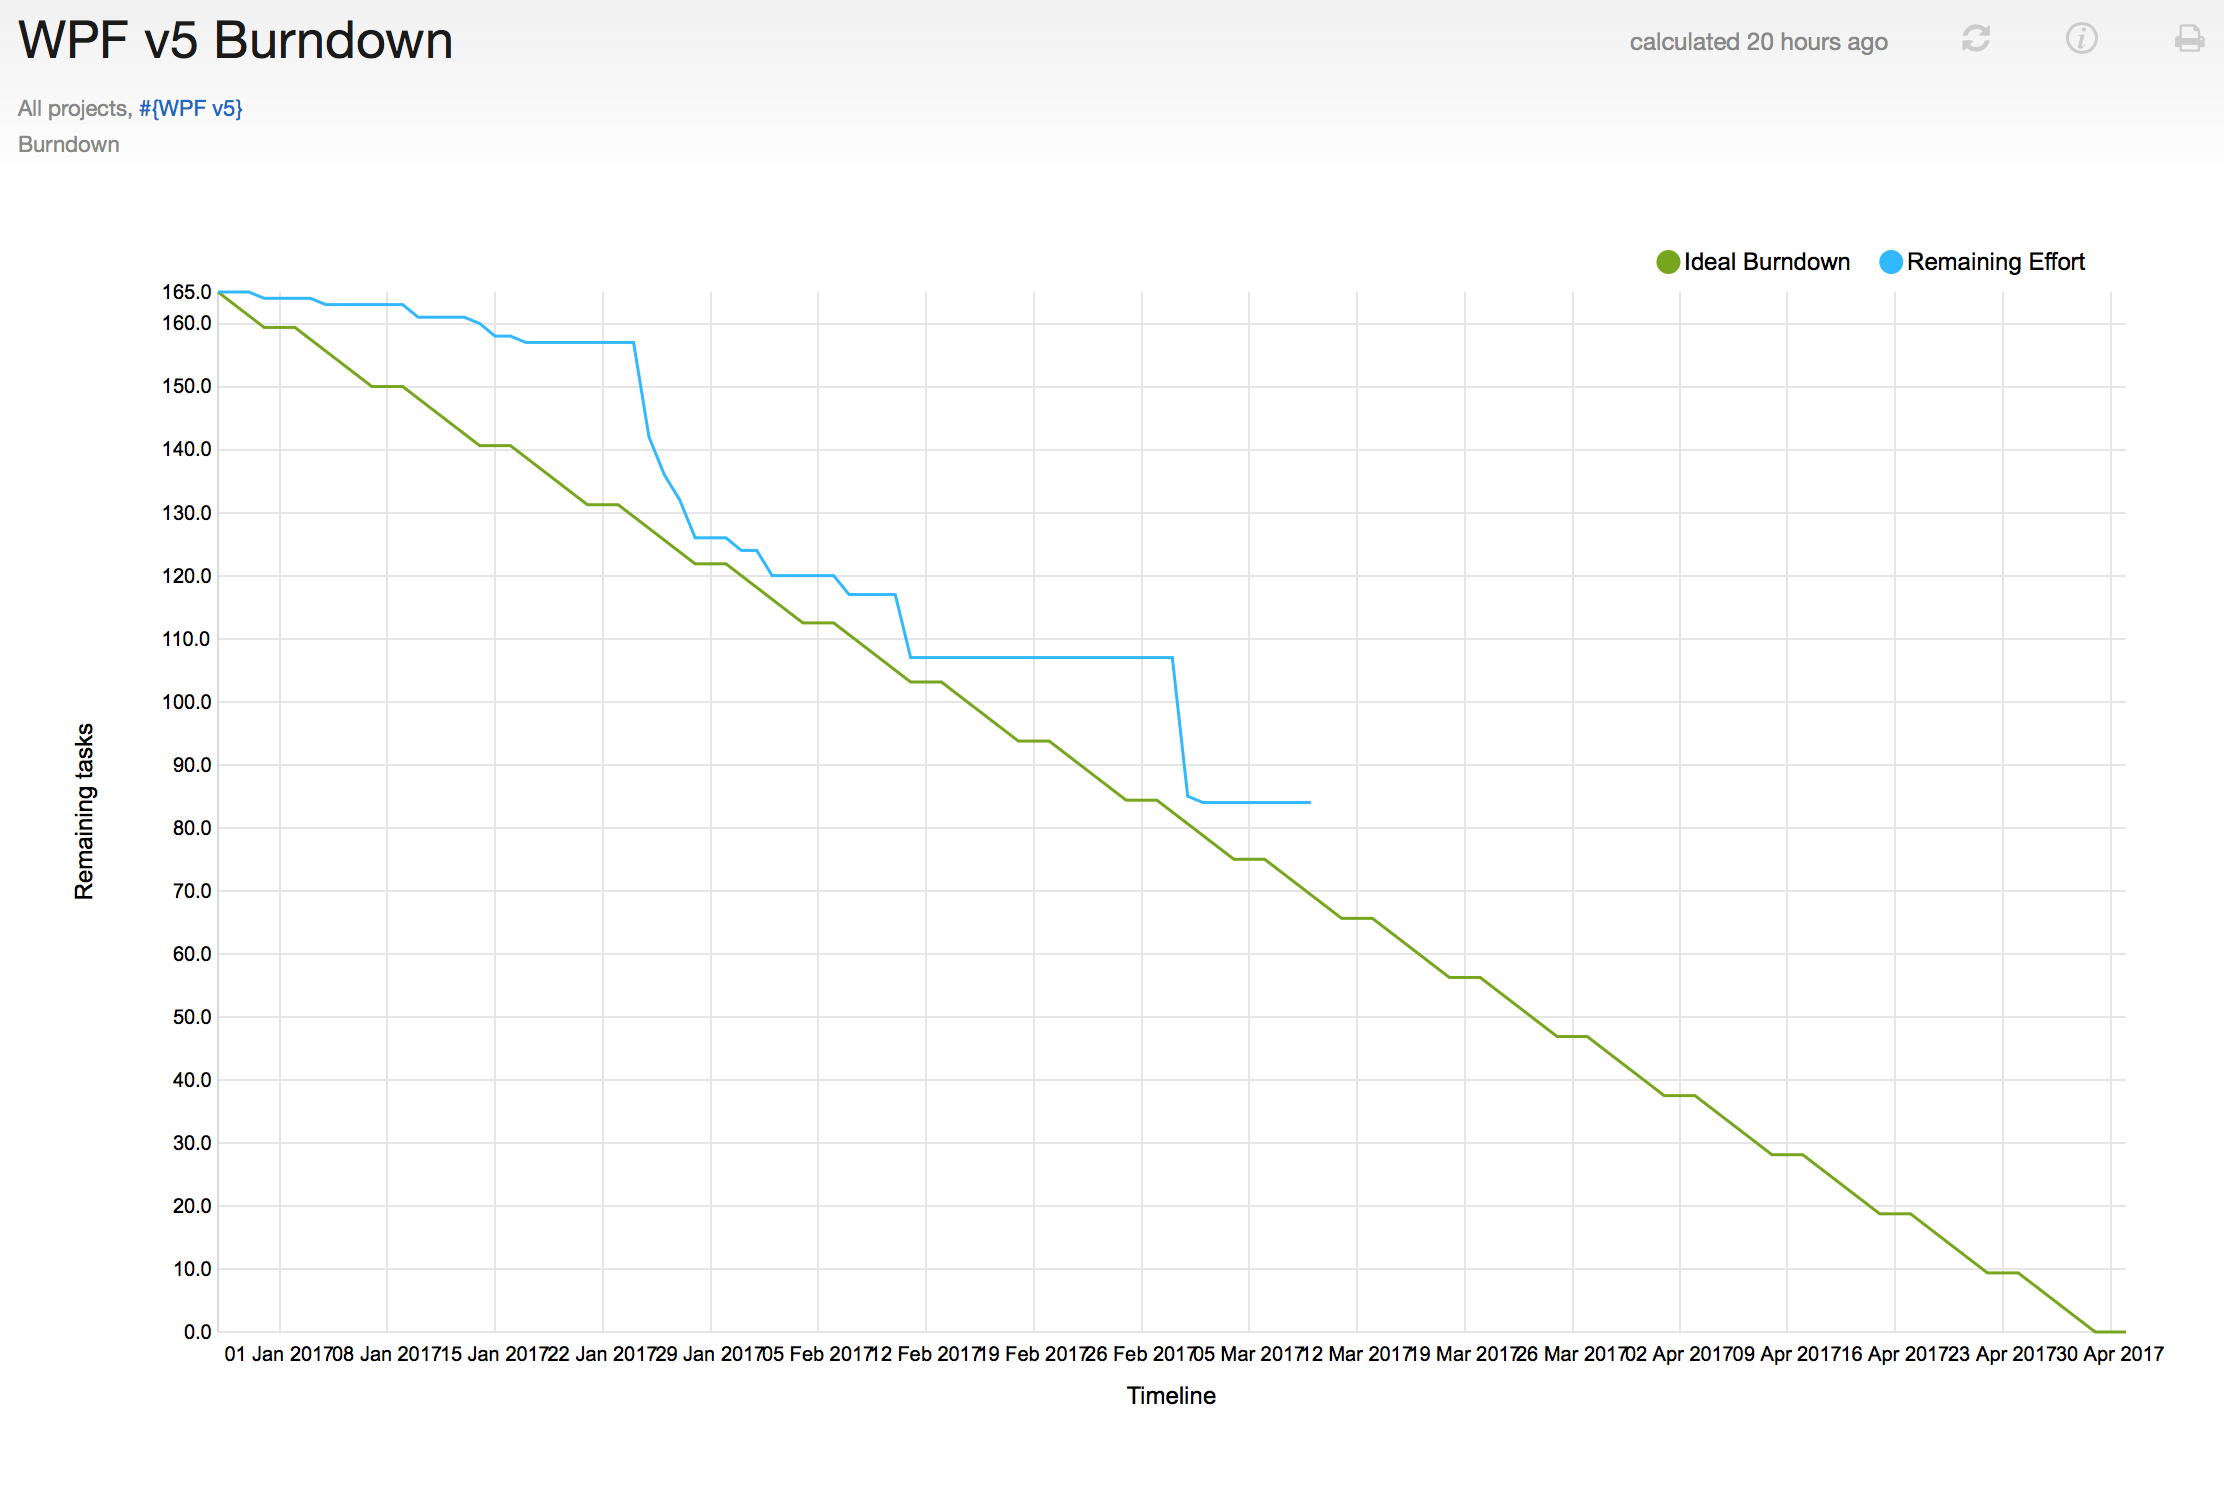 WPF v5 Burndown Chart as of March 2016. Expected delivery in May 2016
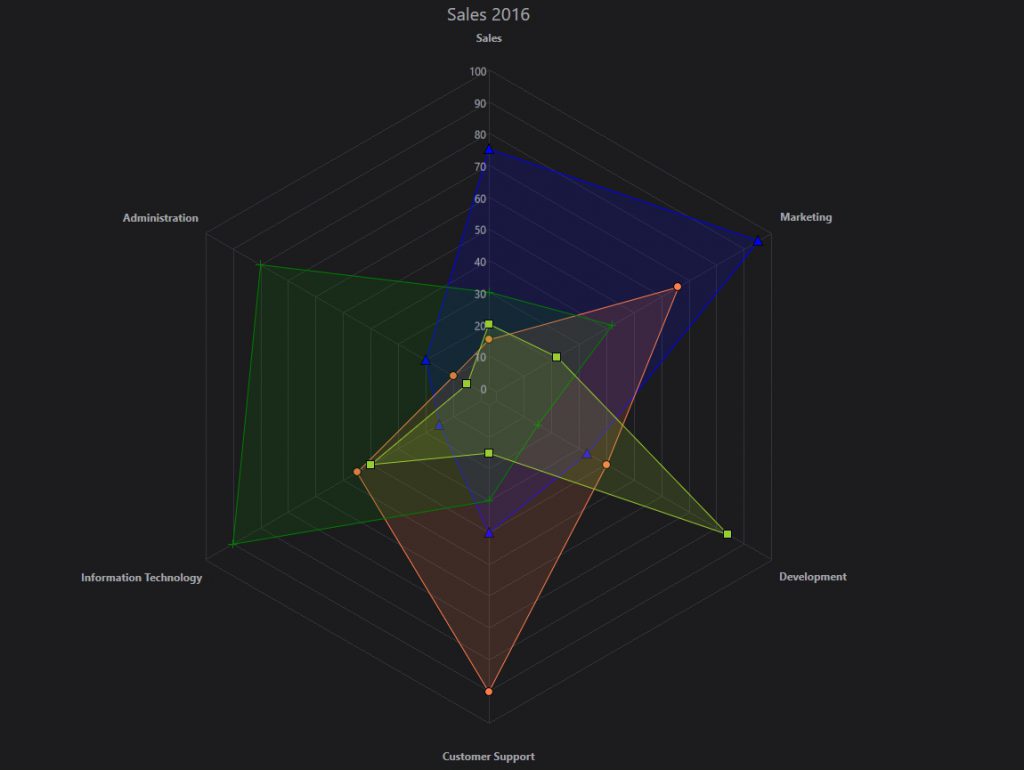
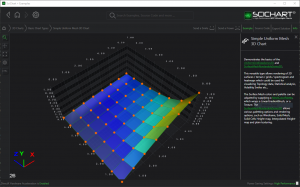
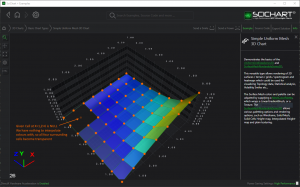
 The Uniform heat map type has been heavily optimised, now yielding up to 10x faster rendering when compared to v4.x FastHeatmapRenderableSeries
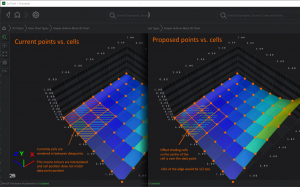
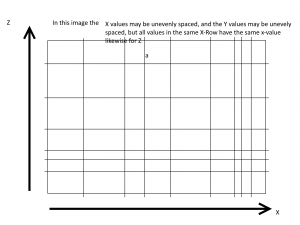
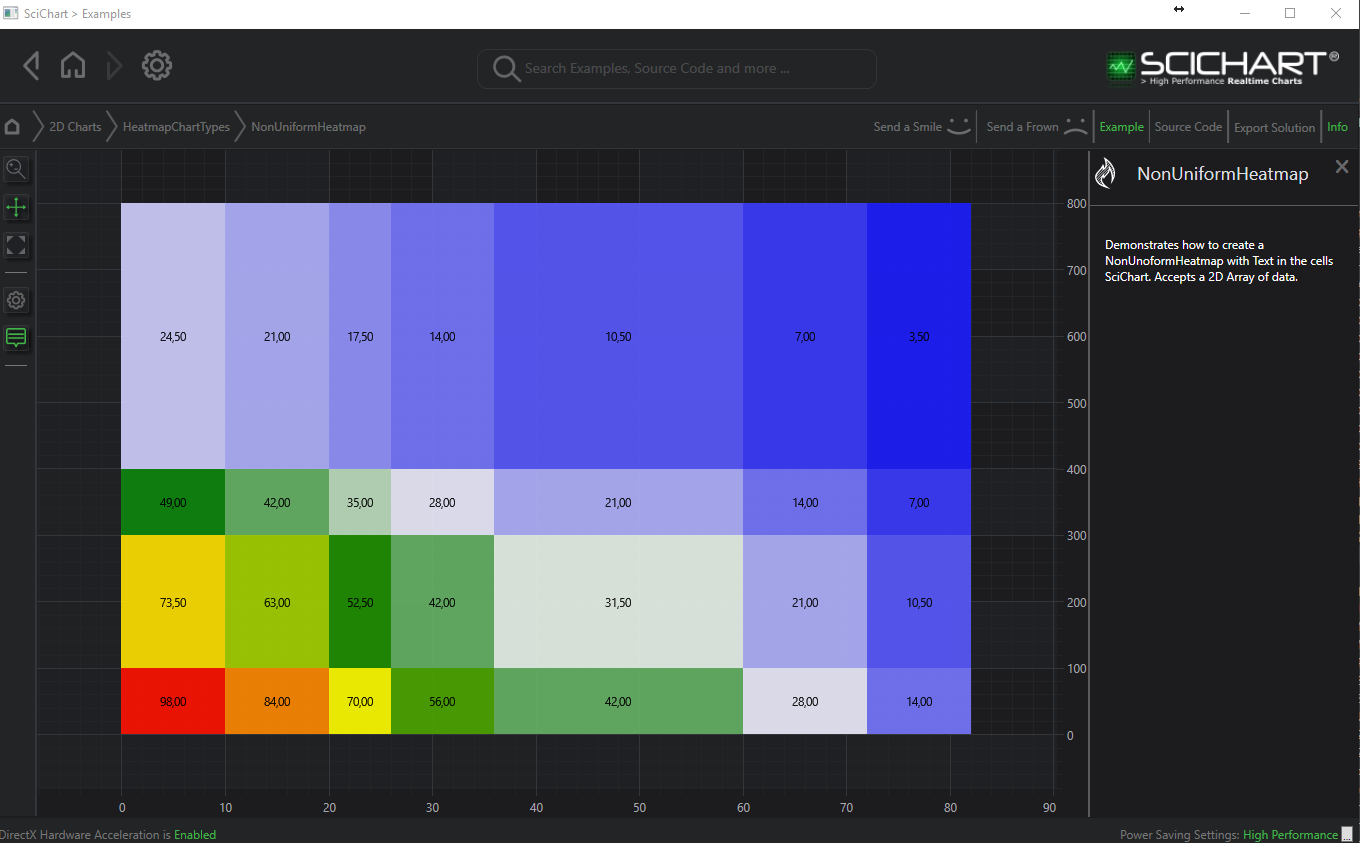 The new Non-Uniform Heatmap in SciChart WPF v5 fixes several issues that were present in the Heatmap from v4
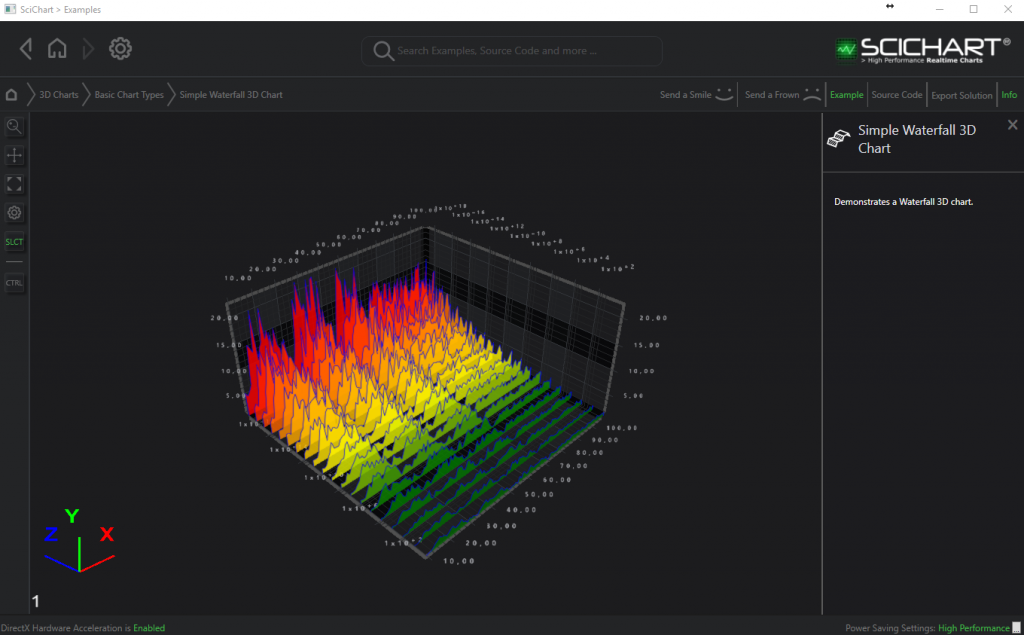 The new WPF Waterfall 3D Chart Type allows rendering of mountain slices at discrete intervals in 3D. Also supports realtime updates!