Quantcast
Channel: SciChart
Viewing all 302 articles
Browse latest View live

Case Study: Real-time Android Charts for Medical Industry

$
0
0

About a year and a half ago, IMT AG (Information Management Technology) approached us to ask about porting SciChart Realtime Charts on the Android operating system. At the time we only supported Windows Presentation Foundation, but thanks to their encouragement, and their sponsorship by committing to pre-order SciChart Android licenses for their team, we were able to embark on the port, and have now released SciChart’s Android Chart with record real-time performance.

mguntli

Michael Guntli from IMT AG at Droidcon Berlin

Over the past year or so, IMT have worked alongside us providing valuable feedback as we developed the worlds fastest real-time Android Chart Control, which uses a mixture of Java, C++ with the Android NDK and OpenGL ES2.0 to achieve record performance for an Android Chart. We were able to squeeze the most out of a low powered device by porting our already proven drawing and resampling algorithms from Windows to Android, and implementing them in this new chart control.

This year in June 2016, Michael Guntli from IMT AG presented at Droidcon Berlin to talk about their project. Michael’s presentation ANDROID INDUSTRIAL: REAL-TIME DATA VISUALISATION can now be viewed online and a full video can be seen below.

Antutu-Benchmark-imx6

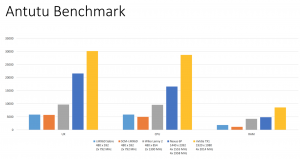
Benchmark of the Freescale iMX6 hardware. A fraction of the speed of high-end Android devices.

Michael and his team at IMT have built a prototype device for the medical industry running on a dual-core Freescale iMX-6 hardware which uses SciChart’s Android Chart library for the real-time charting. The Freescale iMX-6 is low power ARM processor (dual core, 800MHz) that has about half the computing power of the lowest of the low cost $50 Android Smart phone, and a fraction of the speed of a high-end Nexus smartphone, yet thanks to the engineering of the IMT team and the performance of SciChart for Android, it still runs data-acquisition, processing, UI updates and of course realtime charts at a smooth 30 FPS.

The presentation content is very valuable from an engineers perspective as it goes into great detail about how to develop a truly real-time medical or industrial software with Android as an embedded operating system while running on low power ARM hardware. Some of the challenges faced by IMT are the same as our own: garbage collection, performance of the Java runtime and Android views have all required some inventive workarounds.

SciChartApp-NoProductName

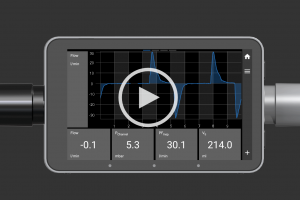
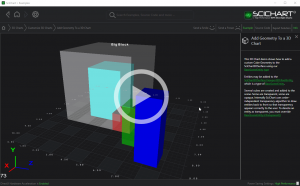
View the IMT Prototype UI running SciChart Android Charts on a Freescale iMX6

Such an application demonstrates the ability of SciChart’s Android Chart component in Industrial and Medical usage where the Android operating system is used in a low-power embedded system. It also shows the amazing performance of SciChart’s Android Chart! If we can draw smooth charts on hardware that is low power, with a low CPU clock speed, then imagine what it can do on the latest smartphones or tablets!

The full presentation slides are available online, as well as a youtube video of the presentation below. There’s a little bit about SciChart at the end, and we really appreciate Michael taking the time to promote us in this way. We hope their project is a great success and we look forward to continuing to work with IMT in the future.


The post Case Study: Real-time Android Charts for Medical Industry appeared first on WPF Charts, iOS and Android Charts | SciChart.


SciChart WPF Roadmap plus Features Survey / July 2016

$
0
0

Recently we have made the bold step to port the SciChart realtime WPF Charts software to iOS and Android. This is great news as it ensures the future growth of our company and mean we can continue to serve you, the customer.

Some of you may be thinking “Ok that’s great, but what about WPF?”. Well, WPF is still our number #1 core business (and will continue to be for a long time we think!). This means we need to keep innovating and delivering new chart types & features to our existing and future WPF Charts user-base.

For that we need your input which is why we’ve created a WPF Features Survey! We also have some info about our immediate roadmap which some of you may find useful to know. These are features that are already in progress and will be released later this year.

// SciChart WPF H2 2016 Roadmap

SciChart WPF v4.1

Release date: next 2 weeks

Features:

  • WPF Ternary Charts
  • CategoryNumericAxis type
  • Improvements to chart serialization and ExportToFile problems resolved
WPF Ternary Charts with Error Bars

WPF Ternary Charts with Error Bars

WPF Ternary Polygon Chart

WPF Ternary Polygon Chart

WPF Ternary Scatter Chart with Cursors

WPF Ternary Scatter Chart with Cursors

SciChart WPF v4.2

Release date: next 3 months

  • DiscontinuousDateTimeAxis for enhanced trading systems
  • Performance enhancements for SciChart WPF 2D Charts
  • Possible re-write of SciChart.DirectX to update to DirectX11 (solves problems running DirectX10 on some hardware)
  • Possible Radar or Pie or Smith Chart (see survey)

// The SciChart WPF Features Survey

Over the past year we have delivered to you, the user, loads of new enhancements and features. But the question is, what do you want next? What is most valuable to you?

Please take a moment to answer our survey and when answering, please consider what features are most valuable to you in your current and future planned projects.

Create your own user feedback survey

Finally, comments below are welcome, as is direct contact.

Best regards,
[SciChart Team]

The post SciChart WPF Roadmap plus Features Survey / July 2016 appeared first on WPF Charts, iOS and Android Charts | SciChart.

Response to SciChart WPF Survey July 2016

$
0
0

So a week ago we announced our H2 2016 Roadmap for SciChart WPF and also a survey on what features you would like next. The response has been really positive! Lots of people giving feedback and giving us some good direction for the next half of the year.

The feedback was totally anonymous so we can’t actually reply to any of your comments, so we’re posting some responses below. If you want to get in contact with us to discuss any of these further, please do! The more dialogue we have between you, the customer, and ourselves, the better.

Q: What Chart Types to build next?

Almost everyone wants a Pie Chart. Really? OK then! These are actually really simple to build, so much so you could actually do it yourself, but we’ve avoided it until now so we can focus on the specialist area of high performance scientific charts. However, since its a quick job we’ll try to fit it into the next iteration.

We also have some good feedback about what specialist scientific charts you would like to build, so thank you for that.

Q: Which platforms do you want?

We have some great feedback on what platforms you would like us to port to. However, with so many platforms to choose from, and the cost of one platform port being high (you are looking at 3-4 developers for a year for one platform), we have to be careful which to choose.

For instance, we have recently ported to iOS/Android so Xamarin makes perfect sense. In fact, Xamarin is a case of simply adding a binding wrapper around our existing iOS/Android controls so the two go hand in hand. It’s likely we will look at this soon.

However, porting to HTML5 is a complete re-write. HTML5 we can see a big (yet crowded) market, however you’re aware that we’re not going to achieve the same performance as in WPF right? Javascript by its very nature loses 90% of the speed of the CPU and there are no nice workarounds to use C++ or to write your own drawing algorithms!

Q: Platform port Sponsorship

If you were one of the people that said you wanted to sponsor a platform port, please get in contact. We have the ability to scale our team quite rapidly and if we have some certainty of income it means we can hire a dedicated team and get to work.

Q: Optimised Algorithms for Descending Charts

Two people asked in the comments for us to optimise the algorithms for descending charts. As you know, SciChart excels in performance when the X-data is sorted ascending as this allows us to use a host of optimised algorithms for indexing, resampling and drawing. But what about sorted descending? SciChart treats this as ‘unsorted’ and drops down to a slower drawing path.

However, did you know that there is an optimisation in SciChart already to handle this case?

Simply append your data to the DataSeries sorted ascending in X, and use XAxis.FlipCoordinates = true. This will render your data as descending while leveraging the full power of SciChart’s accelerated drawing.

If you have a comment about this, please use the comment box below or contact us.

Q: Exporting to a vector based graphics format

One person requested SciChart WPF to export to vector for seamless inclusion into HTML5 or PDF documents. However, are you aware that SciChart already supports export to vector graphics? You can see a demo in our Export to File Options example.

SciChart supports export to PNG, Bitmap, Jpeg and now XPS (vector) for high-quality, scalable output. The XPS output is available in the SciChart WPF 2D Enterprise and SciChart WPF SDK Editions only.

Q: DateTime axis synchronisation within SciChartGroup. At the moment we need to add Double.NaN points in order to achieve this.

We are working on a new Axis type called a DiscontinuousDateTimeAxis. This is a value axis like DateTimeAxis which allows you to exclude certain times, e.g. after market hours, weekends. However, its behaviour is like a DateTimeAxis so it obeys Date value for positioning of points.

This should solve the above problem, however, the performance of DiscontinuousDateTimeAxis will not be as good as CategoryDateTimeAxis. This is because of the higher number of calculations required to allow this type of axis transformation.

We hope to have this axis type ready later this year.

Q: Better possibility to extend existing charts with custom series.

..Example: in a ohlc or line charts we want to visualize our market activity, eg plot our orders as horizontal lines

We do actually have a CustomRenderableSeries type which allows you to draw virtually anything. Can this help? There are some good tutorials in our documentation plus an example in our Examples Suite.

Q: I think some bugs are long overdue.

If you want these fixed, you should really tell us what they are 😉

Maybe you have in the past, but we get so many requests for enhancements or fixes that its worth telling us again to remind us of the importance to you.

Q: I think SciChart could benefit from having an out-of-the-box histogram

… instead of having to do work-arounds to make it work. I could provide examples of things we’re doing that would add value to this new histogram series.

Yes please do! Our business-knowledge of statistics will not be as good as yours. We are the chart drawers, you are the chart users. If you want to supply us with any examples or code that we can build upon in any business area, please do!

Q: Proper MVVM Tutorial

One person requested a full MVVM tutorial. It’s difficult for us as we have to show people how to setup a chart in code (fully code), or in MVVM, or in a hybridised sort of MVVM depending on what their level of experience/comfort is with the MVVM pattern.

But I guess we could do a full reference implementation of dynamic everything (series, points, axis, modifiers, styling) with MVVM. It’s a lot of work for us though, hence why we haven’t done it until now.

Q: Include Examples in Source Code Repository

Good idea! We can do this quite simply. I will log a task on the board!

The post Response to SciChart WPF Survey July 2016 appeared first on WPF Charts, iOS and Android Charts | SciChart.

SciChart iOS v1.1.0 Build 619 Released

$
0
0

We are pleased to announce that SciChart iOS SDK v1.1.0 has now been released! Please see below for the list of improvements / features added and bugs fixed.

If you are using SciChart iOS v1.x then this update is a drop-in replacement.

What’s New in SciChart iOS v1.1.0?

New Features

  • Added SCIAxisBase.setAxisTitle(NSString) to set string axis titles (Multiple Axis Example)
  • Added SCIAxisCore.setTitleCustomView(UIView) to set custom axis view (Multiple Axis Example)
  • Added SCIAxisCore.registerVisibleRangeChangedCallback to allow registering / subscribing to VisibleRange changed (Multiple Surface Example)
  • Added CategoryDateTimeAxis type, for financial charts (allows closing of weekend / overnight gaps on the XAxis)
  • Added SCIAxisRangeSynchronization type for synchronising ranges of two charts (Multiple Surface Example)
  • Added SCIAxisAreaSynchronization type for synchronising YAxis sizes when two charts placed one above another (Multiple Surface Example)
  • Added AxisMarkerAnnotation type (Multi Pane iOS Stock Charts Example)
  • Added new Multi Pane iOS Stock Charts demo  (Multi Pane iOS Stock Charts Example)
  • Added new Realtime Ticking iOS Stock Charts demo (Realtime Ticking iOS Stock Charts Example)
  • SciChart iOS Getting Started Guide is now online. Appledoc for class hierarchy coming soon.

Improved

  • Fixed Scatter Series crash when NaN’s in data series.
  • Fixed Scatter Series does not draw when a single data-point in data series.
  • SCIRolloverModifier now has option UseInterpolation, which now allows interpolation between data-points to be switched OFF or on.
  • Licensing warning messages in a clearer position.

Where to get SciChart Downloads?

You can get the SciChart iOS SDK v1.1 from the Downloads page. Source code customers can also get-latest from our Github repository.

GET SCICHART IOS v1.1.0

Best regards,


The post SciChart iOS v1.1.0 Build 619 Released appeared first on WPF Charts, iOS and Android Charts | SciChart.

SciChart Android v1.1.0 Build 1245 Released!

$
0
0

We are pleased to announce that SciChart Android SDK v1.1.0 has now been released! Please see below for the list of improvements / features added and bugs fixed.

If you are using SciChart Android v1.x then this update is a drop-in replacement.

What’s New in SciChart Android v1.1.0?

New Features

  • Added new example: Realtime Ticking Android Stock Charts
  • Added new example: Multi Pane Android Stock Charts
  • Added feature to synchronise YAxis sizes when multiple charts placed one above each other (see Synchronise Multiple Chart example)
  • Added feature to synchronise ranges and events of multiple charts (see Multi Pane Android Stock Charts demo)
  • Added HorizontalLineAnnotation / VerticalLineAnnotation
  • SciChart Android no longer requires a Trial License to be compiled into the examples app when downloading. The 30-day trial works out of the box!
  • SciChart Android Getting Started Guide and Package Hierarchy is now online. Full documentation coming soon.

Improved

  • Fixed PinchZoomModifier doesn’t work with CategoryDateTimeAxis
  • Fixed AxisMarkerAnnotation has wrong background
  • Fixed several bugs with CategoryDateTimeAxis
  • Fixed Legend checkboxes don’t respond in a realtime example

Where to get SciChart Downloads?

You can get the SciChart Android SDK v1.1 from the Downloads page. Source code customers can also get-latest from our Github repository.

GET SCICHART ANDROID v1.1.0

Best regards,
[SciChart Team]

The post SciChart Android v1.1.0 Build 1245 Released! appeared first on WPF Charts, iOS and Android Charts | SciChart.

SciChart WPF v4.1.0 Build 8612 Released

$
0
0

We are pleased to announce a Minor Update to the SciChart WPF SDK v4.

This release adds new features requested plus fixes some critical bugs which have been reported by our users over the past few weeks.

If you are using SciChart v4.x then this update is backwards compatible and is a drop-in replacement. If you are still using SciChart v3.6.1 we invite you to take a look at SciChart v4 and our migration guide. We’ve made it easier than ever to jump to the latest major version!  

What’s New in v4.1.0.8612?

New Features

  • WPF Ternary Chart support. SciChart WPF SDK Now supports
  • WPF CategoryNumericAxis support.
  • Complete overhaul to the Serialization mechanism and SciChartSurface.ExportToFile() functionality used for printing to Png, Jpeg, Bitmap and XPS. This resolves a number of issues reported by users related to ExportToFile.
  • BaseRenderableSerieViewModel derived types now marked as Serializable.
  • Ability to turn off scatter chart BasePointMarker clustering. This was causing performance problems in some cases, e.g. when you have hundreds or thousands of series with PointMarkers. To turn off clustering, please use the following code:
    // Turns off clustering on this pointmarker
    BasePointMarker.PointMarkerBatchStrategy = new DefaultPointMarkerBatchStrategy();
    
    // Turns on clustering on this pointmarker
    BasePointMarker.PointMarkerBatchStrategy = new ClusteredPointMarkerBatchStrategy();

Fixed

  • Fixes crashes in TimeSpanAxis.ZoomBy when zooming beyond the limits of TimeSpan.Min/Max
  • SC-3544 Fixed 2D and 3D interaction toolbars when examples modifier is not in the modifier group.
  • Changed default resamplingmode of FastBubbleRenderableSeries from Auto to None.
  • Fixes memory leak when swapping SciChartSurface.ChartModifier – old modifier was not unsubscribed from mouse events until window unloaded.
  • Fixed memory leak in RenderContextBase.DrawText. FontCacheKey / ISprite2D instnaces were not disposed. Moved the FontCache to RenderSurfaceBase and pass in to renderContext. When the RenderSurface is disposed (when SciChartSurface) is disposed, the cached fonts are also disposed. This should also improve performance of DrawText as fonts dont need to be recreated every frame
  • SC-3510 Set RenderableSeries for SelectedPointMarker in BaseRenderableSeries
  • Fix for memory leak in TooltipModifier derived classes where DelayActionHelper DispatcherTimer is started but never stopped
  • Fixes issue where instantiating a BaseSceneEntity or a BaseRenderableSeries3D before SciChart3DSurface causes a crash
  • SC-3502: fixed issue when annotations disappear after switching between tabs
  • Fixed NullReferenceException in SciChartScrollbar
  • Fixed issue in composite annotation when x and y AxisId’s on the child annotations do not update.
  • SC-3505: fixed issue when HeatMap ColorMap doesn’t respond to changes in the GradientStops collection
  • SC-3504 ZoomPanModifier marks MouseUp event as handled, cannot show ContextMenu on SciChartSurface and use ZoomPanModifier
  • SC-3503 SciChartSurface.MainGrid is not focusable, prevents Key Events in ChartModifiers from firing
  • Fixed TooltipModifier work on StackedMountains when UseInterpolation = false, and set UseInterpolation = true for TooltipModifier by default


Where to get SciChart Downloads?

The usual places: Installers from the Downloads page, Packages from NuGet and source-code via Github!

GET SCICHART v4.1.0

Best regards,
[SciChart Team]

The post SciChart WPF v4.1.0 Build 8612 Released appeared first on WPF Charts, iOS and Android Charts | SciChart.

SciChart Android v1.1.1 Build 1297 Released

$
0
0

We are pleased to announce that SciChart Android SDK v1.1.1 has now been released! Please see below for the list of improvements / features added and bugs fixed.

If you are using SciChart Android v1.x then this update is a drop-in replacement.

What’s New in SciChart Android v1.1.1?

  • Fixed MinimalZoomConstrain bug in DateAxis; added unit tests
  • Fixed Android Installer Zip: some example source code was not included as file paths were too long. This is now resolved and the examples now compile.
  • Improved the ShiftedAxes example – axes made more visible
  • Improved the CategoryLabelProvider API – now can convert from Dates directly.
  • Fixed incorrect rendering of axis when render surfaces changes – added invalidateElement() call which sets dirty flags which is required for correct rendering + test
  • Cosmetic changes to the CreateRealtimeTickingStockChart example’s code
  • Using Gradlew for Deploy.01.CreateAar.bat not Gradle. Solves build errors from our source code on some PCs.
  • Fixed crash of “Realtime Ticking Stock Charts” example – fragment was renamed in r1291 without changing of example definition
  • Fixed incorrect position of axes in ShiftedAxes example on startup – added custom layout manager which performs addition layout pass during first layout of chart;

Where to get SciChart Downloads?

You can get the SciChart Android SDK v1.1.1 from the Downloads page. Source code customers can also get-latest from our Github repository.

GET SCICHART ANDROID v1.1.1

Best regards,

The post SciChart Android v1.1.1 Build 1297 Released appeared first on WPF Charts, iOS and Android Charts | SciChart.

SciChart iOS v1.1.1 Build 654 Released

$
0
0

We are pleased to announce that SciChart iOS SDK v1.1.1 has now been released! Please see below for the list of improvements / features added and bugs fixed.

If you are using SciChart iOS v1.x then this update is a drop-in replacement.

What’s New in SciChart iOS v1.1.1?

  • Fixed SciChart.Framework now truly supports BitCode
  • Fixed Crash on iPhone 5s 9.3 simulator when using .Nan value with point markers
  • Fixed missing Point Markers in scatter charts in some circumstances
  • Fixed issues in the Multi Pane iOS Stock Chart demo
  • Added a BuildSciChartFramework.sh script to the Github release so you can build our sources easily

Where to get SciChart Downloads?

You can get the SciChart iOS SDK v1.1.1 from the Downloads page. Source code customers can also get-latest from our Github repository.

GET SCICHART IOS v1.1.1

Best regards,

The post SciChart iOS v1.1.1 Build 654 Released appeared first on WPF Charts, iOS and Android Charts | SciChart.


SciChart WPF v4.1.1 Build 8645 Released

$
0
0

We are pleased to announce a Minor Update to the SciChart WPF SDK v4.1.

This release adds new features requested plus fixes some critical bugs which have been reported by our users over the past few weeks.

If you are using SciChart v4.x then this update is backwards compatible and is a drop-in replacement. If you are still using SciChart v3.6.1 we invite you to take a look at SciChart v4 and our migration guide. We’ve made it easier than ever to jump to the latest major version!  

What’s New in v4.1.1.8645?

New Features (3D Charts)

  • Added new feature : rasterizer states. This now allows rendering with culled back faces.
  • Added support for immediate drawing of meshes with light. It is possible to work with lighting, although the new BeginLit needs to be used, and a normal should be set before drawing any face.

Fixed (2D Charts)

  • SC-3551 Fixes critical bug introduced in v4.1.0 where FIFO Series did not display properly, and non FIFO series resampled as MinMax always drew a line back to 0,0 at the end.
  • Fixed issue in LineAnnotation when it get NaN coordinates.
  • Fixes crash where Tab out or Lost Focus of SciChartScrollBar = exception.
  • Fixed serialization(exporting) of charts with Styles.
  • Fixed serialization\deserealization(exporting) of GridLinesPanelStyle.
  • Fixes serialization\deserealization(exporting) of VerticalSliceModifier (without tooltips for now).
  • Fixed alignment of wicks in Candlesticks.
  • Added IncludeSeriesProperty attached property to DataPointSelectionModifier. Default TRUE.
  • Reverted caching of DataSeries GetIndicesRange(). In some cases this causes instability.
  • Updated the Ternary Chart documentation.

Fixed (3D Charts)

  • Moved CustomPointMarker3D outside of SciChart.Charting3D.
  • The Point Cloud 3D example: added code to demonstrate how a custom texture can be used as a point marker.
  • The Point Cloud 3D example: now has a new option that shows a custom texture in usage. It creates a cross shaped texture.
  • Renamed the SciChartTexture enum for the template textures and meshes with word SciChartTextureTemplate to avoid confusion.
  • DefaultPointMarkers.cs now has a en example of how a custom texture can be used with point markers, what needs to be done is creating a Texture2D in the constructor, and retrning it in the getter, and adding a Dispose function.
  • Fixed bug where WorldDimensions change does not result in SC3D Mesh or Scatter or PointLine mesh change.
  • Fixed recreation of mesh EVERY frame (last WorldDimensions was not stored).
  • Fixed a bug in SurfaceMeshSceneEntity where surface mesh does not change size if SciChart3DSurface.WorldDimensions changes size.
  • Fixed PointsMesh, it was not setting a texture, there fore the example was always using rectangles and no triangles or circles.


Where to get SciChart Downloads?

The usual places: Installers from the Downloads page, Packages from NuGet and source-code via Github!

GET SCICHART v4.1.1

Best regards,
[SciChart Team]

The post SciChart WPF v4.1.1 Build 8645 Released appeared first on WPF Charts, iOS and Android Charts | SciChart.

Welcome back after the summer! Special discounts for WPF, iOS & Android in Sept 2016

$
0
0

// Welcome back!

… And just like that it’s September 2016. Where did the summer go? Or the year for that matter? It seems like time flies when you are having fun …

We hope that like us, you have had a wonderful break from work over the summer and are full of energy for the last four months of the year. So, welcome back to the office.

It’s time to get to work!

As a special welcome we would like to offer the following discounts off purchases in our store for new customers, or for existing customers purchasing additional licenses for their teams. You can find details about these below. Also a sneak into our immediate roadmaps at the bottom of the page.

Enjoy!

// 10% Discount off WPF Products in Store

As a special welcome back to work, we are offering 10% discount on all WPF Products in the SciChart Store from noon today until 30th Sept when you use the following discount code:

WPF-5T26R

This applies to new purchases and also additional license purchases if you are an existing customer of SciChart. It does not apply to renewals.

// 20% Discount off iOS/Android Products in Store

All iOS/Android products in the SciChart Store are discounted by 20% from noon today until 30th Sept when you use the following discount code:

PEVQHAER

This applies to new purchases and also additional license purchases if you are an existing customer of SciChart.

// How to apply a Discount Code

Simply enter the correct code above (e.g. for WPF or iOS/Android) when checking out on the last page before payment. Click ‘Update Coupon’. The system should reduce the price!

checkout-ios-android-discount

// Don’t forget!

All our licenses come with 1-year of support and updates, so if you do purchase SciChart licenses this September then you will be entitled to all the major & minor versions released in the coming year.

// What else are we cooking?

Releases planned in the near future include:

WPF (Release v4.2, due end Sept 2016)
  • Our hotly requested Pie Chart, Doughnut Chart support!
  • DiscontinousDateTimeAxis support
  • Improvements to SciChart 3D
iOS (Release v2.0, due end Sept 2016)
  • PaletteProvider (colouring bars or points or line segments individually)
  • Legend API support
  • Examples for customization of tooltip
  • Xamarin iOS bindings
Android (Release v2.0, due end Sept 2016)
  • Stacked Column / Mountain Series
  • Candlestick performance improvements (6x speedup for candlestick charts on Android)
  • Xamarin Android bindings

Future releases we can’t comment on (we need to keep our roadmap top-secret from prying eyes!) however we will say that we are working on improvements to all our platforms. Watch this space for future updates!


Best regards,
[SciChart Team]


The post Welcome back after the summer! Special discounts for WPF, iOS & Android in Sept 2016 appeared first on WPF Charts, iOS and Android Charts | SciChart.

Survey: .NET Framework 4.0, 4.5, 4.6 Support Versions

$
0
0

On the Microsoft site, they have announced earlier this year in fact that support has ended for the .NET Framework 4.0, 4.5 and 4.5.1 whilst continuing to develop .NET Framework 4.5.2 and 4.6.

Microsoft says their decision to end support for older versions of the .NET Framework will allow them to invest more resources towards improvements of the .NET Framework.

SciChart v4 currently supports .NET Framework v4.0, 4.5 and 4.6. We plan to keep supporting as wide a range of .NET Frameworks as long as possible.

Ideally however, we need to drop support for .NET 4.0. This is because some dependencies we use (such as SharpDX, used by SciChart.DirectX package) now only support .NET 4.5 and up. However, we would like to know from you if this will affect you negatively in order to decide when to do this.

Please take a moment to answer our survey below if you are using .NET 4.0 only for deployment, or plan to use .NET 4.5.2, .NET 4.6 for current or future projects.

Survey: .NET Framework Support Versions

Question: Are you currently supporting .NET 4.0 in your current & future applications? Are you planning to upgrade to .NET 4.5.2 or .NET 4.6?

Please take a moment to answer our survey below.

screen-shot-2016-09-14-at-08-07-19

TAKE THE SURVEY

Best regards,
[SciChart Team]


The post Survey: .NET Framework 4.0, 4.5, 4.6 Support Versions appeared first on WPF Charts, iOS and Android Charts | SciChart.

Licensing SciChart iOS or Android

$
0
0

If you have purchased a combined iOS and Android license, then your single license key will work on both platforms.

For iOS applications

For detailed instructions on where to find your key and how to use it in an iOS application, please see www.scichart.com/licensing-scichart-ios.

For Android applications

For detailed instructions on where to find your key and how to use it in an Android application, please see www.scichart.com/licensing-scichart-android.

The post Licensing SciChart iOS or Android appeared first on WPF Charts, iOS and Android Charts | SciChart.

Announcing new Pricing: iOS & Android Combined Licenses

$
0
0

It’s only been a few months since the SciChart iOS & Android High Performance Realtime Chart Launches and already we are iterating to bring you new features and improvements along the lines of compatibility performance & features!

New Cross-Platform Pricing

One improvement we’ve also just launched is new pricing for the iOS / Android chart products, as well as combined pricing for buying both SciChart iOS & Android:

  • SciChart iOS: $789 USD (was $899)
  • SciChart Android: $789 USD (was $899)
  • SciChart iOS + Android: $1249 USD (Was $1798, Save $549 USD!)
  • SciChart iOS + Android Source: $1749 USD (Was $2998, Save $1249 USD!)

SEE THE SCICHART STORE

scichart-ios-android-new-combined-pricing

Introductory Discounts

In case you didn’t see it, there is a further 20% discount on SciChart iOS & Android Charts available until 30th September 2016.

Hurry, because this offer ends soon!

Features & Work in the Pipeline

As well as combined pricing, which is great, what else are we doing to make our high performance Realtime iOS & Android Charts an attractive offering? Well, the team is right now working on the following. To be released shortly.

iOS: Built in 30-day Trial

No more downloading a trial key from the website to get started. Like Android, iOS will soon have a built in 30-day trial. This should allow you to get started more quickly.

Tutorials & Getting Started guides. 

We realise our tutorials & getting started guides are a little thin on the ground, so, we are working to improve these. Having just written an excellent series of tutorials for SciChart WPF Charts, we are porting these to our mobile platforms.

Xamarin Support

We’re a few weeks away from delivering Xamarin.iOS and Xamarin.Android support for our mobile platform charts. These will bring pre-packaged Binding libraries delivered as NuGet packages so you can include SciChart in your Xamarin Android and iOS projects. Watch our releases page for announcements, or company LinkedIn or Twitter for an announcement coming soon.

New Chart Types

To unify the three platforms (WPF, iOS, Android), a number of new chart types are being developed. These include:

  • Error Bars (missing on iOS)
  • Impulse / Stem Chart (missing on iOS)
  • Stacked Column Chart (iOS)
  • PaletteProvider API (iOS)
  • Legend API (iOS)
  • Bubble Chart (Android)
  • Stacked Mountain Chart (Android)
  • Stacked Column Chart (Android)

These are in development now and will be ready in the next few weeks.

Our Goal is Excellence, and Cross-Platform

We’re busy writing the common core of SciChart to be shared across platforms, and it is our goal to bring 2D + 3D Charts to WPF, iOS, Android, OSX and much much more. Bear with us as we go through this transition phase from one-trick-pony to something much much cooler.

Finally, if you have a feature request for any platform, or feedback for our team, then please get in contact. We would love to hear it.

Best regards,
[SciChart Team]


The post Announcing new Pricing: iOS & Android Combined Licenses appeared first on WPF Charts, iOS and Android Charts | SciChart.

Announcing No-Support Product Pricing Options

$
0
0

Today we’re excited to announce a new pricing option for our cross platform WPF, iOS & Android charts to complement our 1-year, 2-year, 3-year and lifetime priority support options.

This option is about 30% cheaper than supported options if you wish to purchase a license without technical support.

New No-Support Option: Save 30% on License Costs

As of today we have launched a new No-Support option to all our WPF, iOS & Android Chart control licenses (excluding source-code options).

This option will give you access to updates for 3-months only (no technical support) and reduces the price of purchasing licenses from SciChart by about 30% and should make things considerably cheaper if you don’t think you will need access to our tech support during your development:

No Support Option Pricing (Developer Licenses)
  • SciChart WPF 2D Pro: $629 (vs. $899 with 1-year support, Save $270 USD!)
  • SciChart WPF SDK Pro: $1229 (vs. $1749 with 1-year support, Save $520 USD!)
  • SciChart iOS 2D Pro: $549 (vs. $789 with 1-year support, Save $240 USD!)
  • SciChart Android 2D Pro: $549 (vs. $789 with 1-year supportSave $240 USD!)
  • SciChart iOS & Android 2D Pro: $874 (vs. $1,249 with 1-year support, Save $375 USD!)
No Support Option Pricing (Site Licenses)

Site licenses are also available for unlimited developers at a single physical site. For example:

  • SciChart WPF 2D Pro Site: $6299 (vs. $8990 with 1-year support, Save $2700 USD!)
  • SciChart WPF SDK Pro Site: $12490 (vs. $17490 with 1-year support, Save $5241 USD!)
  • SciChart iOS & Android 2D Pro Site: $6229 (vs. $8990 with 1-year support, Save $2700 USD!)

You can see all the pricing live now at store.scichart.com

SEE THE SCICHART STORE

What are the terms?

With the 1-year, 2-year, 3-year and lifetime support options, you get priority support at support.scichart.com, or via the forums at www.scichart.com/questions. We will aim to answer your questions within 1-business day, and solve problems as quickly as reasonably possible.

With the no-support option, your access to these systems won’t be prevented, but it will be ignored. Meaning you may receive an auto-response but please don’t expect to have questions answered. We have to be strict about this, sorry.

Your no-support license will allow you to get major & minor updates from SciChart such as bug fix builds, new features, for 3-months from purchase, not for a full-year like the 1-year support plan.

What if I want to report a bug?

Please do! You can report bugs by emailing . Please be sure to include:

  • The platform you are using (e.g. WPF, IOS, Android)
  • The version of SciChart you are using
  • Steps to reproduce the bug
  • A code sample (if applicable)
  • Screenshots (if applicable)

Bugs will be filed in our task tracker, and prioritised according to severity of the bug, and our workload. If we do fix it, we’ll try to contact you back to let you know.

What if I do need help?

We do have an extensive set of examples and documentation for all our charts, and more is coming soon such as getting-started guides and tutorials. If you do need help please try to use these resources as you may find the answer here.

scichart-documentation-examples

If you get really stuck you can always ask at stackoverflow.com using the tag:SciChart. However, please be advised our team is not obliged to answer questions.

Finally, if you do wish to upgrade to a support plan after purchasing a no-support license, please contact sales. We would be happy to quote this for you.

Why have we done this?

By far our biggest cost is tech-support, and we really put a lot of effort into it! You can read this article here which talks about just how many support-requests we resolve (hint: thousands) and the sorts of amazing feedback we get from customers – it really is encouraging to see our customers love what we do and rate us highly!

We’ve always prided ourselves on excelling at support, and we personally think its a very important part of what we do. However, the market is showing us that if we want to grow we need to consider no-support options, as they can allow us to scale at a rate we previously were not able to.

Finally ..

Finally, If you do have feedback about this option or want to ask a few questions, feel free to contact us, we will do our best to help.

Best regards,
[SciChart Team]


The post Announcing No-Support Product Pricing Options appeared first on WPF Charts, iOS and Android Charts | SciChart.

SciChart iOS v1.2.0 Released

$
0
0

We are pleased to announce that SciChart iOS SDK v1.2.0 has now been released! Please see below for the list of improvements / features added and bugs fixed.

If you are using SciChart iOS v1.x then this update is a drop-in replacement.

What’s New in SciChart iOS v1.2.0?

New Features

Bugs Fixed

  • SciChart no longer throws exception if data is unsorted in X
  • Fixed a memory leak in Realtime Ticking Stock Charts example.
  • Fixed modifiers not synchronising at Swift Multiple Surface example.
  • Fixed error where chart is blank when AutoRange.Never is used.
  • Fixed issue with heat map when drawing multiple surfaces.
  • Fixed issue with Heatmap ZRange.
  • Fixed issue with AxisMarkerAnnotation displaying incorrect colours on simulator.

Where to get SciChart Downloads?

You can get the SciChart iOS SDK v1.2.0 from the Downloads page. Source code customers can also get-latest from our Github repository.

GET SCICHART IOS v1.2.0

Best regards,

The post SciChart iOS v1.2.0 Released appeared first on WPF Charts, iOS and Android Charts | SciChart.


SciChart Android v1.2.0 Released

$
0
0

We are pleased to announce that SciChart Android SDK v1.2.0 has now been released! Please see below for the list of improvements / features added and bugs fixed.

If you are using SciChart Android v1.x then this update is a drop-in replacement.

What’s New in SciChart Android v1.2.0?

New Features

  • NEW! Android Nougat SDK 24 Support
  • NEW! Added new documentation topics: Axis APIs, 2D Chart Types, Styling and Theming, PaletteProvider APIPointMarker API and many more.
  • NEW! MinimalZoomConstrain / MaximalZoomConstrain Api to allow limiting of zoom and pan
  • Optimised Candlestick and OHLC Chart Rendering performance. These two chart types draw up to 5x faster in SciChart Android v1.2 vs v1.1.

Bugs Fixed

  • Fixed incorrect column width when zooming in FastColumnRenderableSeries
  • Fixed Mountain chart stops responding when zoomed in
  • Fixed CursorModifier falls apart when zoomed
  • Fixed LineAnnotations fall apart when zoomed
  • Fixed CursorModifier, RolloverModifier axis labels remain on the chart in some cases
  • Improved ZoomExtents animation
  • Fixed PaletteProvider example fails to work when the chart is rotated
  • Fixed ShiftedAxis (central axis) behaviour fails to work after rotating the chart
  • Fixed IndexOutOfBoundsException in AxisTickLabelRendererComponent
  • Fixed CategoryTickProvider crashes with OutOfMemory in some cases
  • Fixed cannot use PanModifier immediately after rotation.
  • Fixed BandSeries artefacts when zoomed out
  • Fixed Realtime Ticking Stock Charts strange behaviour when Zoomed to extents
  • Fixed SeriesInfo reports incorrect coordinate for vertical charts

Where to get SciChart Downloads?

You can get the SciChart Android SDK v1.2.0 from the Downloads page. Source code customers can also get-latest from our Github repository.

GET SCICHART Android v1.2.0

Best regards,

The post SciChart Android v1.2.0 Released appeared first on WPF Charts, iOS and Android Charts | SciChart.

SciChart iOS Android Charts Bug Tracker is now public!

$
0
0

As an experiment into improving transparency and feedback on our development processes, we have taken the bold step to make our Android & iOS Project Issue Tracker public!

Have a watch of the video above to see how to navigate the issue tracker.

Links to the Issue Tracker:

As always, your feedback is welcome!

Best regards,
Andrew
[SciChart Team]


The post SciChart iOS Android Charts Bug Tracker is now public! appeared first on WPF Charts, iOS and Android Charts | SciChart.

Transitionz WPF – Free library for Metro style Animation Effects

$
0
0

We spent a little bit of time at the weekend open-sourcing one of the libraries that we use in the SciChart WPF Examples Suite and Licensing Wizard which handles cool animation effects!

You’ve seen the cool animation effects in the WPF Chart Examples Suite right? Well we’ve achieved this using the now open-sourced Transitionz WPF library!

This cool little library allows you to animate Opacity, Translate Transform, or Blur.

transitionz-blur

Transitionz.Blur, Translate and Opacity on Visibility Changed

You can do really complex things and trigger animations on loaded, on Visibility Changed or on Property Changed via bindings. We use it in the SciChart WPF Examples Suite as well as the Licensing Wizard to achieve these cool effects.

Transitionz.Blur, Opacity and Translate used in the Licensing Wizard app

Transitionz.Blur, Opacity and Translate used in the Licensing Wizard app

If you want to include Transitionz in your app and have cool animation effects, you can get it for free from NuGet as the SciChart.Wpf.UI.Transitionz package (licensed under Apache 2.0 – free for commercial use). Alternatively, we have also published the full source to Github.

For usage instructions please see the Transitionz-Library wiki page.

Enjoy!

[SciChart Team]


The post Transitionz WPF – Free library for Metro style Animation Effects appeared first on WPF Charts, iOS and Android Charts | SciChart.

SciChart WPF: New set of tutorials now online

$
0
0

If you are new to SciChart WPF, or have recently started using it, it’s well worth taking a look at our new set of tutorials for SciChart WPF!

These include the following topics:

Tutorials include:

By the end of the tutorials you should end up with a multi-chart, multi-axis chart, with realtime updates and annotations, scrollbars, zooming and panning behaviour, tooltips and legends, which looks a little like this:

multiple-charts-linked-events

If you are experienced with SciChart WPF, it’s worth having a look to give us your feedback.

Also, if you have any feedback for us about topics to include for future tutorials that would also be greatly appreciated.

Thank you!
[SciChart Team]


The post SciChart WPF: New set of tutorials now online appeared first on WPF Charts, iOS and Android Charts | SciChart.

SciChart WPF v4.2 Build 9172 Released!

$
0
0

So those of you who have been watching our releases page will notice that SciChart iOS & Android v1.2 were released several weeks ago, but SciChart WPF is no-where to be seen!

Well, the good news is that while we have been delayed in our SciChart WPF v4.2 release, we are now ready to publish it! The delay was due to an extra round of testing & bug fixing (over and above the norm for SciChart releases) in order to make this one of the most stable and perfected releases of SciChart ever.

If you have a moment you can take a look at our Task Tracker board showing the status of the SciChart v4.2 Sprint. Our Issue Tracker was made public (read-only) a few weeks ago and you can now browse the status of sprints, tasks and bugs that you have reported.

Have a look below to see what’s coming soon.

XPS, Png Issues Fixed

In SciChart v4.2 we have literally fixed over 20 bugs related to Xps and Png export. The level of bugs in this feature was quite frankly, embarrassing, and we apologize to our users for putting them through this! In our defense, the image/XPS export feature is hugely complex, and requires us to make a perfect clone of the SciChartSurface in memory, and off-screen, for rendering to Png or XPS (Vector format) at a size other than the current chart.

Literally over 20 bugs reported and fixed related to XPS, Png export!

Literally over 20 bugs reported and fixed related to XPS, Png export!

This is now done and the export works beautifully. We have also explored various ways of UIAutomation testing and come up with a Visual Test Framework that compares expected vs. actual Bitmap / XPS outputs in a variety of edge cases, plus, created over 150 test cases to cover this extremely popular feature.

SciChart's Visual Test Framework allows UIAutomation and image comparison for the Export to XPS/Png Feature

SciChart’s Visual Test Framework allows UIAutomation and image comparison for the Export to XPS/Png Feature

Improvements to SciChart3D

Some feature requests for SciChart3D have been added to SciChart WPF v4.2. These include the ability to switch from Right to Left Handed Coordinate systems, fixing issues with 3D Pointmarker Transparency and creating an example to demonstrate adding custom Cube Geometry and Text to the scene.

text-cube-geom-example

We have also added handling of order-independent transparency for some entities in the scene as well as the ability to create custom PointMarkers for 3D Charts.

Pie Chart and Donut Chart!

Hotly requested on our Features Survey a few months ago, as well as on the website more than once we have now fiiiinaaally added Pie Chart and Donut Chart to the SciChart WPF Charting SDK.

scichart-donut-chart-pie-chart-play

We don’t know why this chart type is so popular, but you wanted it, so we built it! We hope you like it!

Negative Logarithmic Axis

It is possible to show data points with negative values on a logarithmic scale. Use our new NegativeLogarithmicAxis for that!

Negative Logarithmic Axis

Some Minor Improvements

We’ve added a SciChartSurface.ZoomState property to allow you to know if the user is zooming or not. This is used in our Tutorials to allow real-time zooming and panning alongside realtime scrolling charts.

Oh and we’ve created 9 new tutorials to help new users get started with SciChart WPF.

We’ve added a DataSeries.Tag property.

We’ve added an overload to ExportToBitmapSource(Size) so you can specify a size before exporting.

We’ve also added SeriesValueModifier.IncludeSeries and SeriesSelectionModifier.IncludeSeries properties so you can hide a series from these modifiers.

We’ve made the DataPointSelectionModifier work with more series types such as Stacked series, Band Series and Bubble Charts.

We’ve added methods to ViewportManager to allow you to ZoomExtents in a delayed fashion after updating data via Databindings.

We’ve made the RolloverModifier MouseOver Hover mode work properly with Realtime-charts.

We’ve added support of PaletteProvider to FastBoxPlotSeries.

We’ve added the properties Viewport3D.ForceStallUntilGPUIdle and Direct3D10RenderSurface.EnableForceWaitForGPU which can be used to stall DirectX rendering until GPU is idle (resolves flicker on some older hardware).

Finally, SciChartLegend.Background is bound to LegendModifier.Background by default now.

A Bazillion Bug Fixes

There are also many many bug fixes in this release, and also a lot of UIAutomation tests and unit tests have been added to reduce the chance of them creeping back in in the future. The list of bug fixes in SciChart v4.2 can be found below.

Fixes for SciChart 2D
  • FileNotFoundException during startup (licensing) – added a check whether file exists before loading AltStorageStrategy.
  • Fixed hanging tooltips (RolloverModifier, TooltipModifier) where there were gaps in data (dataPoint.Y==NaN).
  • Fixed regression in behavior with the ShowTooltipOn mode for RolloverModifier, VerticalSlicesModifier.
  • Fixed a runtime exception in VerticalSliceModifier when X1 was set to Int in XAML.
  • Fixed a runtime exception in VerticalSliceModifier on clearing VerticalLines.
  • Fixed crash in SeriesValueModifier when trying to bind its VerticalLineAnnotationCollection.
  • Fixed binding errors on LegendModifier when a Legend showed ScrollBars.
  • Fixed the issue with DataPointSelectionModifier when it allowed to select points on invisible series.
  • Fixed DataPointSelectionModifier to allow selecting many points for FastBubbleRenderableSeries, StackedColumnRenderableSeries.
  • Fixed DataPointSelectionModifier for vertical charts.
  • Fixed crash in IAxis: Scroll(), Zoom(), ZoomBy(), ScrollByDataPoints() methods failed if VisibleRange==Null.
  • Fixed LegendModifier doesn’t reorder items when series order changes.
  • Fixed the issue when CategoryDateTimeAxis gets scrolled by mouse clicks.
  • Fixed CategoryDateTimeAxis when it fails do draw gridlines if all series are hidden.
  • Fixed panning with CategoryNumericAxis.
  • Fixed Heatmap opacity when drawing using XamlRenderContext.
  • Fixed different Heatmap rendering with XamlRenderer when zoomed in.
  • Fixed text drawing on Heatmap with XamlRenderContext.
  • Fixed Heatmap colors with XamlRenderContext.
  • Fixed XAMLRenderer issue when it rendered gradients differently than other renderers.
  • Fixed FastBubbleRenderableSeries didn’t render with XAMLRenderContext.
  • Fixed disappearing lines in BoxPlotSeries with XAMLRenderer.
  • Fixed an issue when the Stroke of underlying series was visible through an opaque upper series with DxRenderContext.
  • Fixed a crash for FastBandSeries when zooming out to max with DxRenderContext.
  • Fixed Z-Order of series with DxRenderContext.
  • Fixed a NullReferenceException in SciStockChart which occured in DataTemplateSelector.OnDataTemplateChanged().
  • Fixed HitTest not working on vertical Impulse Chart.
  • Fixed HitTest for Polar Charts.
  • Fixed incorrect Rollover axis label on Polar Charts.
  • Fixed a bug in TernaryPolygonSeries where it drew text when a series was hidden.
  • Fixed the issue when tooltips showed empty error values for ErrorBarSeries.
  • Fixed the issue when tooltips showed incorrect Z Value on Ternary Charts.
  • Fixed an exception in VerticalLineAnnotation when changing VerticalAlignment.
  • Fixed the issue with CompositeAnnotations when they didn’t react on interaction with children annotations.
  • Fixed the bug when a CompositeAnnotation couldn’t be hidden.
  • Fixed an intermittent crash with annotations when an exception was thrown during animation of ResizingGrips on Selection.
  • Fixed TextAnnotation incorrect positioning when YAxes are stacked vertically.
  • Fixed a positioning issue with VerticalLineAnnotation and AnnotationLabel margin issues.
  • Fixed a regression with the default PointMarker.DataContext.
  • Fixed a bug when SciChart didn’t release event subscribtions on Dispose().
  • Fixed ShiftedAxesBehavior which placed axes incorrectly when the size of a Window changed.
  • Fixed an intermittent internal InvalidOperationException in TransformToVisual().
Fixes for SciChart Export to File / XPS
  • Changed the error message for exceptions that occur during exporting a chart. Now it reports the property which caused a crash.
  • Fixed the ExportToFile() method which did not use XamlRenderSurface when it had to.
  • Fixed serialization (exporting) of CompositeAnnotations.
  • Fixed serialization (exporting) of CustomAnnotations.
  • Fixed serialization (exporting) of other annotation types.
  • Fixed serialization (exporting) of AnnotationCreationModifier.
  • Fixed serialization (exporting) of the default themes.
  • Fixed serialization (exporting) of custom axis types.
  • Fixed serialization (exporting) of styles (AxisTitleStyle, TickLabelStyle, MajorGridLineStyle, MinorGridLineStyle, MajorTickLineStyle, MinorTickLineStyle, etc.)
  • Fixed serialization (exporting) of LegendModifier when a Legend was configured via Templates.
  • Fixed serialization (exporting) of SciChartSurface properties when inside a DataTemplate.
  • Fixed serialization (exporting) of RenderableSeries with the PointMarker, PointMarkerTemplate properties set.
  • Fixed an intermittent InvalidOperationException during exporting to XPS (“Specified Element is already logical child of another element”).
  • Fixed an export issue with AxisId when ScichartSurface was inside a DataTemplate.
  • Fixed serialization the ColorMap property on Heatmap.
  • Fixed serialization of the TextFormatting, CursorTextFormatting, AxisTitle properties of axes.
  • Fixed an exception when trying to serialize TimeSpan.
  • Fixed serialization of the VerticalScrollBarVisibility property of the LegendModifier.
  • Fixed serialization of gradient brushes.
  • Fixed deserialization of StrokeDashArray.
  • Added text scaling for exporting a chart with larger size for:
    – CompositeAnnotations
    – AxisTitles
    – ChartTitle
    – TextAnnotaions
    – HorizontalLineAnnotations
    – VerticalLineAnnotations
    – CustomAnnotations
    – AxisMarkerAnnotations
    – Legends
Fixes for SciChart 3D:
  • Fixed a crash caused by creating a type before SCRTDllLoader.InitNativeLibs was called “DllNotFoundException” for SciChart3DNative.dll
  • Fixed the issue when the TooltipModifier3D always showed a tooltip for the first SurfaceMesh only.
  • Fixed 3D hit-test (tooltip) failure when there were more than one Scatter or Bubble Series on a chart.
  • Changed default TooltipModifier3D tooltips – they show SeriesName now.
  • Fixed incorrect screen coordinates computations when camera is not right in front of surface.
  • Fixed the issue when a 3D chart did not obey Major/Minor GridLine Color from SC3D Themes.
  • Fixed a crash with the SelectionModifier3D.
  • Fixed the issue when RenderableSeries3D would appear despite that DataSeries was set to Null.
  • Fixed incorrect property definition in the BasePointMarker3D (SelectedFill)
  • Fixed PointMarkers3D transparency issue when they ignored alpha channel of a color coming from a metadata.
  • Added the default color for a selected PointMarker3D.
  • Fixed the issue when custom PointMarkers3D weren’t disposed.
  • Fixed Z fighting issue with columns using back face culling.
  • Fixed columns shader, which would invert models when the heights were negative.
  • Fixed incorrect x,z columns sizes in GridData. It caused exception in UniformGridDataSeries3D.CopyFrom(TY[][] innerArray)
  • Fixes Entityid not incremented to next available value when scene entities attached meaning it was not possible to have more than one Scatter Series 3D with a tooltip.
Improvements to the Examples Application
  • Added a showcase for a new NegativeLogarithmicAxis to the “Logarithmic Axis” example.
  • Created the example called “Add Geometry to a 3D Chart” to demonstrate custom cube geometry and custom text in a 3D chart.
  • Added the MouseWheelModifier as a default modifier to the SciChartInteractionToolbar.
  • Added possibility to edit segments in the “Using Pie Chart”, “Using Donut Chart” examples.
  • Added a possibility to zoom to extents on double-click in the “Annotations Are Easy” example.
  • Changed the “SciChart Trader Demo” example to fix Rollover, Cursor bindings from the toolbar.
  • Changed the “Series Binding with MVVM” example to use ObservableCollection.
  • Cosmetic changes to the “Interaction With Annotations” example.
  • Fixed an issue when a FibonacciExtensionAnnotations, FibonacciRetracementAnnotations couldn’t be interacted with when a mouse was over the internal TrendLine.
  • Fixed the FlipModifier in the SciChartInteractionToolbar.
  • Fixed toolbar buttons in the “Chart Legends API” example.
  • Fixed the FPS counter in the “50-Channel EEG” example. It failed to show FPS after chart data was reset.
  • Fixed parsing of YAxis.VisibleRange from text in the “Modify Axis Properties” example.
  • Fixed the ZoomExtentsY option in the “Pan X or Y Direction” example.
  • Fixed mixed up settings in the toolbar in the “Modify Camera3D Properties” example.
  • Fixed the toolbar in the “RealTime Polar Charts” example.
  • Fixed the background chart of the SciChartScrollbar in the “Multi-Pane Stock Charts” example.
  • Fixed the “Stacked Bar Chart” example – sometimes it appeared upside down because of bindings.
  • Fixed empty error values in tooltips in the “ErrorBar Series TernaryChart” example.
  • Fixed the “Series Custom Tooltips 3D Chart” example crash on startup.
  • Fixed the “Dashboard Charts” examples. Charts did not zoom to fit after switching between views.
  • Fixed some examples which failed to compile after export.
  • Fixed examples export crash when SciChart is installed on “C:/”.
  • Added a possibility to cancel export when choosing directory.
  • Added a check whether the chosen directory, file is available.

Where to get it?!

You can get all the SciChart Releases from the www.scichart.com/downloads page. If you haven’t created an account with SciChart.com yet, please do. You will need to in order to access the downloads.

If you are a customer of SciChart you can also access our binaries via our NuGet feed as well as Github (for source-code customers).

Best regards,
[SciChart Team]

The post SciChart WPF v4.2 Build 9172 Released! appeared first on WPF Charts, iOS and Android Charts | SciChart.

Viewing all 302 articles
Browse latest View live