Check out this Quickest of the QuickStart Guide below which shows you how to start a trial, run the Examples Suite, work through the tutorials and see what SciChart can do.
1. Starting a SciChart Xamarin Trial
SciChart is shipped as a Xamarin binding libraries (supporting Xamarin Native) around our Android and iOS Chart Library. As a result, to start a trial on SciChart Xamarin you have to start a trial on both iOS and Android platforms.
To get started, download and install the SciChart Cross Platform Licensing Wizard to your Windows or Mac Desktop.
Next Log in using your SciChart.com username and password (Create one), and click ‘Start Trial’ on the Trials page. Do this for each mobile platform you are developing your Xamarin app for (iOS or Android).
Take a moment to start a trial now, so that you can get working as soon as possible.
Note, SciChart iOS licenses also work for Xamarin iOS, and Android licenses work for Xamarin Android. If you have purchased a paid license, then head over to Licensing SciChart iOS or Licensing SciChart Android to learn how to activate and use it.
This is how we distribute nightly builds (major versions are on NuGet.org) and you’ll need it to build the Xamarin Examples.
Next, paste in your license keys and build and run the app!
This short 2-minute video shows you how to compile the SciChart Xamarin v3 Examples and include license keys in the app, to run SciChart for Xamarin.iOS & Xamarin.Android
Note: Performance in the iOS Simulator is much poorer than a device. Try on a real device to see the extreme performance of our iOS/Android 2D & 3D Charts!
3. Creating your First SciChartSurface (Tutorials)
We now have a full set of tutorials online, to walk you through the basics of getting to know SciChart Android. Each Tutorial has an Android Studio project which you can find in SciChart.Xamarin.Examples Github repository.
We recommend to learn SciChart quickly, get through the tutorials as soon as you can, as they will teach you a lot of techniques quickly (Creating a project, series, data, real-time updates, tooltips, zooming, panning, legends, annotations and more).
4. Ok Great! So where is the Documentation?
All of our documentation is online. Please see the following resources to help you get started.
SciChart iOS & Android v3 Documentation is available online. The iOS/Android documentation serves as a reference for SciChart Xamarin and has C# code samples in pages where applicable. Find the docs below:
We believe you will not find a better-supported Xamarin iOS & Android Chart Library than SciChart!
If you have a question, please try our new full site search engine (top of the page), or, dare we say it, Google! This has been custom-built to search the Forums and Knowledgebase, giving you relevant and accurate search results. There are thousands of pages on the SciChart site with content to search from, so if you have a query about SciChart iOS Tooltips, or SciChart Licensing, just try the search and you should be able to find something useful.
But if that’s not enough, you can Contact us anytime and one of our staff will get back to you. We aim to answer all requests within 1-business day.
During your trial of SciChart Xamarin iOS/Android we will gladly answer your technical questions about the chart. After the trial expires, you may purchase a support subscription to maintain access to technical support & to continue developing with SciChart.
We are delighted to announce to you today that SciChart Mobile SDK v3 has now been released! Thank you for all your feedback during the BETA period, in which we have fixed hundreds of bugs and issues, making SciChart iOS/Android v3 ready for production use.
Existing customers of SciChart iOS/Android in support subscription can get the release right away for free by visiting our downloads page.
What’s New?
A full list of what’s new can be found below:
Please take a moment to read it and find out about our incredible new rendering engine which brings you 2D & 3D iOS, Android and Xamarin Charts, as well as general performance improvements and a huge step forward in our iOS Chart Library API and documentation.
The new SciChart Store has now been launched, and can be viewed at scichart.com/buy-now. You can buy online with credit card or pay by wire transfer and our automated system will issue licenses immediately.
For enterprise sales and purchase orders, please contact us and we will be glad to help!
Renewals and Upgrades
Existing customers with expired support will be able to upgrade for the next 30-days with a renewal discount (discount amount dependent on your support-expiry date), after that the renewal offer will expire. Please contact sales asap to get a custom quote.
Finally…
Thanks to all our customers who have given us feedback during the BETA period. And thanks to our incredibly talented tech team who have taken an already powerful iOS/Android chart library and taken it to the next level of what is possible on mobile devices!
We are pleased to announce the release of SciChart WPF v6.0.1, build 12982. This update includes a small number of bug fixes reported by users since the 6.0.0 release last week. This release is a drop-in replacement for 6.0.0 and it is recommended to update if you are affected by any of the issues listed below
What’s new in v6.0.1?
SC-5230 Designer licensing check seems to be incorrect, showing ‘license not found’ when you have activated in the Visual Studio Designer using the Cross Platform Licensing Wizard.
SC-5191 AccessViolationException reported in SciChart WPF v6 with Visual Xccelerator in some cases.
SC-5211 Stroke property does not change the color of the Crosshair3D lines for the TooltipModifier3D.
SC-5219 Fixed SciChart3D setting tick length doesn’t have any impact on the axis.
Fix hit test examples : Point line series and Custom tool tips 3D Chart examples were crashing.
Using Install-Package or Update-Package from NuGet.
By cloning or downloading the source code on Github (source code customers only).
Please ensure you uninstall the previous version(s) of SciChart before installing the latest version as this can prevent some issues in the upgrade process!
Following the successful release of SciChart WPF v6, and the warm reception by our users for the massively improved performance, We were curious to see just what SciChart WPF v6 – The World’s Fastest WPF Chart was able to do … So just for fun, we created a tech demo which showcases SciChart drawing 10,000,000,000 (Ten Billion!!) data-points in a real-time, streaming, WPF Chart application.
The demo is part of our examples suite, but is capped to 1-Billion data-points. We modified this demo to draw 4, 8 Billion and 10 Billion points just to see what SciChart could do!
Rendering 10 Billion Data-points
The Limits of Technology
So what are the limits here? The limits we are pushing are honestly system RAM, and we start to hit some interesting operating system limits. For example:
The maximum number of items in an array in .NET is limited by Int32.MaxValue: approximately 2.1bn elements in a single array is the .NET Framework max.
The maximum size of an object in the managed heap is 2GB. For 32-bit floating-point values that caps your maximum array size to 536,000,000 items.
So, to display 10 Billion data-points, we had to create and draw many series of 500M points.
10 Billion points of floating point data requires 10Bn * 4-bytes * 2 (X,Y values) = 80GBytes of memory as well, and the best computer we could find in the SciChart office was a Macbook Pro with 64GB Ram. So, we had to rely on SciChart’s optimised swap-disk and memory compression algorithms, as well as our proprietary C++ / cross-platform 2D/3D graphics engine named Visual Xccelerator to render this quite frankly, massive, big-data set.
Next, we talk about the in-depth testing that we performed to measure the speed of our WPF Charts. Finally we talk about the technical accomplishments showing the performance improvements across chart types.
Have a read of the article to learn how SciChart beats all known competitors in WPF Charting performance.
The World’s Fastest WPF Chart Library
Without doubt, we are certain that SciChart WPF brings you the World’s Fastest WPF Chart control! Not only can you render huge data-sets but our charts are also lightweight and performant, giving you:
Lower CPU usage and memory usage than all known competitors.
Higher frame-rate (FPS) than all known competitors, including on lower-end hardware.
Full GPU acceleration, taking advantage of the latest and future advancements from nVidia, Radeon.
Full software fallback, for Virtual Machines without GPU, Citrix Gateway and Remote desktop
Parallelisation, taking advantage of the latest advancements from CPU Manufacturers Intel & AMD.
Not only that, but our WPF Charts are fast & flexible, support MVVM & XAML throughout, are award winning and are rated Best by hundreds of users. When you purchase SciChart WPF you are buying an incredibly complex piece of technical equipment with millions of lines of code, made simple & easy to use by our talented tech & engineering team.
Use our Getting-Started guide to start quickly and start building cutting-edge scientific, medical, financial applications such as ECG/EKG, Telemetry applications, Formula One, Seismic monitoring, High frequency trading or just outstanding business/enterprise applications with extreme real-time performance today!
We are pleased to announce the release of SciChart WPF v6.0.2, build 13023! This update includes bug fixes reported by users since the 6.x release earlier this month. This release is a drop-in replacement for 6.x and it is recommended for all users to update.
We respond to any issues or bugs quickly and are proud to give you a quick turnaround. During the process of resolving these issues we have been publishing to our Nightly Build feed continuously.
SC-5274 Crash in PointLineSceneEntity.CreateNativeMeshes in some conditions
SC-5265 After a 3D chart is no longer garbage collected: Exception – Native collection has been destructed
SC-5253 TradeAnnotations demo crashes in WPF v6 Examples Suite
SC-5245 Computers without D3DCompiler_47.dll can’t run SciChart WPF v6
SC-5235 Fixed NullReferenceException when removing annotation after changing its’ position
SC-5251 Fixed condition overflow in the AggregateByRange Filter,
Visual Errors fixed
SC-5252 Partially full Fifo DataSeries does not draw in some cases after upgrade to WPF v6
SC-5221 Wrong FastLineRenderableSeries geometry when X values are large and VisualXcceleratorEngine is enabled
SC-5249 Chart is blank in WPF v6 if one RenderableSeries does not have a DataSeries even if others do
SC-5250 Fixed multiple Aggregation Filter issues in realtime trading charts.
SC-5234 Charts are blank for some customers after they upgraded to v6
SC-5214 The Fill of the PointMarker becomes transparent if SciChart3DSurface.CoordinateSystem property is set to RightHanded
Blank 3D chart on startup by forcing GPU to wait for the first 8 frames after chart first shown.
Performance Improvements
SC-5268 Improve performance of SciChartSurface when UI Thread very busy through use of improved render scheduling.
To enable the new mode set the static RenderSurfaceBase.UseThreadedRenderScheduler property to true.
This mode particularly helps performance in Windows Forms (WinForms) applications, as it raises the scheduling priority of WPF Rendering.
Be advised this mode is experimental.
VisualXcceleratorEngine was using UseAlternativeFillSource always which is very slow on older GPUs. Disabled this default flag (was default=false in SciChart v5) and allowed user to set it manually
Misc
NuGet packages show Getting Started pages after first install.
NuGet packages show correct icon.
SC-5269 Changing DrawMajorGridLines Style doesn’t work
SC-5266 TooltipModifier3D shows empty X,Y,Z data values for UniformColumn3D
SC-5237 There are no histograms in the SciChart v6 version of the MarketProfileTradingExample
SC-5199 The keyboard event seems not to get through to the modifier in SciChart v6
SC-5264 Candlestick Width is changing when panning in X-direction
Update the SciChartPerformanceCounter to use Int64 so we can profile point-counts over Int32.MaxValue (2 billion points+)
Resolved several errors in AggregateByRange, AggregateByCount filters when used in realtime applications.
Using Install-Package or Update-Package from NuGet.
By cloning or downloading the source code on Github (source code customers only).
Please ensure you uninstall the previous version(s) of SciChart before installing the latest version as this can prevent some issues in the upgrade process!
We are pleased to announce that the SciChart WPF v6.1, build 13075 has now been released! This update includes a number of bug fixes reported by users since the version 6.0.2 release and a new feature. This release is a drop-in replacement for 6.x and it is recommended for all users to update.
We respond to any issues or bugs quickly and are proud to give you a quick turnaround. During the process of resolving these issues, we have been publishing to our Nightly Build feed continuously.
What’s new in v6.1.0?
New features
Preloading SciChart native libraries and async load licensing before a SciChartSurface is shown
Some customers have reported slow initial startup time with SciChart and asked for a way to do this initialization earlier in the application, e.g. when a splash-screen is shown.
App.xaml.cs overrides OnStartup and calls SciChart2D3DInitializer.LoadLibrariesAndLicenseAsync
MainWindow.xaml initially shows some loading content, no SciChartSurfaces are shown initially
MainWindow.Loaded event handler awaits SciChart2D3DInitializer.Awaiter before swapping the content for SciChartSurfaces
In essence, it doesn’t matter how you do it, just make sure you await the result of SciChart2D3DInitializer.LoadLibrariesAndLicenseAsync or SciChart2D3DInitializer.Awaiter (it’s the same task) before any SciChartSurface is called.
This method is fully thread safe, it can be called as many times as you like, but will apply license and init only once.
Note
SciChart2D3DInitializer (available in the SciChart 3D package) initializes both 2D & 3D libraries.
SciChart2DInitializer (available in the SciChart 2D Package) initializes just 2D
Exceptions fixed
SC-5315 Fixed AccessViolationException when changing MeshColorPalette on SurfaceMesh3DViewModel
SC-5307 HlcDataSeries index out of range exception fixed for NaN low or high values
SC-5314 Fixed NullReferenceException in BaseRenderableSeriesSceneEntity3D.set_IsVisible
SC-5302 Fixed unhandled exception in Dashboard Style Chart example
SC-5290 Fixed a crash with Tooltip popups
Visual Errors fixed
SC-5301 Improved the appearance of lines in the Visual Xccelerator engine by improving the anti-aliasing algorithm. This reduces the appearance of Jagged lines when dark series are on a light background.
SC-5112 Fixed incorrect colors of Candlesticks when YAxis is flipped
SC-5319 Fixed IsDigitalLine bug with VisualXcceleratorEngine and DataTemplate
SC-5316 Fixed FreeSurfaceRenderableSeries3D appears semi-transparent if MeshColorPalette is not set
SC-5279 Fixed Some visual anomalies on Band Series with Visual Xccelerator engine
SC-5311 Fixed cropped example titles, changed data template for example items
SC-5292 Fixed Incorrect Scatter Series appearance when custom PointMarker is used
SC-5273 Fixed Dashed line inconsistencies between Band and Line, DigitalLine series in SciChart WPF v6 with Visual Xccelerator engine
SC-5264 Fixed Candlestick Width is changing when panning in X-direction when X-axis is DiscontinuousDateTimeAxis
Other bugs fixed
SC-5322 Added missing view-model for the FreeSurfaceRenderableSeries3D
SC-5289 Fixed xyzDataSeries3D.Append() method causing issues in 3D Chart
SC-5309 Fixed default binding for SciChartScrollbar.SelectedRange when the axis is changed; overriding of custom user binding for SciChartScrollbar.SelectedRange and Vertical SciChartScrollbar scrolls in the opposite direction when clicking outside the scroller
SC-5303 Fixed RenderableSeries update delay after zooming out the SciChartSurface
SC-5313 Fixed RenderableSeries ignore opacity on the Fill brush when VisualXcceleratorEngine.IsEnabled=True
SC-5300 Fixed MouseEvents stick to the last window
SC-5306 Fixed “cannot find source for binding with reference” warnings when FastImpulseRenderableSeries is used
SC-5295 Fixed IsVisible property doesn’t work for PointLineRenderableSeries3D and ImpulseRenderableSeries3D
SC-5294 Fixed Histograms disappear in MarketProfileTradingExample when VXEngine is enabled
SC-5258 Fixed the Fill property change doesn’t work when VXEngine.IsEnabled=True
Using Install-Package or Update-Package from NuGet.
By cloning or downloading the source code on Github (source code customers only).
Please ensure you uninstall the previous version(s) of SciChart before installing the latest version as this can prevent some issues in the upgrade process!
We wanted to write a short note to our customers, past present & future to take a moment share our business continuity plans with you during the coronavirus / Covid-19 outbreak.
Availability of our Global Teams
SciChart is a UK-based business with distributed software-development team, with a strong bias toward remote working of our staff. Our development staff are located in the United Kingdom, and Eastern Europe and all staff are already prepared to work from home, which we do regularly. In the event of a lock-down or ‘work from home’ order, we anticipate zero disruption to our ability to serve our customers. We anticipate that our distributed, geographically diversified team will be able to continue to serve you without interruption during this time.
Availability of our Services
SciChart software is a perpetually licensed software development kit for drawing charts & graphs. Applications that you have deployed in the field require no connection to our services and have no dependence on our services to continue operation.
Licensing services required by one-time activation at the start of development are hosted by Microsoft Azure, globally available and with 99.99% uptime. Our website is hosted by WPEngine, itself a highly robust business with a strong business continuity plan in place and 99.99% uptime, e-commerce by several providers and banking by multiple banks / multiple currency accounts.
During the Covid-19 outbreak we anticipate zero disruption to services, since we have no dependence on physical supply chains and are an entirely online business. Nevertheless, we will keep a watchful eye on our dependent services and overall business health to ensure continuity of service for our customers.
Robustness of our Business
As an award-winning global business with almost ten thousand customers using SciChart in almost 80 countries, we are geographically diversified in terms of income from countries and regions (Americas, UK, Europe, Asia-pacific), sectors (engineering, medical, financial, defence) and business types (small, medium and large enterprise).
SciChart is run like an organic bootstrapped startup, with no debt or equity investment, low fixed cost overheads, has made a profit every year since incorporation in 2010 and is highly prepared for any storm.
During the first quarter of the financial year we are experiencing strong year-on-year growth of 50% and projections show this will continue throughout the year. Despite what happens in the global markets as a result of Covid-19, we are committed to not only surviving, but thriving in the years to come as we serve our customers with excellence in our software.
SciChart is experiencing strong Year-on-Year sales growth in first quarter of 2020 and we expect that to continue throughout the year.
Our WPF Chart software is rated best in the world by users, and we have hundreds of solid testimonials, reviews and continually receive ratings which can give you confidence that when you invest in SciChart, you are investing in the best 2D & 3D charting & visualisation software money can buy.
We are in a strong position to weather any storm, whether it be an outbreak, economic shock or disruption to movement of personnel.
Our distributed, remote team is available for hire to integrate SciChart to your applications, build custom visualisations, performance tune your software, or even build custom apps (Windows, Mobile, Xamarin) in entirety.
If you are interested in hiring our high performance team, or need the expertise of the creators of SciChart in your business, contact sales and we will be happy to discuss you requirements.
Our software development kit continues to be developed & we are carrying out cutting-edge research in Javascript charts, Mac OSX as well as continuing to build the worlds best, and fastest WPF, iOS & Android chart components.
If there is anything you need, and we can help with, whether it be using our charts, building custom visualisations or even just advice on how to effectively manage and run a remote team, we will be glad to serve you during these challenging times.
SciChart.js development is well underway within SciChart. Without giving too many technical details away, we have a cross-platform graphics engine which enables our extremely fast 2D & 3D charts on Windows, Mobile. This has now been cross-compiled to the web entirely and we are working on the top level API.
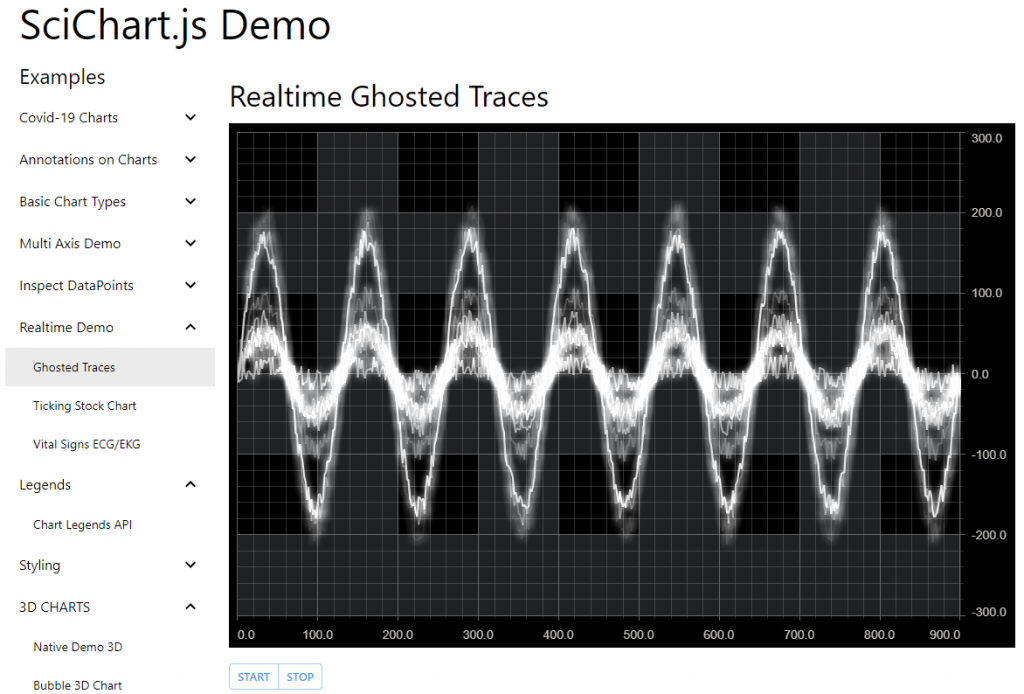
See below to see a short video of a stack chart rendering Line Series, multiple X & Y Axis, and panning behaviour on mouse down. Overall frame rate is very high, up to 60 FPS, and we anticipate the performance of SciChart.js to be very high as we develop the charts for real-time javascript applications.
SciChart.js will have the API you are familiar with when using SciChart. Our existing WPF, iOS & Android charts have the following concepts for chart parts:
SciChartSurface: the top level chart container
RenderableSeries: responsible for drawing Line, Mountain, Column, Scatter, Candlestick chart series
DataSeries: a data-structure which holds your data. Supports dynamic update (Append, Insert, Update, Remove) for real-time charts.
ChartModifiers: behaviours which are tagged onto the chart – zooming, panning, tooltips etc…
For example, declaring a chart like will be possible in TypeScript or Javascript using code like this:
// Create the SciChartSurface targeting DOM id canvas-id
const sciChartSurface = new SciChartSurface('canvas-id');

// Create DataSeries, using Append, Insert, Update, Delete that you are familiar with
const data = new XyDataSeries();
data.append([0,1,2,3,4], [10,11,12,13,14]);

// Add RenderableSeries for lines, candlestick charts, scatter charts etc...
sciChartSurface.renderableSeries.add(new FastLineRenderableSeries({ dataSeries: data } ));

// Add and configure X & Y axis
sciChartSurface.xAxes.add(new NumericAxis());
sciChartSurface.yAxes.add(new NumericAxis());

// Add zooming, panning or tooltip behaviour
sciChartSurface.chartModifiers.add(new ZoomPanModifier());
sciChartSurface.chartModifiers.add(new TooltipModifier());
…which would result in a chart with single X,Y axis, a line series with 5 data-points and the Zoom pan and Tooltip behaviours added to the chart.
We’re also aiming to make SciChart available to vanilla JS applications as well as popular frameworks such as React, Vue.js etc…
Why SciChart.js?
Why build SciChart.js? Javascript, Typescript and React chart libraries are ten a penny right?
Well, there’s a few reasons why we wanted to build SciChart for javascript applications, and why SciChart will be a great choice for your future web projects.
Realtime Performance
We’ve always provided the best-in-class for performance, and SciChart.js will be no different. Built on our blazing fast 2D/3D engine Visual Xccelerator, SciChart.js will be able to render millions of data-points in realtime in Javascript applications.
Excellent, Best-in-class API
Our API is rated the best for charts on Windows and Mobile platforms, because it is easy to use, powerful, flexible and provides deep customisation. SciChart.js will be no exception and we are porting our award-winning API to Typescript/Javascript so you can have the same excellent best experience on the web.
2D and 3D Charts
SciChart provides not only 2D Charts, but also hardware-accelerated 3D Charts. Need a WebGL powered 3D Chart component for scientific or data-intensive applications? SciChart.js will be able to do that.
Suitable for Demanding Applications
SciChart is geared towards demanding applications such as Financial & trading, Scientific & Medical, Engineering as well as complex enteprise applications which need the best possible visualisation.
Our software is used around the world by companies ranging from Automotive to F1, Banking & Trading, Oil & Gas to Cancer Research, Medical applications to fitness tracker apps. Across sectors SciChart makes impossible projects possible, and we believe web will be no different…
Sign up to our Newsletter!
Are you interested in real-time high performance 2D & 3D Charts for Javascript applications? To be notified about updates of SciChart.js as we develop for this exciting new platform, sign up below:
SciChart is also available for mobile devices, allowing extremely high performance charts on the iOS and Android Platforms. You can find out more about SciChart by visiting our website.
We are pleased to announce that the SciChart WPF v6.1.1, build 13136 has now been released! This update includes a number of bug fixes reported by users since version 6.1.0. This release is a drop-in replacement for 6.x and it is recommended for all users to update.
We respond to any issues or bugs quickly and are proud to give you a quick turnaround. During the process of resolving these issues, we have been publishing to our Nightly Build feed continuously.
What’s new in v6.1.1?
Exceptions fixed
SC-5361 NullReferenceException when switching between 2 3D examples
SC-5296 fixed SciChart 6 Visual Xccelerator Engine AccessViolationException over RDP connection when Remote Desktop was started / stopped.
SC-5320 3D Series: Ensure Append() works when colors are not passed in PointMetadata3D
SC-5321 fixed a 3D application crash and visual artefacts in SCRTPoint3DSceneEntity
SC-5298 fixed a System.AccessViolationException on Windows 7 with Visual Xccelerator engine
Other bugs fixed
SC-5361 NullReferenceException when switching between 2 3D examples
SC-5364 Fixed an issue with the uneven dashes on Band Series Chart
SC- 5330 HighPrecisionTickProvider fails to produce a tick for 0 in some cases
SC-5355 Allow high precision ticks on LogarithmicNumericAxis. Enable this mode by setting LogarithmicNumericAxis.EnableHighPrecisionTicks = true.
SC- 5238 When using LogarithmicNumericAxis3DViewModel in 3D charts, LogarithmicNumericAxis labels are displayed with floating point calculation errors
SC-5333 Axis view-models create wrong ViewType controls in MVVM scenarios.
SC-5332 Dashed Stroke is not persistent when zooming level changes
SC-5328 Fixed setting StrokeThickness to 0 on BandSeries has no effect
SC-5344 Fixed empty space instead of transparent 3DPointMarkers in when SurfaceMeshSeries3D.Opacity is set
Improved visual quality of 1 pixel lines in Band Series and Mountain Series with Visual Xccelerator engine.
Fixed incorrect Candles rendering when YAxis was Flipped
Using Install-Package or Update-Package from NuGet.
By cloning or downloading the source code on Github (source code customers only).
Please ensure you uninstall the previous version(s) of SciChart before installing the latest version as this can prevent some issues in the upgrade process!
In these unprecedented and unusual times we are pleased to announce to you that we are not only still operational, but also delivering new features & updates to our users and today have a release of SciChart Mobile SDK v3.1!
This release brings you some long-standing features requested by our users via the Feature Request portal, and some showcase demos of how to use SciChart iOS, Android or Xamarin in medical or scientific context.
What’s New?
A full list of what’s new can be found below.
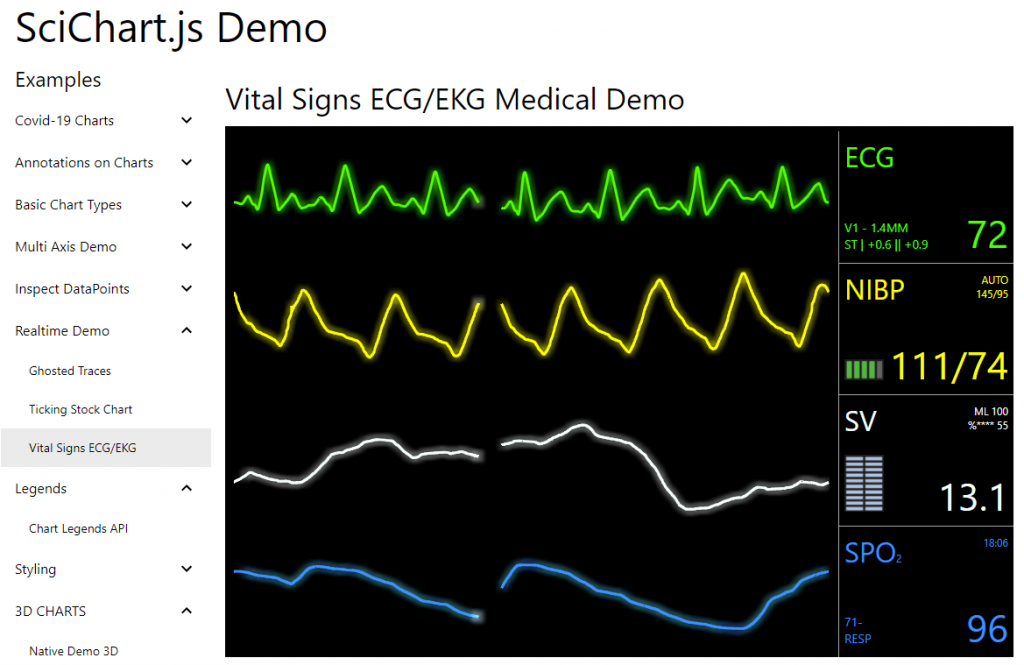
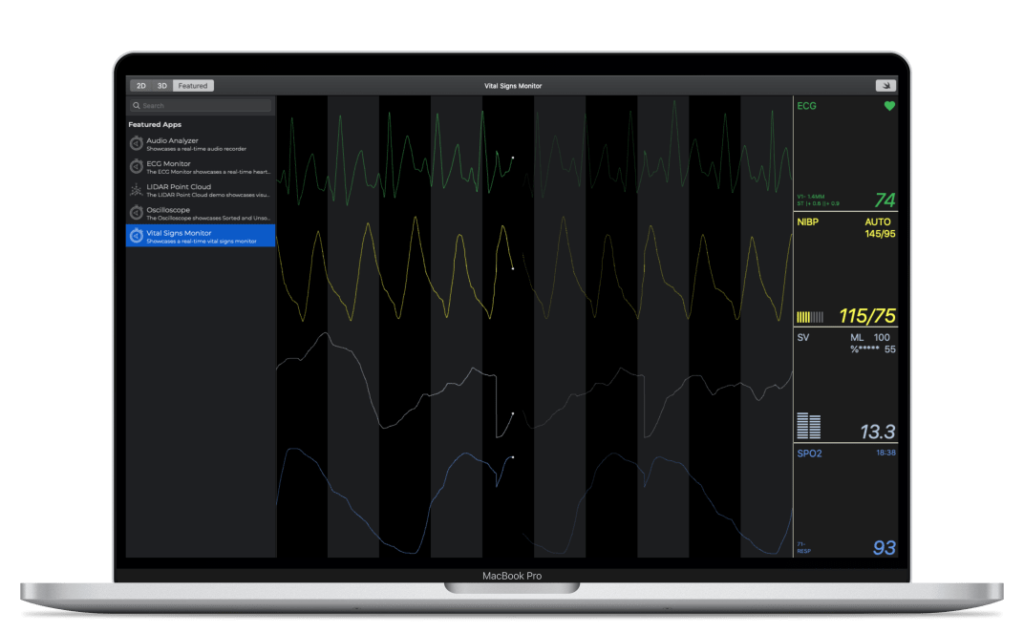
iOS/Android Vital Signs ECG/EKG demo
Formerly part of the SciChart showcase, we have created and updated our Vital Signs (ECG/EKG) demo showing how to use SciChart’s iOS, Android or Xamarin charts in a medical context.
Four channels of data are simulated, showing how SciChart iOS/Android can be used to draw real-time, high performance ECG/EKG charts & graphs to monitor blood pressure, SPO2 blood oxygen, and volumetric flow enabling you to create medical apps using an iPad or iPhone device.
SciChart helps you shortcut development of medical applications by providing rich, real-time, high performance & reliable iOS charts for use in Vital-signs monitors, blood pressure monitors, Electro-Cardiogram, medical Ventillators, patient monitors, digital stethoscopes, medical testing devices and more.
If you are creating an app that needs to visualize body temperature, pulse rate, respiration rate, blood pressure, or similar, choose SciChart to shortcut your development time & get to market faster with our well-tested, reliable iOS/Android/Xamarin Chart library.
To view the Vital Signs demo, download the SciChart Examples from the /downloads page and go to Featured Apps -> Vital Signs Demo. Or, see the following links:
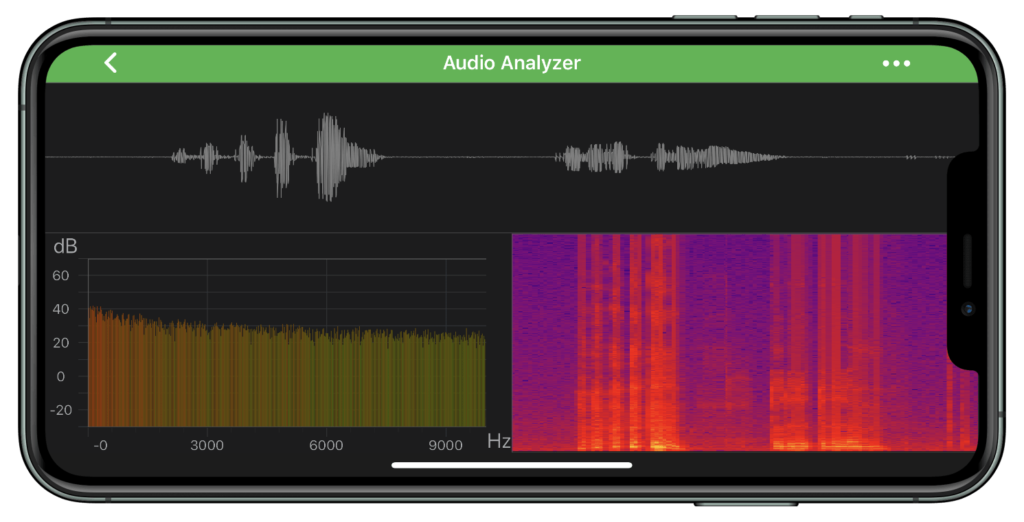
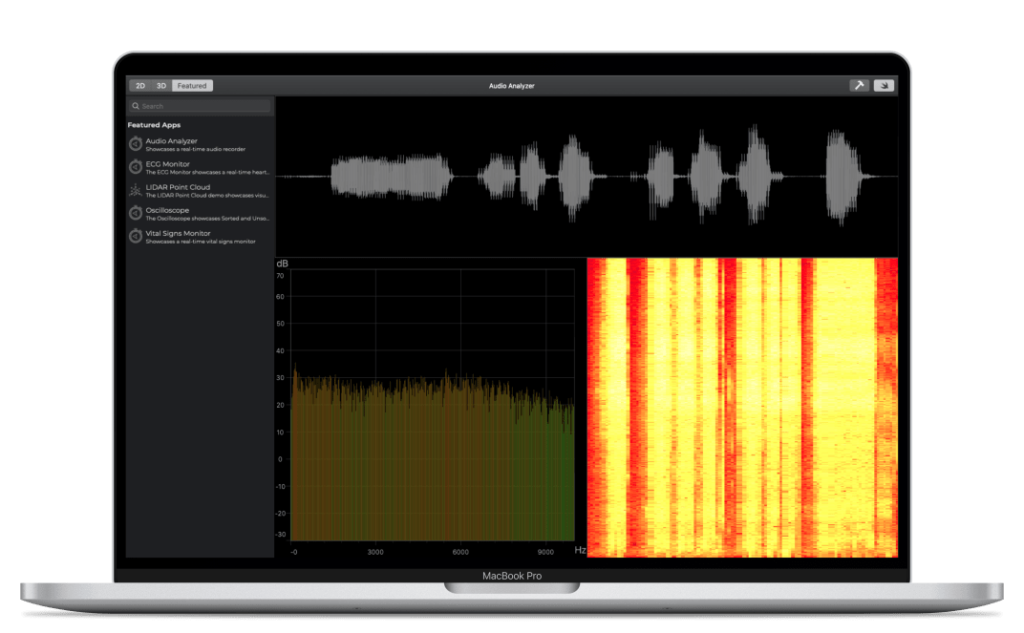
iOS/Android Audio, Radio Frequency & Spectrum Analyzer demo
Another demo we’ve created is the Audio/Radio Frequency Spectrum Analyzer demo.
The Audio analyzer demo showcases how to use SciChart iOS (android) charts in a scientific context. Download the examples and enable your microphone to see this demo at work.
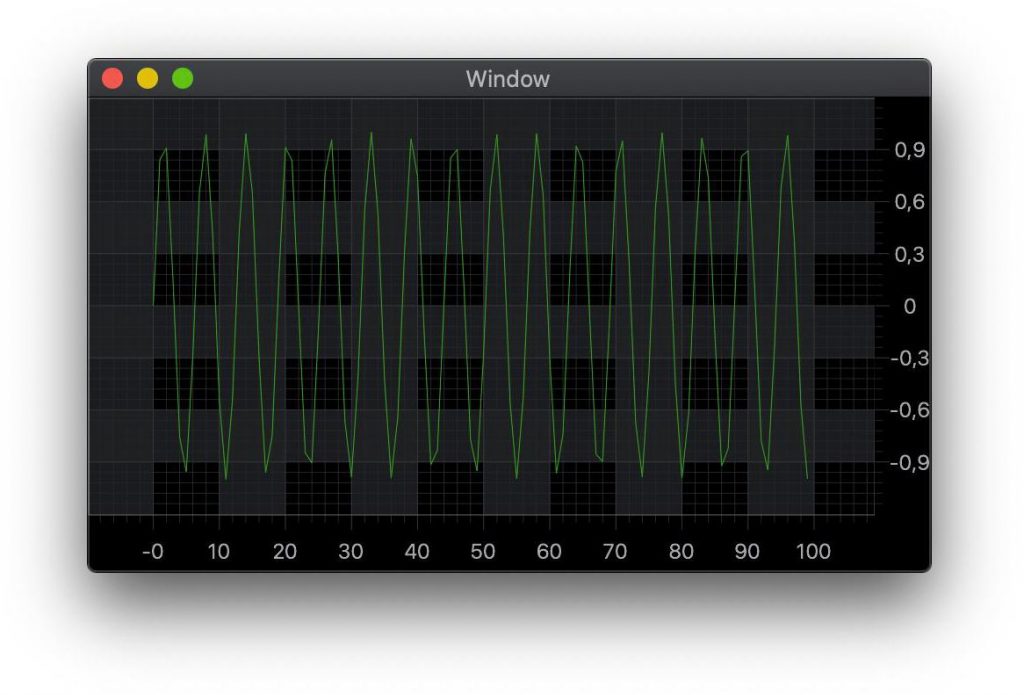
Fast, real-time Audio / Radio Frequency Spectrum Analyzer demo now been added natively to SciChart’s iOS/Android/Xamarin Chart examples
In this example we listen to the microphone on your iOS/Android device and create a waveform of the sound recorded in the top chart. This chart has 500,000 data-points drawn in real-time on our High Performance charts. The example application then performs a Fourier Transform, creating a spectral / frequency analysis of the audio waveform and plots in the lower left chart. Finally, the histogram of the fourier transform, known as a spectrogram, is plotted in a SciChart iOS Heatmap control in the bottom right of the example.
If you are creating an app that needs to visualize scientific data from data-aquisition devices, audio spectra, or visualize radio frequency or spectrial analysis choose SciChart to shortcut your development time & get to market faster with our well-tested, reliable iOS/Android Chart library.
To view the Audio Analyzerdemo, download the SciChart Examples from the /downloads page and go to Featured Apps -> Audio Analyzer Demo. Or, see the following links:
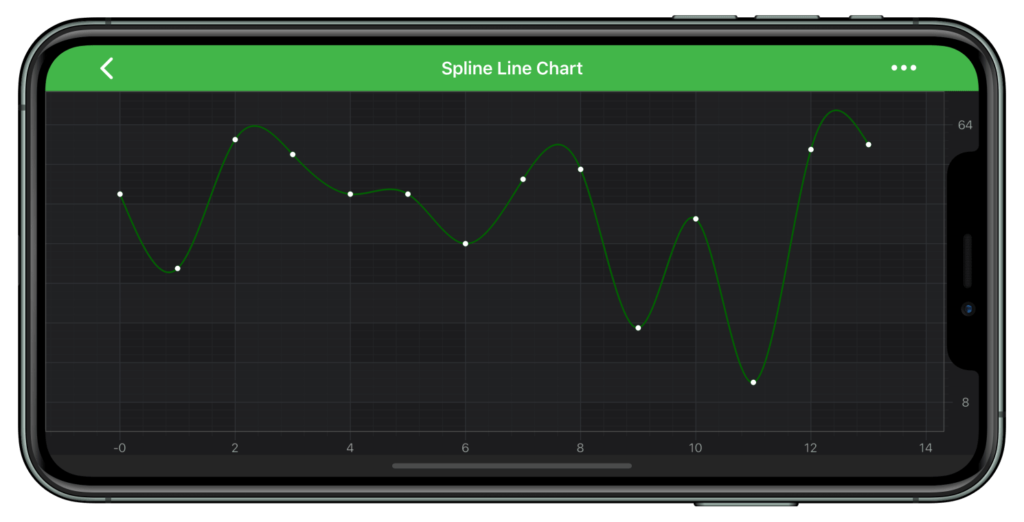
SciChart iOS & Android now features a native spline-line (smoothed line) series. Given a few number of points, our customers wanted to see smoother charts out of the box with spline smoothing / bezier interpolation between data-points.
SciChart Mobile SDK v3.1 features a spline line series which provides aesthetically pleasing, high performance smoothed line charts for iOS or Android apps.
Performance is excellent thanks to our intelligent, dynamic smoothing, and interactive frame rates with point counts in the 100,000 or even millions of data-points are still possible.
Fast, real-time Smoothed Line/ Spline Line charts have now been added natively to SciChart’s iOS/Android/Xamarin Chart library
To view the Spline Line Series, download the SciChart Examples from the /downloads page and go to 2D Charts -> Spline Line Series. Or, see the following links:
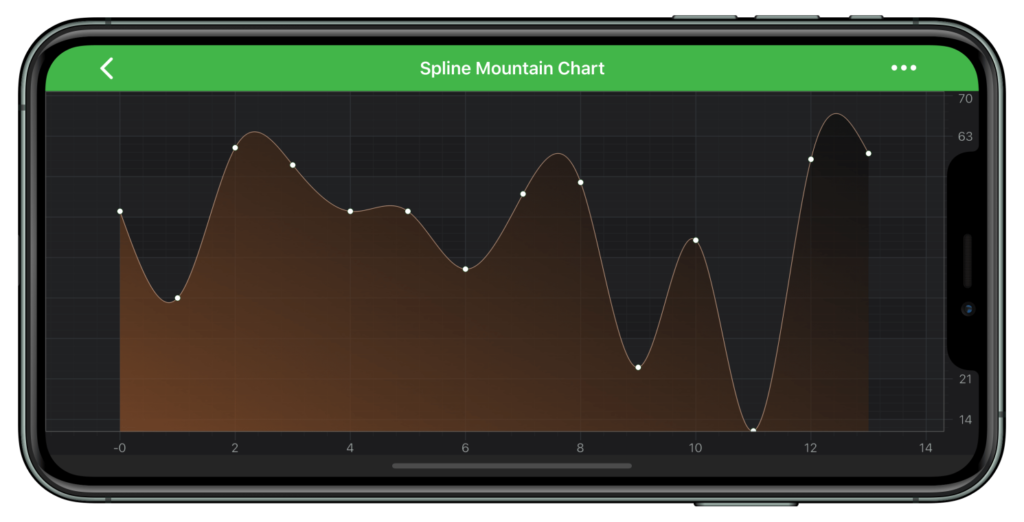
SciChart Mobile SDK v3.1 now features a spline mountain or area series which provides aesthetically pleasing, high performance smoothed mountain/area charts for iOS or Android apps.
Again, performance is excellent thanks to our dynamic smoothing and this chart type allows interactive frame-rates into the hundreds of thousands of points.
Fast, real-time Smoothed Mountain / Spline Mountain/Area charts have now been added natively to SciChart’s iOS/Android/Xamarin Chart library
To view the Spline Mountain Series, download the SciChart Examples from the /downloads page and go to 2D Charts -> Spline Mountain Series. Or, see the following links:
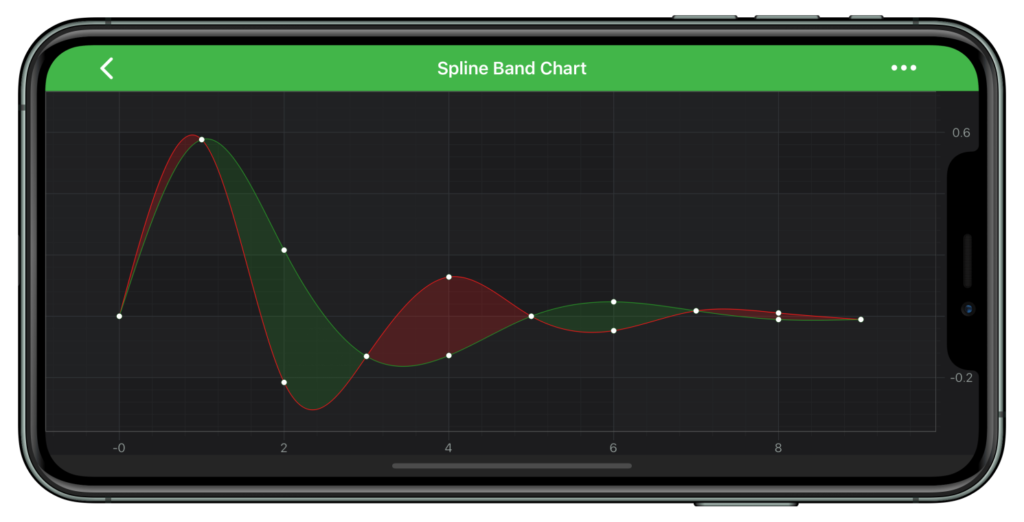
We’ve also added a spline band series natively which provides aesthetically pleasing, high performance smoothed band / high-low fill charts for iOS or Android apps.
Fast, real-time Smoothed Band / Spline Band charts have now been added natively to SciChart’s iOS/Android/Xamarin Chart library
To view the Spline Band Series, download the SciChart Examples from the /downloads page and go to 2D Charts -> Spline Band Series. Or, see the following links:
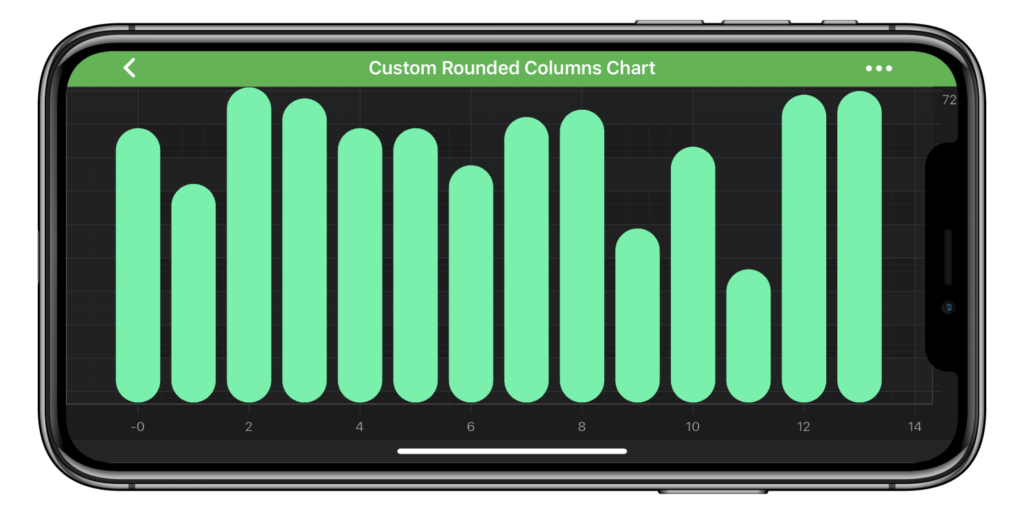
Column charts with rounded top/bottom have been requested via our Feature-request system. We haven’t build this feature natively but what we’ve done is used it as an example to showcase our powerful Custom Series API, which allows you to create any series type using a fast drawing context.
As we now support Spline Lines natively, we have adjusted our Custom Series demo to show you how to create a Rounded-Column series on iOS and Android. Find out how in the SciChart iOS/Android Examples App.
To view the Rounded-Column Custom Series Demo, download the SciChart Examples from the /downloads page and go to 2D Charts -> Custom Renderable Series. Or, see the following links:
SCIOS-933 – fixed Redundant series render before animation starts
SCIOS-958 – fixed SCIZoomPanModifier clipAtMax – left side stretching issue (fixed for iOS and Android)
SCIOS-971 – Fixed modifiers don’t work properly with StackedSeries
SCIOS-969 – Fixed fifoBuffer special case, when adding an array of data, and when fifoBuffer count hasn’t reached its FifoCapacity
SciChart for Mac OSX in Progress
We announced recently on our Twitter and Linked-In page that we are making steady progress toward making SciChart available on Mac OSX. The codebase and API will be shared with iOS, and we will support Objective-C, Swift apps built for MacOS desktop computers.
More info on this coming soon. Subscribe to our newsletter by registering with SciChart to be notified when we release!
SciChart for Mac OSX is being ported from our Objective-C / Swift iOS Chart library. SciChart will be able to support fast, realtime scientific, medical and financial 2D & 3D charts on the Mac OSX platform!
The new SciChart Store has now been launched, and can be viewed at scichart.com/buy-now. You can buy online with credit card and our automated system will issue licenses immediately. For enterprise sales and purchase orders, please contact us and we will be glad to help!
We are pleased to announce that the SciChart WPF v6.2.0, build 13254has now been released! This update includes a number of bug fixes reported by users since version 6.1.1. This release is a drop-in replacement for 6.x and it is recommended for all users to update.
What’s New in SciChart v6.2.0?
1. Addressed the Startup time of SciChart WPF.
Version 6.2.0 will now be up to 28x faster to initialize and show the first chart than v6.1.x. This improvement will be seen immediately and no changes to your code are required.
The time to initialise the first chart was due to initialisation of native libraries, licensing and the 3D engine. This has been significantly streamlined and
2. Addressed compatibility with older GPUs and multi-GPU PCs.
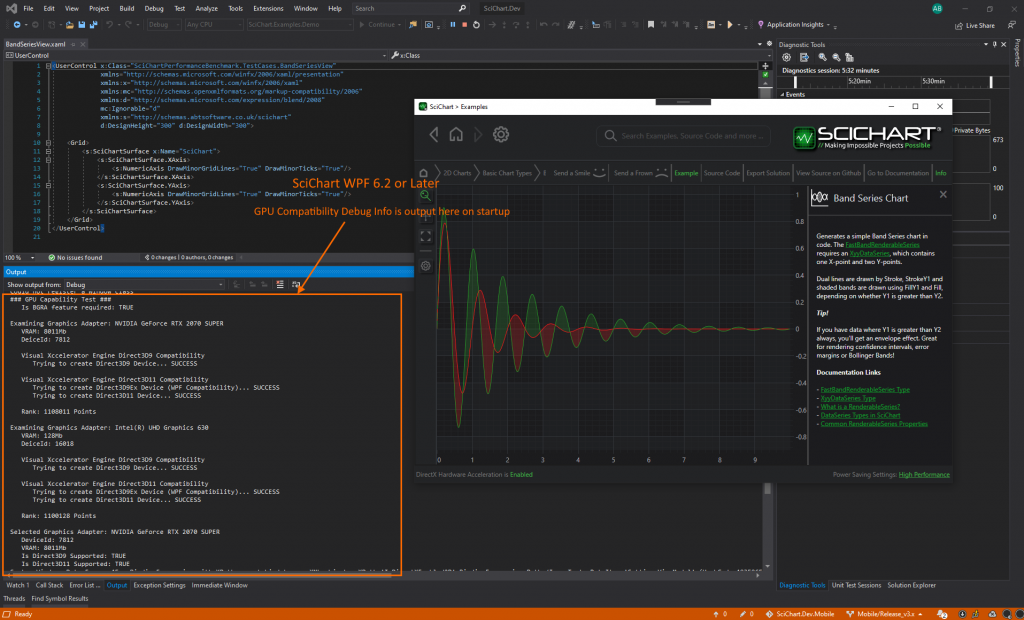
We’ve introduced a compatibility check on engine startup, and for multi-GPU PCs, SciChart will now choose the best available GPU. This solves a lot of problems and will improve performance on many of our users computers. Check the Visual Studio Output window after startup as we now log the compatibility check there!
We have identified Intel HD 4000 Series GPUs as having not enough Video RAM (VRAM) or features to correctly use SciChart’s Visual Xccelerator Engine in DirectX11 mode. We have added a check to downgrade to DirectX9 mode which uses less VRAM, or to choose a better GPU where one is available. This was a huge piece of work by our team which involved testing on multiple combinations of graphics hardware to ensure maximum stability and performance on end-user computers.
The Gpu Compatibility Test in SciChart WPF v6.2 checks for compatible GPUs on startup and adjusts engine parameters automatically. This solves problems and improves performance with dual-GPU PCs, and resolves compatibility issues on some older GPUs
3. Improved the placement of labels in Perspective and Orthogonal 3D Charts
Label Placement has now been improved so that labels no longer overlap. This was a feature-request on our feedback portal and we’re pleased to announce its been delivered!
4. Created a Vital Signs Monitor demo
We’ve created a Vital Signs Monitor demo for SciChart WPF, to mirror the demo we have created for our iOS & Android charts. This can be seen in the short video below.
Bug Fixes and Minor Improvements
SC-5376 Zooming In stops at some zoom level in SciChart v6.1.1.13117 and newer
SC-5391 Disable compression/encryption of associated C++ dlls that package with SciChart. Sacrifices some disk space on NuGet packages for initialisation speed. Init speed now improved by up to 28x faster resulting in faster application startup time
SC-5383 2D examples freeze on Intel 4600 series GPUs
SC-5380 Chart freezes after executing ZoomExtentsModifier action when VisualXcceleratorEngine.EnableImpossibleMode is set to “true” and .NET Core is used
SC-5375 Zooming XAxis freezes when MouseWheelZoomModifier is used with CategoryNumericAxis as XAxis
SC-5373 Win32Exception: The system cannot find the file specified. when clicking links in .NET Core Examples suite.
SC-5005 TickLabels overlap the 3D Chart in Orthogonal ProjectionMode
SC-5379 Place Axis Title dynamically in 3D to avoid overlapping with labels
SC-5187 TickLabels overlap on ZAxis – SurfaceMeshRenderableSeries3D
SC-5403 Use High Quality Renderer – cannot zoom all 4 charts together
SC-5408 Fixed opacity slider in Real-Time 3D Surface Mesh example
SC-5385 Created Vital Signs Monitor demo (WPF examples)
SC-5395 Overriden methods inherited from ViewportManager3DBase are never called
SC-5399 System.NullReferenceException appears when one of multiple PointMarker3D is being chosen
SC-5407 Fixed PartialResampling issue for FIFO buffer when appending one by one
SC-5383 2D examples freeze on Intel 4600
SC3D-483 “Simple Scatter Chart 3D” – EllipsePointMarker3D is drawn with wrong Fill color and for many other serieses which uses PointMarkers
SC-5400 Trading Annotations are not displayed on SciChartSurface when using multiple YAxes plus fixed styles and bindings for Trading Annotations example
SC-5422 Setting PointMarker3D in XAML doesn’t work with Impulse3D series
SC-5416 RenderableSeries.TickSize property is ignored for MarketProfileRenderableSeriesViewModel
SC-5417 Cannot select multiple negative value columns with DataPointSelectionModifier
SC-5404 “3D Orthogonal Chart” issues with axis labels
SC-5431 DashboardStyleCharts example crashes when Fill/Stroke PaletteProvider is attached (VXEngine)
SC-5430 LineRenderableSeries with StrokeThickness=0 becomes dashed when VXEngine is enabled
SC-5414 AccessViolationException when using scatter chart and XAxis.VisibleRange.Max = 1E15
SC-5421 Fixed incorrect aggregation of Y values in Renko filter
SC-5419 Fixed incorrect hit-test on PointLineRenderableSeries3D
SC-5406 3D Axis Labels – edge labels from different axes always overlap
SC-5410 Fixed an issue when RenderSeries would be exported without implicit styles
SC-5436 Improvements for exporting HeatmapColorMap properly
Added Min VRAM test for D3D11 Sub-system before initializing SciChart Visual Xccelerator Engine.
SC-5445 AxisLabels rotate when SciChartSurface3D is turned upside down
Added EnabledHighPrecisionTicks property to LogarithmicNumericAxisVIewModel
Added properties to include/exclude Rollover, TooltipModifier, SeriesSelection, SeriesValue and DataPointSelection Modifier to BaseRenderableSeriesViewModel.
Added FormattedZValue property to HeatmapSeriesInfo for more convenience
Fixed exceptions and binding errors on SciChart.Examples.Demo startup
Using Install-Package or Update-Package from NuGet.
By cloning or downloading the source code on Github (source code customers only).
Please ensure you uninstall the previous version(s) of SciChart before installing the latest version as this can prevent some issues in the upgrade process!
Pricing and Licensing
SciChart WPF v6.2 will be free of charge to customers with an active Support-Subscription.
For new customers, please find our pricing at our store page.
If your support has expired and you would like to get access to the improvements & fixes in this release, contact-sales and we will prepare you a renewal quote.
I wanted to give you a roadmap progress update as to what we are building, and give you some possible release dates for exciting enhancements to the SciChart product lineup.
2020 has been so far an absolutely crazy year … I’m sure many people have experienced disruption, crisis and some may even have lost loved ones, and we are no exceptions. However, near the start of the year we made the concerted decision to batten down the hatches and ride out the storms that the world is facing. As a result, we turned our attention to R&D, as these storms will pass, and when they do, we wanted to have new features, products and enhancements ready to go for our customer base.
I’d like to give you a short update on what we are developing now, and some progress at this mid-point through the year.
SciChart.js Javascript 2D/3D Charts Update
SciChart.js is a Fast Real-time Javascript 2D/3D Chart component. We launched our 3D engine earlier in the year on our Windows platform – known as Visual Xccelerator, it speeded our WPF Charts (Windows) by 10-100x resulting in insane performance such as our 10 Billion Datapoint tech demo. Using cutting-edge technology, we are the first in the world to develop an in-house, lightweight, cross-platform 3D graphics (game) engine and cross-compile it to all platforms including Windows, iOS, Android, MacOSX and now the web – with WebAssembly and WebGL.
WebAssembly represents a step-change for browser applications, as far from using only Javascript, which can be a performance bottleneck for critical sections of code, we are able to re-use our extensive C++ codebase and compile to WebAssembly (wasm) and use this in Javascript applications. SciChart.js will represent the absolute cutting-edge in Javascript 2D/3D charting, as no other chart library vendors in the world are currently developing the kinds of innovations that we are.
You can watch the video below to see our progress so far and how we’re coming along with this exciting new platform.
Our progress to date includes:
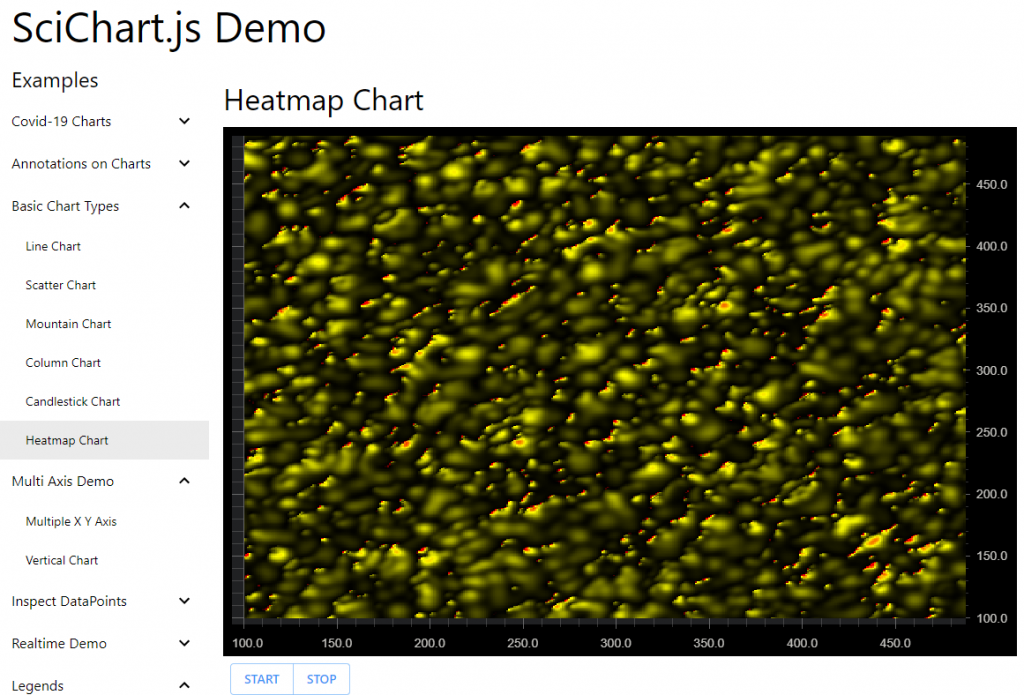
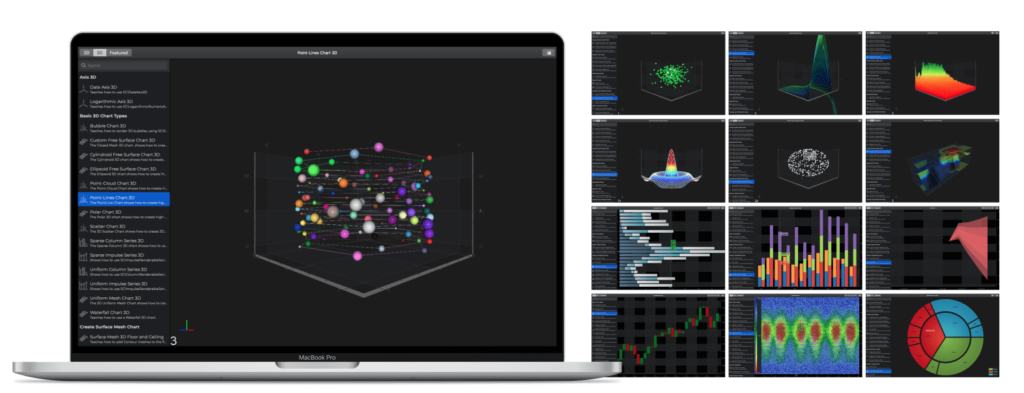
2D Javascript Chart types such as Line, Mountain/Area, Column, Scatter, Candlestick, Ohlc and Heatmap charts
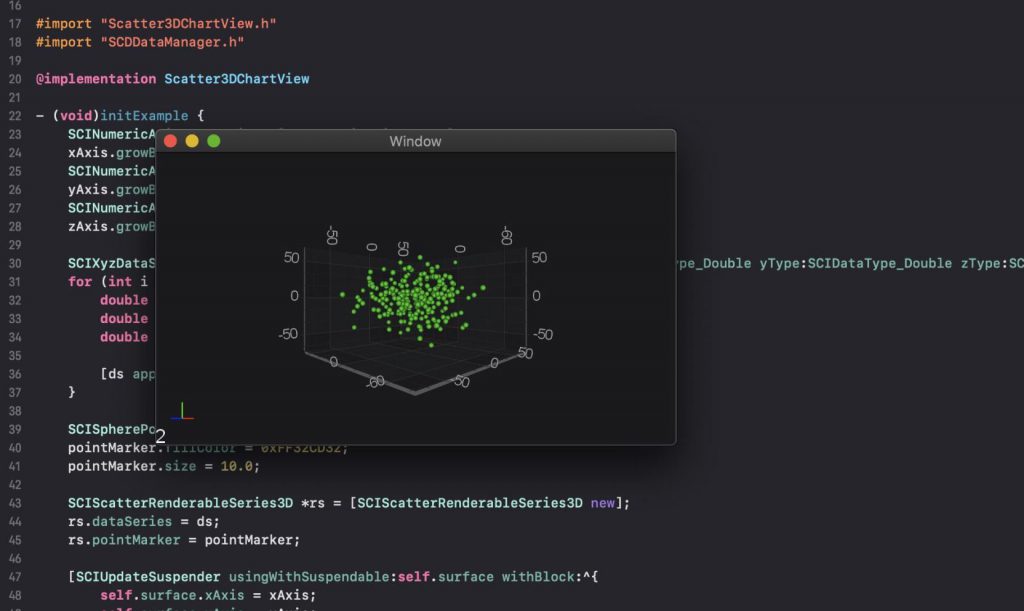
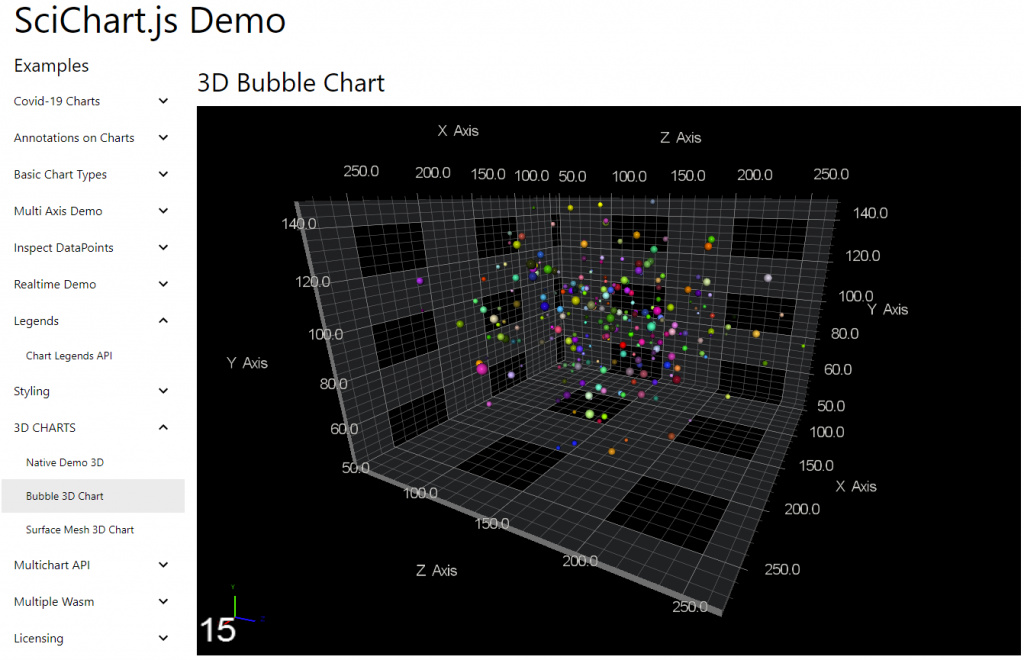
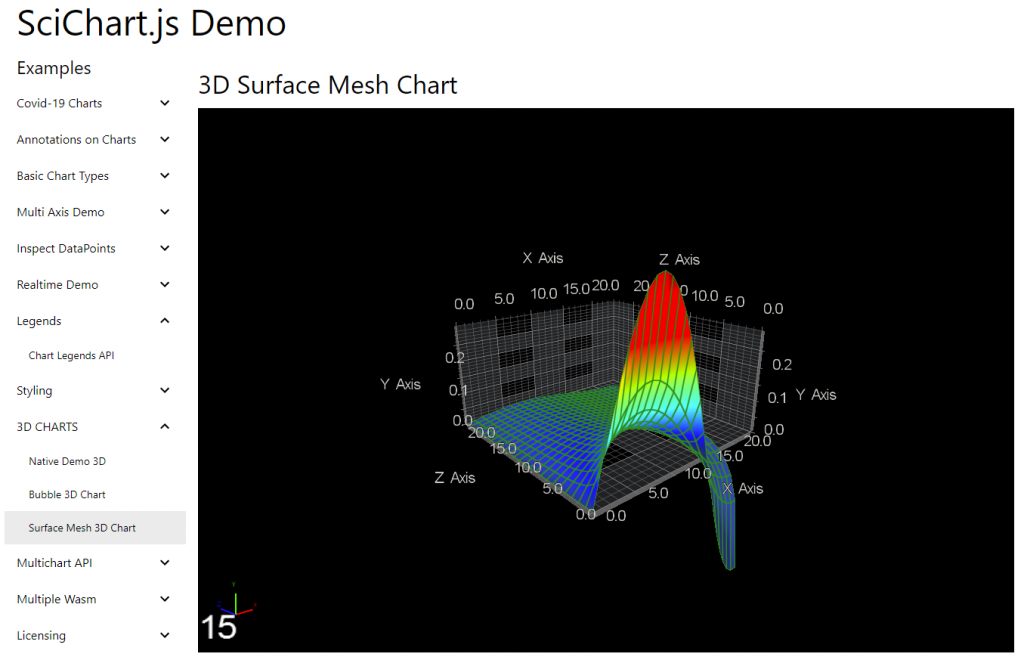
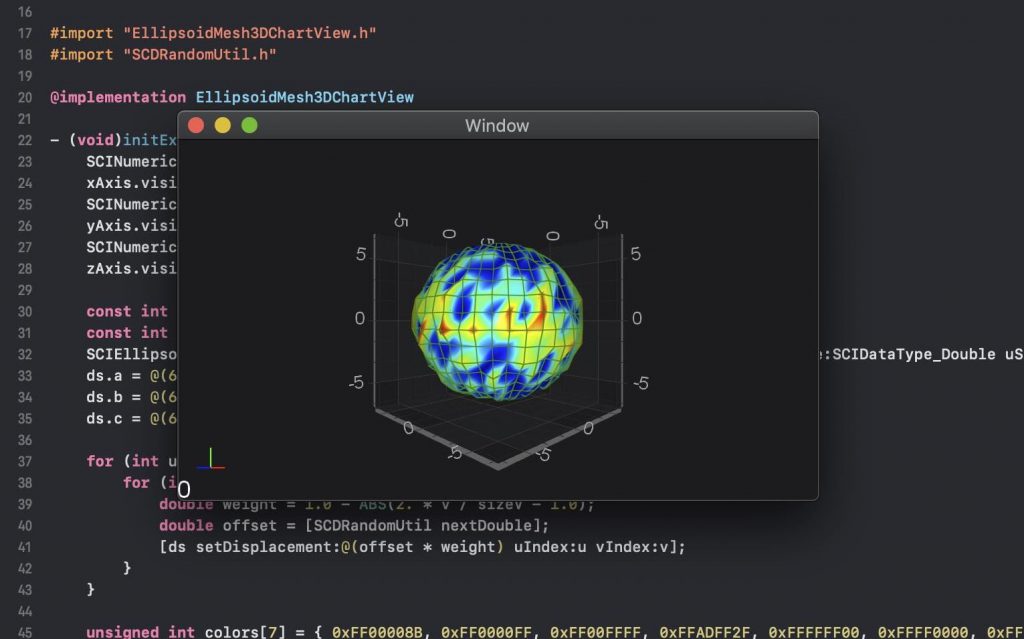
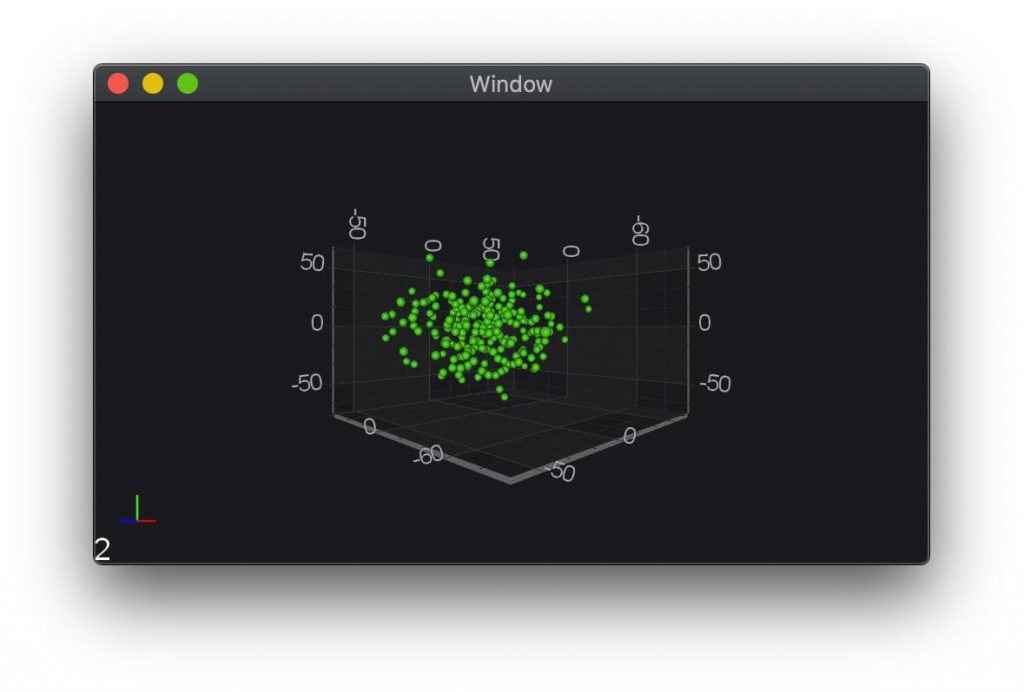
3D Javascript Chart types such as Javascript 3D Bubble charts, 3D Scatter charts, point-clouds and Javascript Surface Mesh / Surface Plot
Simple tooltips and legends
Zooming, panning
Linking multiple charts
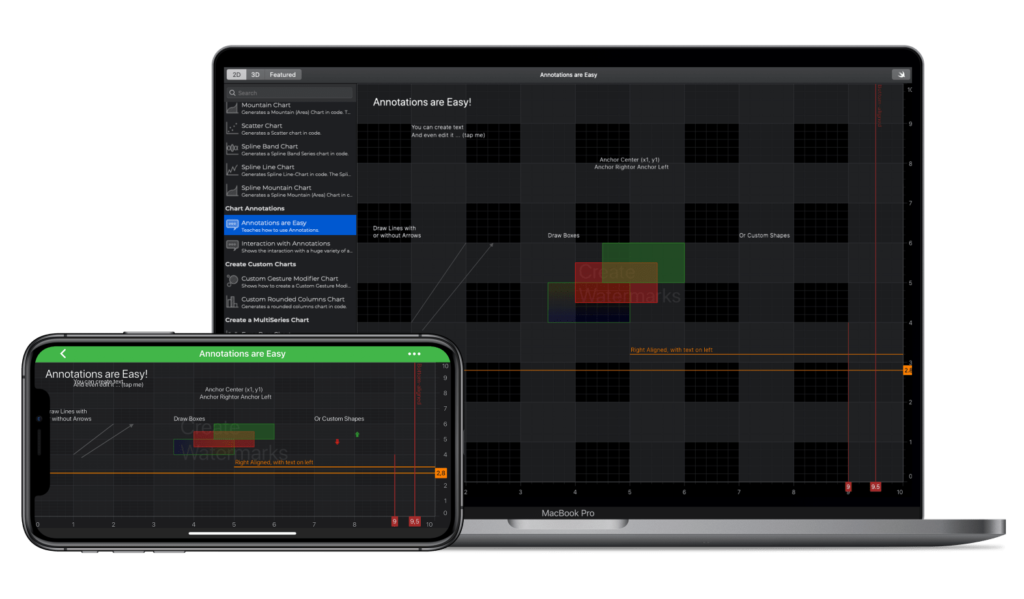
Basic annotations including line, box, text and custom annotations
Theming including 2 themes (light and dark) out of the box
Full hardware acceleration allowing millions of data-points to be drawn
GPU Shader effects for enhanced visuals: glow, shadow, gradient brush
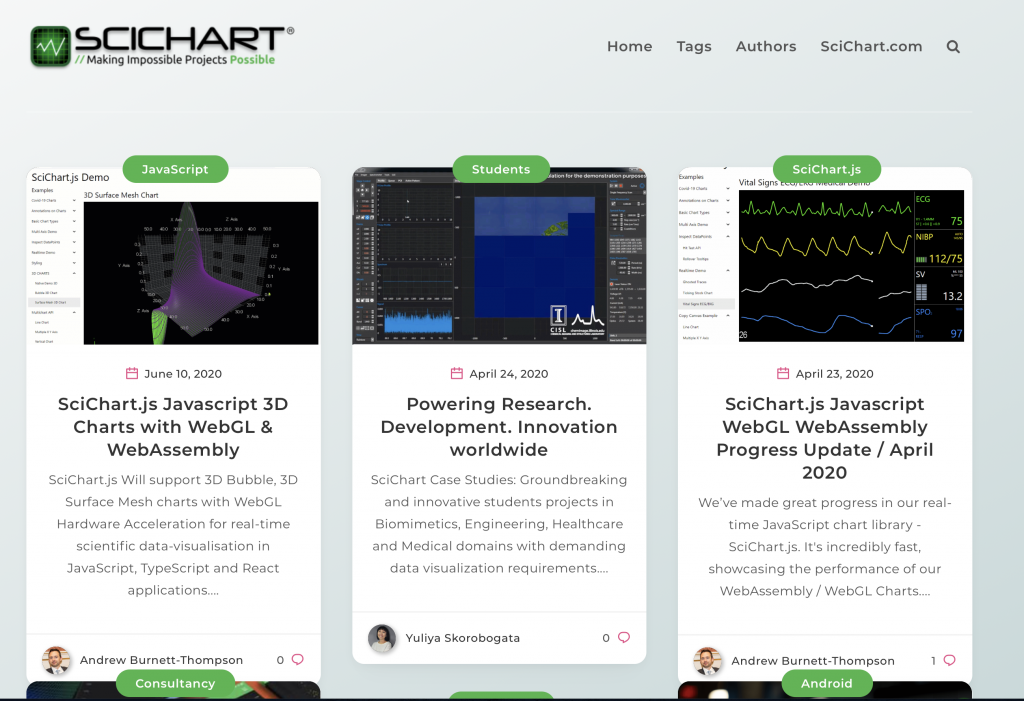
You can learn more about our progress and sign-up for newsletters over at the NEW SciChart Blog.
The SciChart Blog at https://blog.scichart.com contains information about our cutting-edge research & development such as SciChart.js, innovations by our users and more
We’re making steady progress here and aiming to have something to release to our user base as soon as possible. Obviously, we have to make sure it’s a quality product and not something half-thought out so until we have something that we don’t think is going to change much we will wait.
SciChart for Mac OSX Progress Update
Another platform we’ve been building for is Mac OSX Desktop. Our Fast, Native iOS chart library is written in Objective-C and Swift, and allows you to create big-data, real-time data visualisations on iPhone and iPad devices. However, a feature request we are often asked about is MacOS.
90% of the code is portable immediately, no change, however it’s that last 10% that needs work. The zooming, panning interaction on an iPhone is via touchscreen whereas on a Mac it’s mouse or touchpad gestures. Annotations or labels which are drawn with UIView on iOS are not portable to MacOS. So we’ve been refactoring and working steadily and aim to bring you something soon.
When go-live, the SciChart Mac OSX platform will bring you fast, hardware-accelerated 2D/3D charts on the Mac desktop platform and will be available in the Bundle 2D, Bundle SDK and Bundle SDK Enterprise packages.
SciChart for Xamarin Forms
With our iOS/Android charts v3 released at the start of this year, bringing you hardware accelerated 2D & 3D charts to the iOS & Android platforms, we have turned our attentions on how best to expand the reach of SciChart and enable our users to build applications in different kinds of frameworks.
One framework which gets requested a lot is Xamarin Forms. At the moment we support Xamarin.iOS, Xamarin.Android which allows you to create Xamarin applications with SciChart. However a true Xamarin Forms wrapper (allowing write-once run anywhere) is missing from the SciChart product lineup.
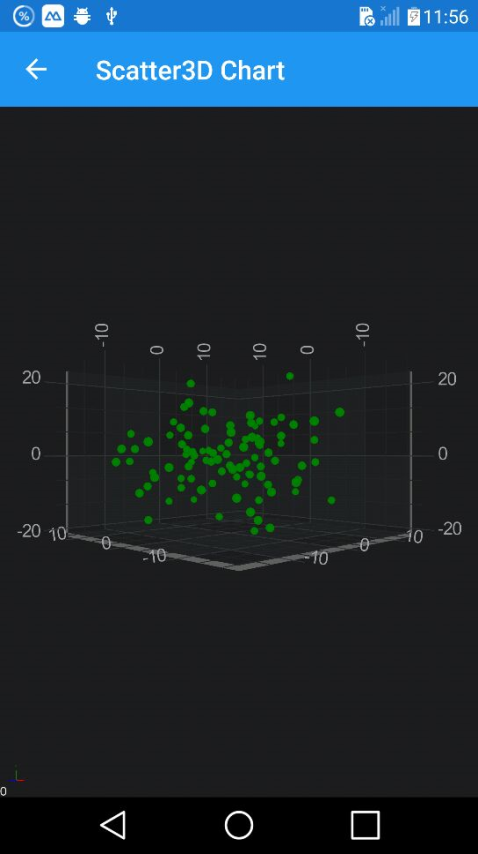
Xamarin 3D Scatter Charts
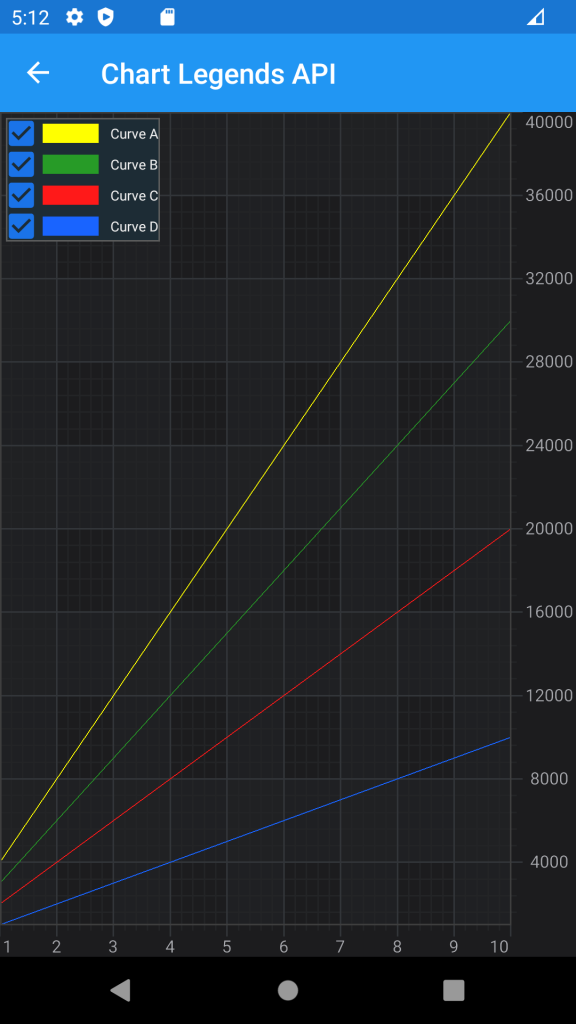
Xamarin Legends and Line Charts
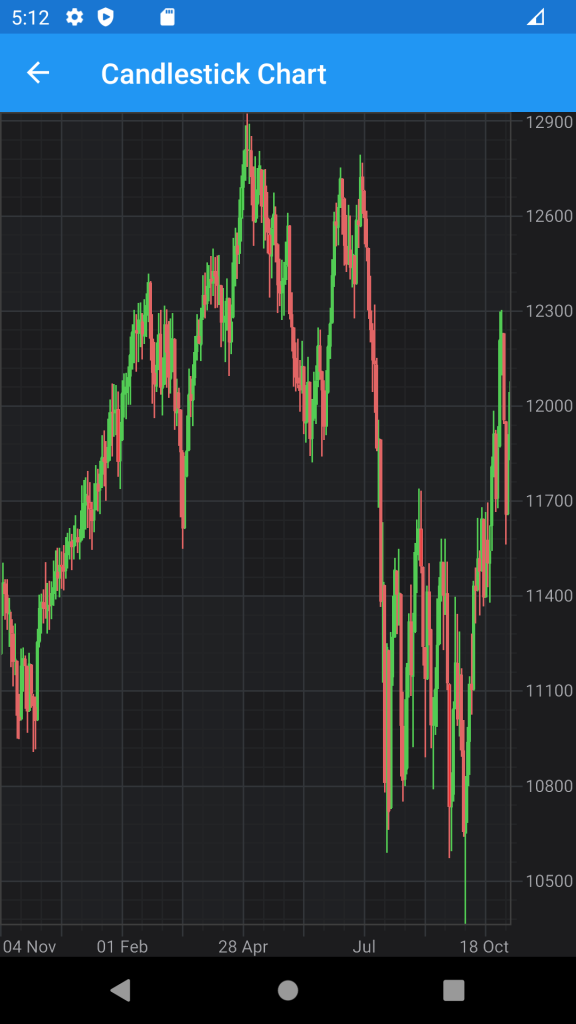
Xamarin Candlestick Chart
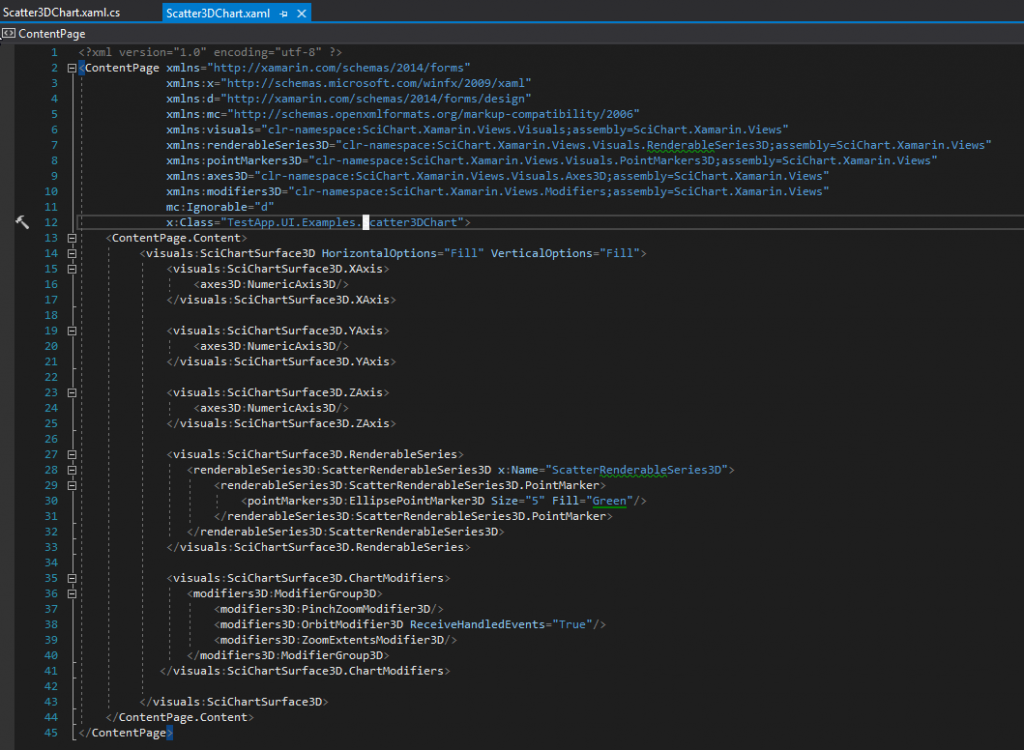
We’ve made some progress in this area by writing a wrapper generator around our Xamarin.iOS/Android chart libraries. This generates the necessary Custom Renderers or Views and XAML API allowing you to include SciChart in Xamarin Forms applications, with familiar XAML based code like this:
SciChart Xamarin.Forms will support XAML, databinding and has a familiar API to develop mobile applications with Xamarin.Forms
Roadmaps and Release Timeline
We don’t typically like to give you a release date before things are ready, as there is often work to be done polishing code or making something production-ready long after it looks or feels finished.
Right now SciChart for Javascript, Mac OSX and Xamarin Forms are all making great progress, what we’re aiming for is Q3/Q4 release, although previews or some platforms may be sooner than that. If you are interested to receive notifications or updates then you can sign-up to our SciChart.js newsletter below, or just watch our social media pages such as LinkedIn, Twitter and Facebook as all announcements go there.
Finally if you’d like to speak to us to talk about your requirements or get more in-depth information, then contact-us! We’re always happy to hear from our customers & prospects to hear how we can better serve you.
We are pleased to announce that the SciChart WPF v6.2.1, build 13303 has now been released! This update includes a number of bug fixes and minor enhancements requested by users since version 6.2.x. This release is a drop-in replacement for 6.x and it is recommended for all users to update.
What’s New in SciChart v6.2.1?
New Examples & Demos
Added the Lidar Demo to the Examples Suite. We created a blog post over at blog.scichart.com to show how to load Lidar data from the UK Defra Survey into SciChart, and visualize as a point-cloud and contour map. This example is now available in the SciChart WPF Examples Suite.
We also added a Webinar titled Algo Trading with SciChart WPF. We built an in-house Algorithmic Trading framework which lets you connect to a Crypto exchange (Bitmex, Binance) and execute algorithmic trades, as well as perform tick-by-tick backtests of your trading strategies, all visualised with SciChart WPF.
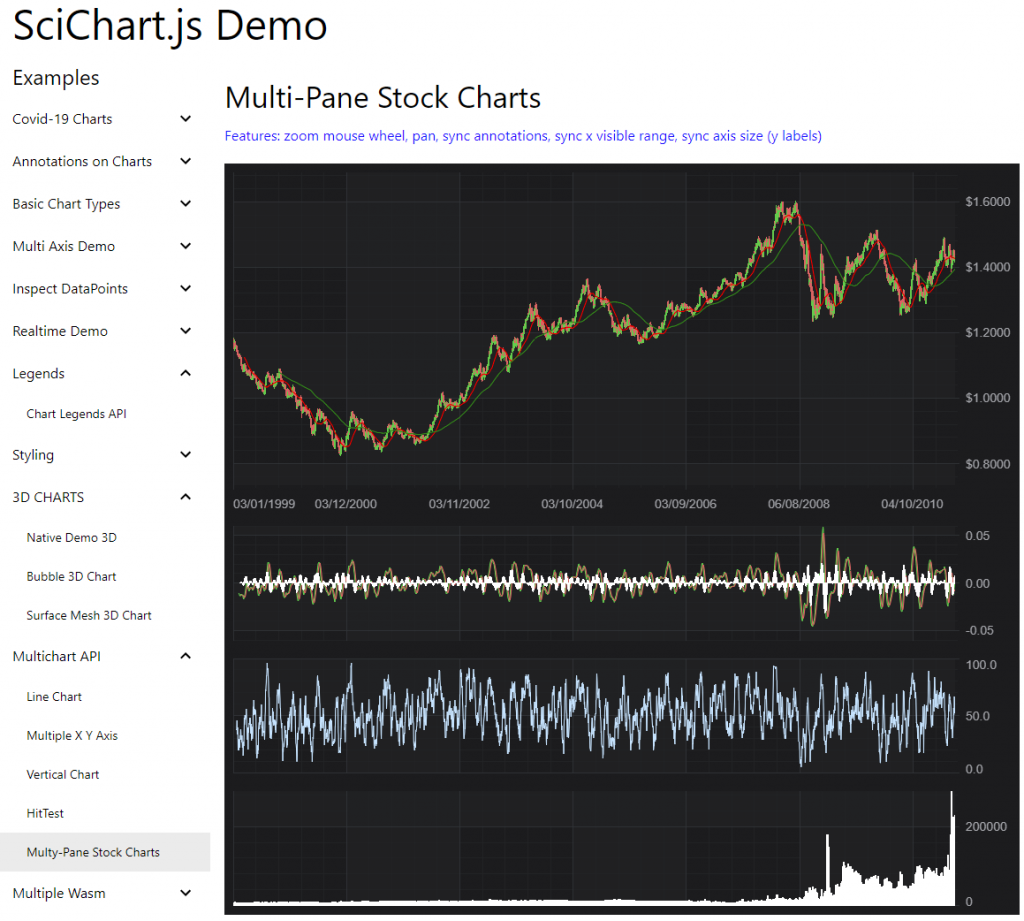
If you’d like to know how SciChart can be used in the most demanding markets, with complex data-visualization (buy/sell markers on chart, multi-pane charts, different scaling per series, different indicator or filters on a chart, custom interaction behaviours) then take a look.
IMPORTANT ISSUES FIXED in 6.2.1
The following issues are considered critical and we recommend customers update to avoid them from impacting your applications or development work.
Fixed an issue where users of Multi-GPU PCs incorrectly dropped down to software rendering when auto-detecting GPU support for our DirectX Visual Xccelerator Engine.
SC-5484 Fixed an issue where some customers could not activate a paid SciChart WPF License. This required an update in SciChart WPF as well as the Licensing Wizard.
SC-5485 Fixed a bug where EnableImpossibleMode is True and the first two data-points have the same X-value results in hang & infinite loop.
SC-5480 Fixed a bug where EnableImpossibleMode is True and chart has a few datapoints results in chart not updating
Made VisualXcceleratorEngine.DowngradeWithoutException true by default. Ensure IsEnabledChanged processed after other dependency properties. This resolves issues where on some computers a compatibility exception is thrown.
SC-5463 Fixed memory leak when AnnotationBinding is used and bound ObservableCollection changes reference
SC-5463 improved fix for ‘MVVM Annotations memory leak’ by using CollectionChangedEventManager weak events
SC-5465 Fixed the issue when RadarSurface would throw and exception when axes collection was bound
SC-5458 Fixed ArgumentOutOfRangeException when deselecting RenderableSeriesViewModel
Fixed LinearTrend and PolynomialTrend Filters are crashing when data in unsorted
Minor Issues fixed in 6.2.1
SC-5440 Fixed incorrect rendering of SurfaceMesh2D when VisibleRange is set manually
SC-5471 TooltipModifier3D stops working after SurfaceMeshRenderableSeries3D change
SC-5463 Ensure VerticalSliceModifier.VerticalLines are created and updated when VerticalLinesBinding MVVM API is used.
SC3D-488 Last point in Scatter3D series doesn’t obey Metadata color
Fixed showing getting-started page whenever the Visual Studio Package Manager Console window was opened after installing SciChart from NuGet.
Using Install-Package or Update-Package from NuGet.
By cloning or downloading the source code on Github (source code customers only).
Please ensure you uninstall the previous version(s) of SciChart before installing the latest version as this can prevent some issues in the upgrade process!
Pricing and Licensing
SciChart WPF v6.2.1 will be free of charge to customers with an active Support-Subscription.
For new customers, please find our pricing at our store page.
If your support has expired and you would like to get access to the improvements & fixes in this release, contact-sales and we will prepare you a renewal quote.
As of August 3rd, 2020 we are going to change the retention policy of Cocoapods nightly build. Please read on to secure your previously integrated SciChart packages and set up future feeds correctly into your build system.
SciChart iOS is available via CocoaPods. We provide public Podspecs so that you can integrate SciChart with minimum effort, either pinning to a specific version or always getting the latest stable release.
Over the years we have built up quite a library of nightly builds and official releases for versions 2 and 3 of SciChart iOS. Instead of keeping these all together in one feed, we are working to put it all in order. We are organizing our feeds so that there is a feed for official releases and another one for the nightly builds. This is to help our customers to use the version they want and keep it well organized.
Nightly builds:
Important: From the August 3rd, 2020 onward, all the nightly builds for version 2 will be removed. Please secure your builds if needed before the change.
Official releases, including official releases of versions prior to version 3 will be kept indefinitely.
If you are using a nightly build we recommend using the latest (higher) official release as soon as possible. A list of official releases version numbers can be found at www.scichart.com/downloads in the right-hand column, please see below:
If you have any questions about how to ensure that your SciChart integration is seamless, please just contact us at support [at] scichart.com.
We are continuing to develop & support SciChart iOS and have some exciting new releases due soon. More to be announced in the near future!
We’re starting work on building some video courses and tutorials on SciChart across platforms: WPF, iOS, Android and JavaScript. The problem is … the SciChart library is huge!
Where do we start?
We thought about creating a set of video courses that matched the documentation but it would be very long, and possibly not very valuable.
We’d like to hear from you on what you would like to learn and how we could craft our courses to best serve you.
Tell us what you’d like to learn
Reply to one of the posts below on our Twitter or LinkedIn page to tell us what you’d like to see in video courses for SciChart!
Twitter Users
Head over to twitter.com/scichart and answer the questions about video courses on this tweet (image below):
We are pleased to announce that the SciChart iOS and Android v3.1.1, has now been released! There is a large number of improvements and bug fixes made in SciChart iOS and Android v3.1.1. It is recommended for all users of SciChart to update to the latest version! Please see more information below.
What’s New?
A full list of what’s new can be found below.
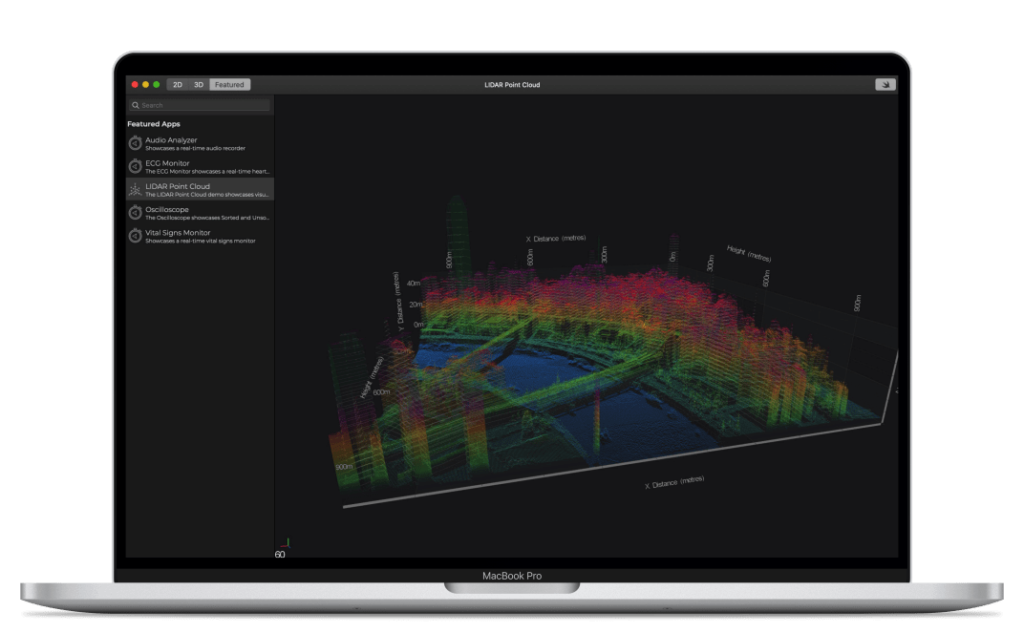
iOS/Android LIDAR Demo Example
We ported the LiDAR / GIS Point-cloud and contour topology dataset into our iOS and Android demo app, which resulted in a visualization of a 3D point cloud with a color map.
LiDAR data can be collected from a variety of sources: UAV drones (Unmanned Aerial Vehicles), self-driving cars, geological survey tools and more.
It can be used in a variety of scenarios: anything from defense/tactical operations to geological surveys such as energy/mining, geospatial analysis, civil engineering, construction, and more.
SCIOS-1010: fixed column drawing with StrokePaletteProvider
SCIOS-1007: fixed drawing dash lines in drawable behaviours
SCIOS-1008: fixed usage of ISCIStrokePaint methods to draw drawable behaviours and point markers
SC_DROID-778: fixed infinite loop in bezier curve interpolator when data is unsorted in x-direction
SCIOS-1006: fixed AxisMarker and AxisLabel annotation has the incorrect position and dragging in VerticallyStackedYAxes example
SC_DROID-776: fixed resizing annotations with restriction for resizing direction for iOS and Android
SC_DROID-776: changed implementation of ResizingAction to resize annotations relative to the position of resizing grip instead of touchpoint; changed resizing indices for annotation to encode what properties were used to get positions as well as added method for getting resizing grip position based on index
SCIOS-1002: fixed checking if coordinates are sorted
SC_DROID-612: fixed incorrect hit test results if xAxis has flipped coordinates – added isCoordinatesSortedAscending flag for render pass data for iOS and Android
SCIOS-1001: Memory leaks in SCIRenderableSeriesBase strokeStyleProperty and SCIProjectionCollection
Fixed crash of spline series in iOS when they are only one point in data series; removed throwing of exception in Android in the same case
Fixed axis labels reversed drawing on old iOS devices
SCIOS-999: fixed wrong indexes calculation for tooltips
Fixed exception when trying to animate series which isn’t attached to the chart
Fixed dataPointWidth changing in ErrorBarsChart example
SC_DROID-768: fixed crash on C++ side if disable drawing on 3D axis
SCIOS-991: fixed not drawing SCIColumnRenderableSeries3D
SCIOS-986: fixed the set args.isInSourceBound – so it is the same as in SciChart Android
SC_DROID-764: refactored ISuspendable and UpdateSuspender to remove static Map with ISuspendables which could lead to memory leak chart as well as added disposing of cached xAxis and yAxis when detaching series from chart.
SC_DROID-763: fixed incorrect calculations of zIndex in NearestUniformHeatmapPointProvider caused by using incorrect startX/startY value
SCIOS-978: fixed Surface3d doesn’t unsuspend
SCIOS-982: Fixed drawing custom annotations over axes.
SC_DROID-762: fixed missing dashed lines which occurred if there were no AA lines rendered before
SCIOS-980: fixed annotation label background missing if the placement is not axis
SCIOS-976 and SC_DROID-757: modified culling algorithm to correctly handle default culling priority (-1) when ticks aren’t combined into groups; added protected methods to override axis rendering without creation custom renderers and fixed missing renderable series layer when rendering grid lines for iOS and Android
Check out this Quickest of the QuickStart Guide below which shows you how to open the Examples Suite, work through the tutorials and see what SciChart can do.
1. Starting a SciChart iOS and /or macOS Trial
In previous versions of SciChart iOS, you could download the framework from Cocoapods or our website and it would ‘just work’ for 30 days. With the release of SciChart iOS v3 we have introduced a new cross-platform licensing mechanism which is common to all our platforms.
1. Donwload the Licensing Wizard
To get started, download and install the SciChart Cross Platform Licensing Wizard to your Mac Desktop.
Next log in using your SciChart.com username and password (Create one).
3. Start a Trial
Click ‘Start Trial’ on the Trials page for iOS and or macOS.
4. Apply a trial Key
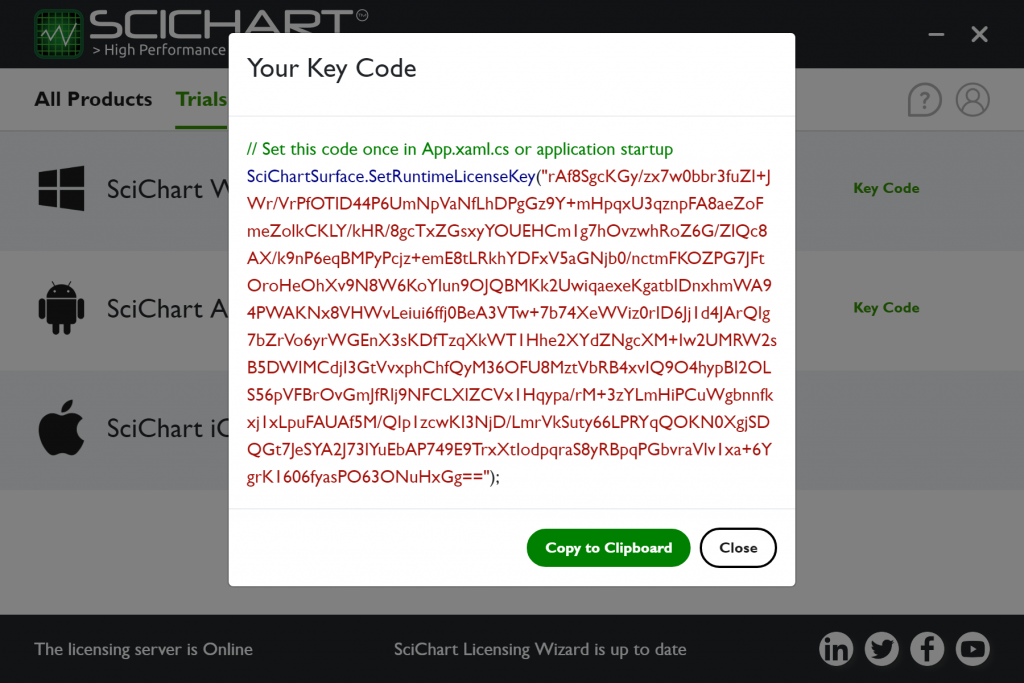
Apply the trial to your application by viewing the KeyCode on the Licensing Wizard. Be careful and use iOS one for iOS trial and macOS one for Mac.
The KeyCode must be set in your app once, and once onlybefore any SciChartSurface instance is shown. Do this by calling the static SciChartSurface.SetRuntimeLicenseKey() method in AppDelegate.
//
//  AppDelegate.swift
//  SciChartSwiftDemo
//

import UIKit
import SciChart

@UIApplicationMain

class SCSAppDelegate: UIResponder, UIApplicationDelegate {

 var window: UIWindow?

 func application(_ application: UIApplication, didFinishLaunchingWithOptions launchOptions: [UIApplicationLaunchOptionsKey: Any]?) -> Bool {

        // Note! This is just an example.
        // The real License KeyCode is found by following steps above
        SCIChartSurface.setRuntimeLicenseKey("YOUR_KEYCODE")

        return true
 }

}
//
//  AppDelegate.m
//  SciChartDemo
//

#import "AppDelegate.h"
#import "SCDConstants.h"

// NOTE: Import SciChart.h
#import <SciChart/SciChart.h>

@interface AppDelegate ()

@end

@implementation AppDelegate

- (BOOL)application:(UIApplication *)application didFinishLaunchingWithOptions:(NSDictionary *)launchOptions {

    // Note! This is just an example.
    // The real License KeyCode is found by following steps above
    [SCIChartSurface setRuntimeLicenseKey:@"YOUR_KEYCODE"];

    //...
    return YES;
}

@end
using Foundation;
using UIKit;
using SciChart;

namespace XamarinTestingLicensing
{
    // The UIApplicationDelegate for the application. This class is responsible for launching the
    // User Interface of the application, as well as listening (and optionally responding) to application events from iOS.
    [Register("AppDelegate")]
    public class AppDelegate : UIApplicationDelegate
    {
        // class-level declarations

        public override UIWindow Window
        {
            get;
            set;
        }

        public override bool FinishedLaunching(UIApplication application, NSDictionary launchOptions)
        {
            // Override point for customization after application launch.
            // If not required for your application you can safely delete this method

            SciChart.iOS.Charting.SCIChartSurface.SetRuntimeLicenseKey("YOUR_KEYCODE");

            return true;
        }
    }
}
Take a moment to start a trial now, so that you can get working as soon as possible.
Note, if you have purchased a paid license, then head over to Licensing SciChart iOS&macOS to learn how to activate and use it.
Once you’ve downloaded it, open the SciChartDemo.xcodeproj in Xcode.
You’ll need to:
Drag & drop the SciChart.Framework onto the Frameworks, Libraries and Embedded Content for SciChartDemo
Paste your license key into AppDelegate
Run the app!
This short 1-minute video shows you how to compile the SciChart iOS v3 Examples and include a license key in the app.
Note: Performance is much better on a device than in the simulator. Try SciChart iOS on an iPhone / iPad or Mac desktop to see our extreme performance 2D & 3D iOS and macOS Charts Library!
3. Creating your First SciChartSurface (Tutorials)
We now have a full set of tutorials online, to walk you through the basics of getting to know SciChart iOS. Each Tutorial has an XCode project which you can find in SciChart.iOS.Examples Github repository.
We recommend to learn SciChart quickly, get through the tutorials as soon as you can, as they will teach you a lot of techniques quickly (Creating a project, series, data, real-time updates, tooltips, zooming, panning, legends, annotations and more).
4. Ok Great! So where is the Documentation?
All of our documentation is online. Please see the following resources to help you get started.
SciChart iOS and macOS v4 Documentation at SciChart iOS SDK Documentation (Also viewable from Homepage Menu -> iOS Charts -> Documentation)
If you have a question, please try our new full site search engine (top of the page), or, dare we say it, Google! This has been custom-built to search the Forums and Knowledgebase, giving you relevant and accurate search results. There are thousands of pages on the SciChart site with content to search from, so if you have a query about SciChart iOS Tooltips, or SciChart Licensing, just try the search and you should be able to find something useful.
But if that’s not enough, you can Contact us anytime and one of our staff will get back to you. We aim to answer all requests within 1-business day.
During your trial of SciChart iOS and macOS we will gladly answer your technical questions about the chart. After the trial expires, you may purchase a support subscription to maintain access to technical support & to continue developing with SciChart
In order to license SciChart iOS v3 and later / macOS v4 and unlock all its features, there is a simple procedure that must be followed. Without this you won’t be able to compile and debug applications built with SciChart iOS&macOS. Licenses are unique to all SciChart products, so licenses for other products cannot be used for SciChart iOS or Scichart macOS Charts and vice versa. If purchased individually SciChart iOS is a separate license form SciCHart macOS!
Please be aware before starting usage of the SciChart software constitutes acceptance of the licensing terms & conditions. SciChart is licensed per-developer with a royalty-free redistribution rights for your applications. A helpful licensing FAQ can be found here.
If you wish to purchase a paid SciChart license, you can do so at the store.scichart.com. Likewise, you can download the framework at our scichart.com/downloads page.
Instructions for starting iOS Chart or macOS Trials
In SciChart iOS v3 and later and macOS v4, trial licenses can be fetched with the cross platform licensing wizard. Trial licenses and technical support are tied to a SciChart account, so if you don’t have one, then head over to scichart.com/login and create an account now.
Download the licensing wizard from here and install on your Mac desktop.
Once installed, and you have logged in with scichart.com account, you can start a trial in your chosen platform as follows:
Apply the trial to your application by viewing the KeyCode on the Licensing Wizard.
The KeyCode must be placed in your application once before any SciChartSurface is shown or instantiated, for example AppDelegate (see below).
Applying the Trial License in Your App
The KeyCode must be set in your app once, and once only before any SciChartSurface instance is shown. Do this by calling the static SciChartSurface.SetRuntimeLicenseKey() method in AppDelegate.
//
//  AppDelegate.swift
//  SciChartSwiftDemo
//

import UIKit
import SciChart

@UIApplicationMain

class SCSAppDelegate: UIResponder, UIApplicationDelegate {

 var window: UIWindow?

 func application(_ application: UIApplication, didFinishLaunchingWithOptions launchOptions: [UIApplicationLaunchOptionsKey: Any]?) -> Bool {

        // Note! This is just an example.
        // The real License KeyCode is found by following steps above
        SCIChartSurface.setRuntimeLicenseKey("YOUR_KEYCODE")

        return true
 }

}
//
//  AppDelegate.m
//  SciChartDemo
//

#import "AppDelegate.h"
#import "SCDConstants.h"

// NOTE: Import SciChart.h
#import <SciChart/SciChart.h>

@interface AppDelegate ()

@end

@implementation AppDelegate

- (BOOL)application:(UIApplication *)application didFinishLaunchingWithOptions:(NSDictionary *)launchOptions {

    // Note! This is just an example.
    // The real License KeyCode is found by following steps above
    [SCIChartSurface setRuntimeLicenseKey:@"YOUR_KEYCODE"];

    //...
    return YES;
}

@end
using Foundation;
using UIKit;
using SciChart;

namespace XamarinTestingLicensing
{
    // The UIApplicationDelegate for the application. This class is responsible for launching the
    // User Interface of the application, as well as listening (and optionally responding) to application events from iOS.
    [Register("AppDelegate")]
    public class AppDelegate : UIApplicationDelegate
    {
        // class-level declarations

        public override UIWindow Window
        {
            get;
            set;
        }

        public override bool FinishedLaunching(UIApplication application, NSDictionary launchOptions)
        {
            // Override point for customization after application launch.
            // If not required for your application you can safely delete this method

            SciChart.iOS.Charting.SCIChartSurface.SetRuntimeLicenseKey("YOUR_KEYCODE");

            return true;
        }
    }
}
Activating a Paid SciChart iOS or macOS License
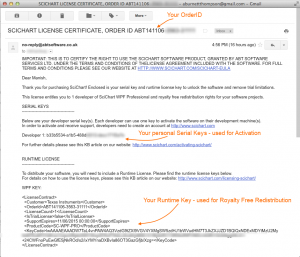
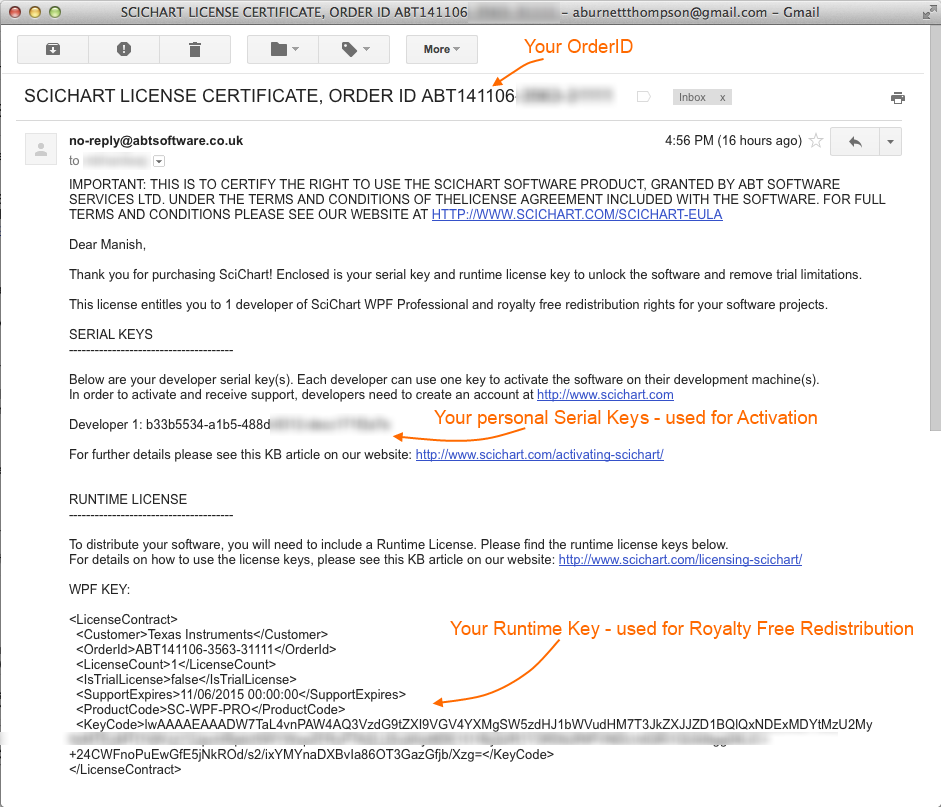
If you have purchased SciChart iOS v3 and later or macOS v4, you should have received a confirmation e-mail with a Developer Serial key and Runtime key. You can also view purchased license keys and serials in your Profile Page. If you don’t have one, please contact SciChart Sales.
SciChart Licensing Email Example
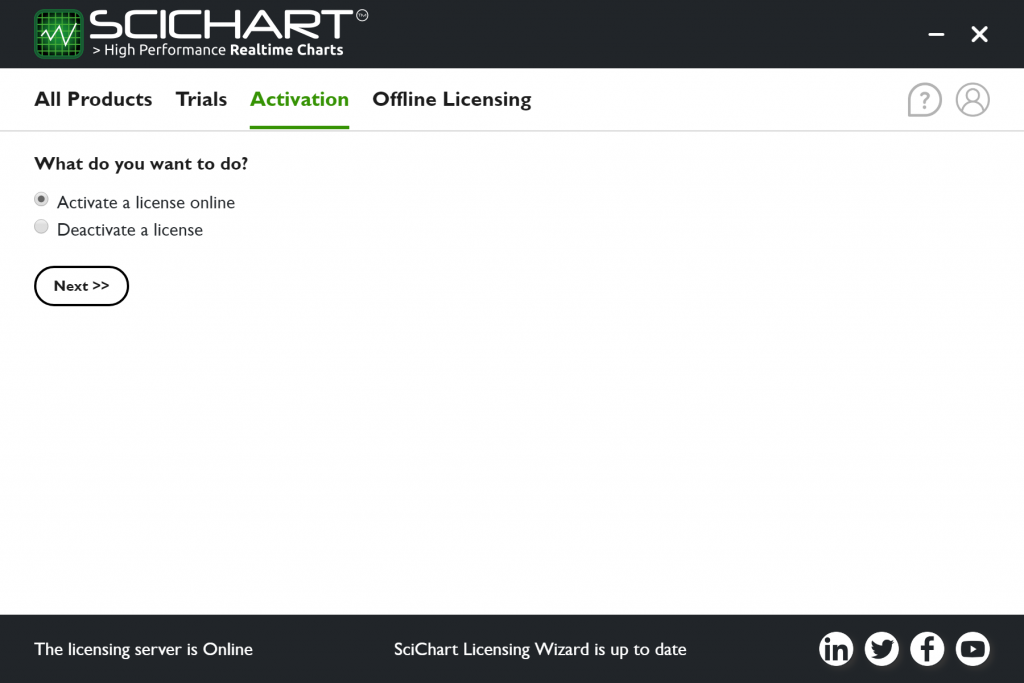
To activate the license so that you can receive Technical Support, download the cross platform licensing wizard and install on your Mac desktop.
Once installed, and you have logged in with scichart.com account, you can activate the developer serial you received when you purchased.
After activation you will see your license status on the wizard homepage. You can click ‘Runtime key’ to show the runtime license key that you must include in your app.
The KeyCode must be placed in your application once before any SciChartSurface is shown or instantiated, for example AppDelegate (see below).
Applying the Runtime License in Your App
The KeyCode must be set in your app once, and once only before any SciChartSurface instance is shown. Do this by calling the static SciChartSurface.SetRuntimeLicenseKey() method in AppDelegate.
//
//  AppDelegate.swift
//  SciChartSwiftDemo
//

import UIKit
import SciChart

@UIApplicationMain

class SCSAppDelegate: UIResponder, UIApplicationDelegate {

 var window: UIWindow?

 func application(_ application: UIApplication, didFinishLaunchingWithOptions launchOptions: [UIApplicationLaunchOptionsKey: Any]?) -> Bool {

        // Note! This is just an example.
        // The real License KeyCode is found by following steps above
        SCIChartSurface.setRuntimeLicenseKey("YOUR_KEYCODE")

        return true
 }

}
//
//  AppDelegate.m
//  SciChartDemo
//

#import "AppDelegate.h"
#import "SCDConstants.h"

// NOTE: Import SciChart.h
#import <SciChart/SciChart.h>

@interface AppDelegate ()

@end

@implementation AppDelegate

- (BOOL)application:(UIApplication *)application didFinishLaunchingWithOptions:(NSDictionary *)launchOptions {

    // Note! This is just an example.
    // The real License KeyCode is found by following steps above
    [SCIChartSurface setRuntimeLicenseKey:@"YOUR_KEYCODE"];

    //...
    return YES;
}

@end
using Foundation;
using UIKit;
using SciChart;

namespace XamarinTestingLicensing
{
    // The UIApplicationDelegate for the application. This class is responsible for launching the
    // User Interface of the application, as well as listening (and optionally responding) to application events from iOS.
    [Register("AppDelegate")]
    public class AppDelegate : UIApplicationDelegate
    {
        // class-level declarations

        public override UIWindow Window
        {
            get;
            set;
        }

        public override bool FinishedLaunching(UIApplication application, NSDictionary launchOptions)
        {
            // Override point for customization after application launch.
            // If not required for your application you can safely delete this method

            SciChart.iOS.Charting.SCIChartSurface.SetRuntimeLicenseKey("YOUR_KEYCODE");

            return true;
        }
    }
}
Github Source Code Access
If you are a SciChart iOS Source-Code customer, you can now access the source code via our Github repository. To get access, please follow the steps below:
#1 Activate your SciChart License
You need to activate your SciChart License following the steps above ‘Activating a Paid License’.
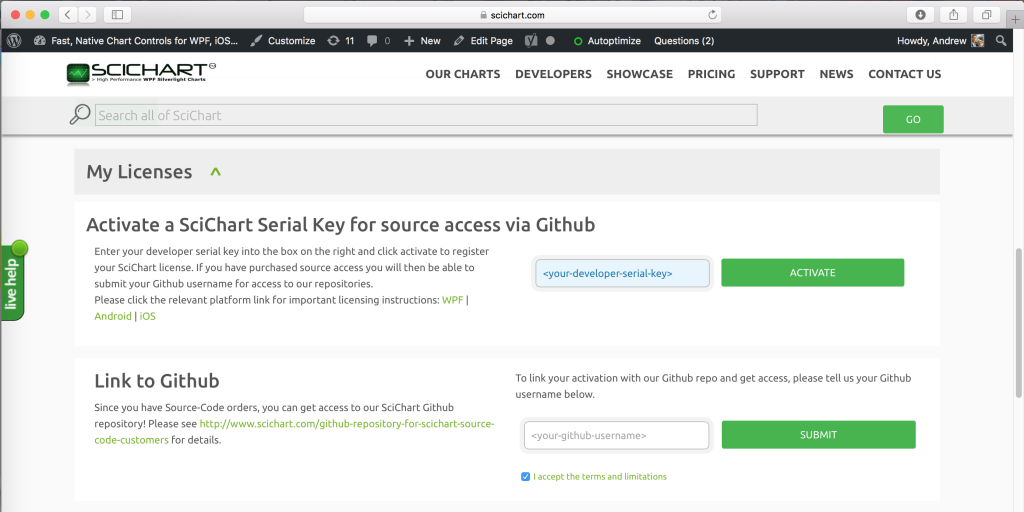
#2 Link your account to Github
Now enter your Github Username in the box directly below. If you do not have a Github account, head over to www.github.com and register.
Note: You will need to be logged in to scichart to use the profile page. Please log in at or create an account at www.scichart.com/login if you haven’t already
#3 Respond to Invitation
You will receive an email with an invitation to join the SciChart iOS Github repository! Accept the invitation to get access!
Troubleshooting
If you cannot manage to get your application working with the license applied, please check out our licensing troubleshooting steps below or contact us and we will do our best to help.
Locating License Keys
Your serial key and developer runtime key is found in your License Certificate email and also online at www.scichart.com/profile. If you do not have either, please contact-us!
View your license keys at the profile page
SciChart Licensing Email Example
Trial Expired Problems
Sometimes people report that after distributing their application, the Trial Watermark still appears, or, end users see Trial Expired.
Follow the steps below to debug this.
Check support expiry date: if your support subscription has expired, then you cannot use the latest versions of SciChart. You can check your support subscription at the profile page or in the cross platform licensing wizard. Contact sales to renew your license, as generous discounts are available if you renew promptly!
Check the Runtime License Key is set: Follow the steps above to set your Trial or Paid Runtime License key. Without this, the app will not work!
Ensure Runtime Key is set once, and once only: The SciChartSurface.SetRuntimeLicenseKey method must be called once and once only before any SciChartSurface is instantiated. The best place to do this is in AppDelegate.
Many people were eagerly anticipating the SciChart for Mac support to be released. We are pleased to announce that we have now released the SciChart mobile version 4, which includes the usual iOS and Android platforms as well as support for macOS.
Scichart library is more than the chart types. SciChart macOS platform supports a number of features out of the box, just like SciChart iOS those include:
Performance – as all SciChart platforms are powered by the Visual Xccelerator Engine, SciChart macOS provides the unmatched performance allowing you to render millions of data points in realtime.
Many axis types – including numeric axis, logarithmic numeric axis, date axis as well as category date axis. You can also have unlimited multiple X and Y axes for your charting applications on Mac.
Rich interactions – allowing you to zoom and pan the chart, drag the axis to scale. You can add a data point selection, series selection and multiple selections with the cmd button.
Annotations and markers – annotations API allows you to overlay Line, Text, Boxes, or watermarks over the chart, at specific data-point locations as well as displaying custom markers or points of interest.
Cursors and tooltips – featuring rich Chart Modifier API for cursors & tooltips out of the box, including Cursors, Crosshairs, Tooltips, or Rollovers (showing vertical lines) as well as Legends. You can style a tooltip to fit your application for Mac look and feel.
Styling and theming – SciChart’s macOS Chart Library ships with 8 stunning themes in a Theme Manager, which you can apply to your charts with a single line of code. Themes affect default cursor, zoom, axis, grid and series colors. You may customize even further and create your own custom theme, styling each part of the chart.
And there is more, SciChart for macOS allows linking multiple charts, per point coloring with the palette provider API. Have a look at all SciChart iOS and macOS features.
Featured Applications
Scichart is used around the world across sectors, to showcase what library is capable of in hands of your developers, we are creating featured applications that are a fit to different domains.
The recently added featured applications are:
Vital Signs monitor for Mac, which showcases how Scichart can be used for realtime monitoring of ECG/EKG and other vital signs in digital health solutions.
LIDAR example for Mac demonstrates how we have visualized LIDAR data with our 3D point cloud. It can be used in a variety of scenarios: anything from defense/tactical operations to geological surveys such as energy/mining, geospatialanalysis, civil engineering, construction, and more.
Audio Analyzer demo for Mac shows how SciChart can be used in a scientific context when creating an app that needs to visualize scientific data from data-acquisition devices, audio spectra, or visualize radiofrequency or spectral analysis and more.
The SciChart iOS/ macOS /Android Examples App (Swift, Java, Objective-C)
The SciChart Framework libraries
Separately you will need to download the Cross Platform Licensing Wizard, required to start a trial and activate a purchased license SciChart for Mac and Mobile SDK v3 and later.
Getting Started
We have prepared getting started pages for each platform, which you can view below.
The Scichart for Mac 2D or 2D and 3D can be purchase individually and together with the SciChart bundle from the SciChart Store. You can buy online with a credit card or pay by wire transfer and our automated system will issue licenses immediately.
For enterprise sales and purchase orders, please contact us and we will be glad to help!
Renewals and Upgrades
Existing customers with support active Bundle products will get the macOS support for free.
Hey SciChart fans! We wanted to give you an update on our progress in creating SciChart.js – Fast JavaScript 2D/3D Charts for Web applications. You can watch a 5-minute flash update in the video below. Do be sure to subscribe to our YouTube page if you want to be notified of further updates!
Barring any unforeseen circumstances, we are about a month away from a BETA. The BETA version will be shipping with an examples suite, documentation and tutorials on day 1, and will include the following features:
Extreme performance for big-data, real-time or line of business apps
PaletteProvider API for per-point colouring
Gradient line and stepped line functions
Customisable Tooltips and Legends
Linking multiple charts
Zooming and Panning behaviours
Support for multiple browsers with WebAssembly support: Safari, Opera, Firefox, Chrome, Edge including desktop and mobile browsers.
Typescript typings library with support for JavaScript ES6, TypeScript and React/Vue/Angular applications
Documentation and Help
We will also be producing a set of documentation going over the main API features, a set of tutorials which will be in code / web and video format.
Sign up to our Newsletter!
Are you interested in real-time high performance 2D & 3D Charts or creating the next generation of Javascript Charting applications? To be notified about updates of SciChart.js as we develop for this exciting new platform, sign up below:
SciChart is also available for mobile devices and now macOS, allowing extremely high performance charts on the iOS and Android Platforms. You can find out more about SciChart by visiting our website.
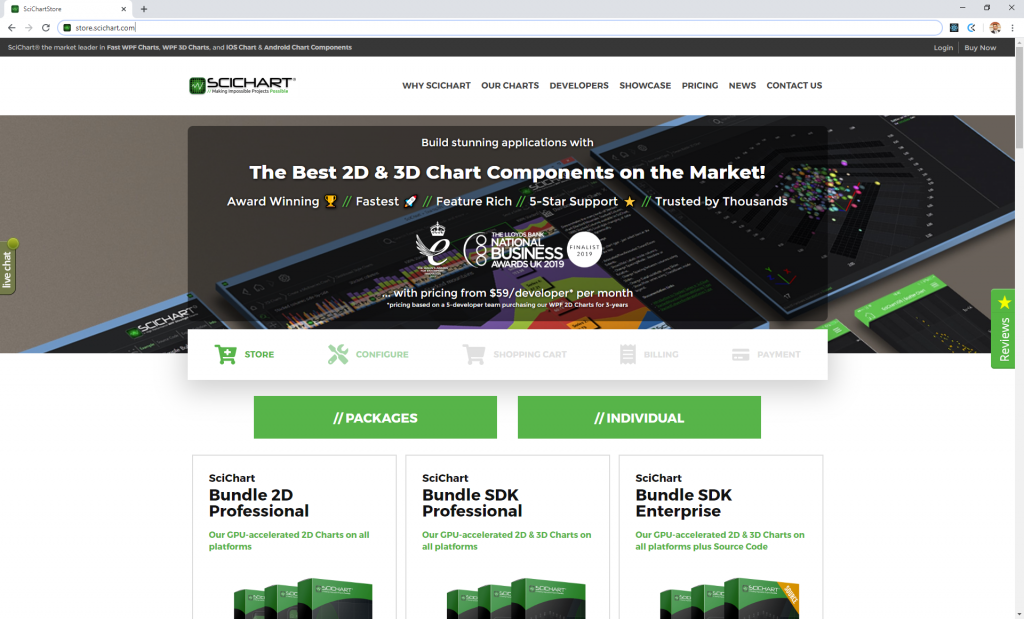
 to render this quite frankly, massive, big-data set.