We are pleased to announce that the SciChart iOS v4.1, has now been released! There is a number of improvements and bug fixes made, most importantly this version introduces the Mac Catalyst feature and Swift Package Manager support. It is recommended for all users of SciChart to update to the latest version! Please see more information below.
What’s new in SciChart iOS & macOS 4.1?
New feature: Mac Catalyst Support
With this release, we are adding the Mac Catalyst support to SciChart. Now our users can create Mac versions of their iOS applications.
New feature: Swift Package Manager Support
With this release, we are adding the Swift Package Manager support to SciChart. Starting from Swift 5.3 and XCode 12 SciChart library can now be integrated using SPM too. You can find more details here.
Bug fixes:
SCIOS-966 – fixed Multiple charts don’t work with OpenGL RenderSurface
SCIOS-1013 – fixed adding and applying a custom theme.
SCIOS-1014 – fixed Legend checkboxes don’t work on iOS
Fixed handling of some modifier surface events, such as a tap on Legend modifier;
SCIOS-1024 – fixed applying interpolation with `useInterpolation` to Rollover Line Behavior
SCIOS-1026 – fixed SCIZoomPanModifier inertia doesn’t stop on tap
Purchases and Sales
SciChart Catalyst allows you to work with your application on macOS, therefore it will require the license for SciChart macOS as well as an iOS license or a Bundle license, that you can purchase at our store online!
For enterprise sales and purchase orders, please contact us and we will be glad to help!
Renewals and Upgrades
If you are a customer with the support active iOS and macOS or a Bundle license you will have access to this release for free.
Today we have an exciting announcement to SciChart’s now multi award-winning product line-up: SciChart.js BETA!
Check out what’s available below:
SciChart.js v1.0 Beta
Our best-in-class cross-platform charting library just got better!
SciChart.js is an ultra-realtime JavaScript Chart library, suitable for mission-critical scientific, medical & financial charting applications. It is based on our multi award-winning cross-platform graphics engine, Visual Xccelerator®, and brings you the world’s first JavaScript chart control fully hardware accelerated by WebGL and WebAssembly.
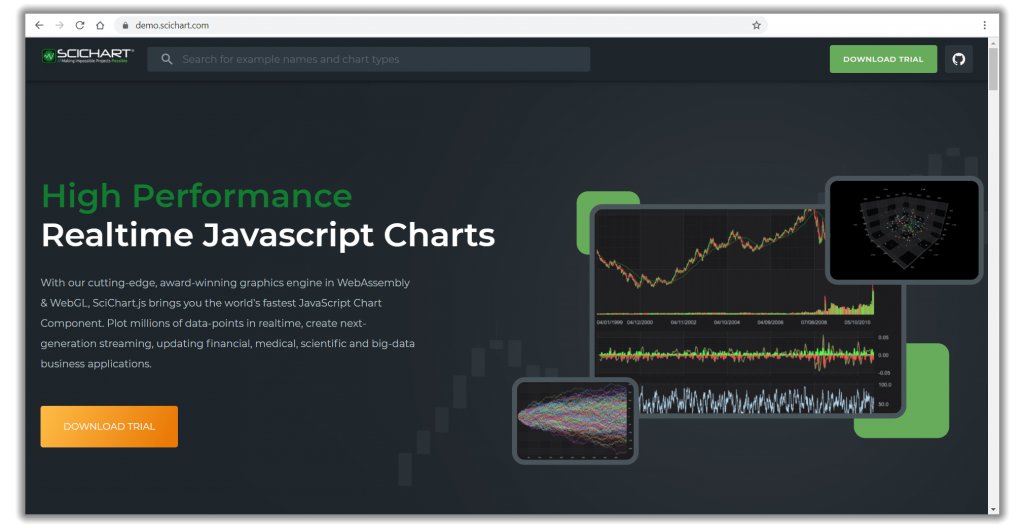
See our live demos in the SciChart.js examples suite: demo.scichart.com
We’ve taken our award-winning cross-platform graphics engine, written in C++, and compiled to WebAssembly. This gives you a consistent experience and ultra-high performance across SciChart’s platforms: WPF (Windows), iOS/macOS, Android and now Web browsers. What’s more, it means that improvements to one platform will show up in the others, increasing our code quality and reducing iteration time.
Multiple Chart Types, including
SciChart’s JavaScript Charts will have the following chart types out of the box:
For the first time you will be able to render many millions of data-points instantly with a WebAssembly/WebGL powered JavaScript Chart control. Perfect for mission-critical scientific, medical, financial charting applications migrating from native applications to JavaScript/TypeScript, for customers familiar with the SciChart ecosystem, for applications that require real-time updates, or for next-generation line of business apps that have to browse and explore big data-sets.
Tooltips and Legends
We will be supporting a handful of modifiers out of the box for showing tooltips, such as the popular CursorModifier, RolloverModifier and LegendModifier.
SciChart.js will feature JavaScript Chart annotations out of the box, giving you the ability to add Lines, Text, Shapes, Boxes or rectangles onto the chart. These will move, pan and scale with the chart, or can be positioned absolutely e.g. in the centre of the chart, or top left, bottom right etc…
The underlying technology to SciChart.js is our award-winning, cross-platform Visual Xccelerator Engine. This powers a next generation of JavaScript charts including interactive 3D Bubble Charts, 3D Point-Clouds and 3D Surface Mesh plots. Perfect for scientific applications in the browser!
SciChart.js brings you truly cutting-edge technology enabling next-generation line of business applications, and mission-critical data-visualization apps.
Pricing and Licensing
SciChart.js will be included in the Bundle 2D Pro, Bundle SDK Pro and Bundle SDK Enterprise products available on our web store. These packages include our 2D Charts, 2D/3D and 2D/3D+Source code for all our platforms (Windows, iOS, Android, Mac and JavaScript).
Customers who have purchased SciChart Bundle packages and are in-support before the release will get SciChart.js for free upon release. You can buy SciChart Bundle packages nowfrom our store and will get SciChart.js on release.
We will also be shipping SciChart.js individually as a JavaScript 2D Chart license and JavaScript 3D Chart license after the release date.
All our licenses will come with 1-year technical support & updates as standard.
Release Schedule!
We are rolling out the release note and will be adhering to the following schedule:
We’ve already launched the scichart.js Demo Application so you can see and use our JavaScript chart component in a live interactive demo.
This is a minor release of SciChart Android v4.1, has now been released! There is a number of improvements and bug fixes made. It is recommended for all users of SciChart to update to the latest version! Please see more information below.
What’s new in SciChart Android 4.1?
Bug fixes and improvements:
SC_DROID-788: added text alignment property into AxisTickLabelStyle to allow overriding of text alignment within axis tick label;
SC_DROID-785: removed code for handling axis drag with AutoRange.Always via applying GrowBy on axis;
SC_DROID-784: added methods to block the setting of background for chart parts which always should be transparent; for others set transparent background;
SC_DROID-783: fixed incorrect width calculations for StaticLayout;
SC_DROID-782: fixed rollover tooltips placement, mirror tooltips both horizontally and vertically;
SCIOS 1014: fixed the legend checkboxes did not work on iOS and Adorners appear above Legend both on iOS and Android
In order to license SciChart.js and unlock all its features, there is a simple procedure that must be followed. Without this you won’t be able to run or deploy applications built with SciChart.js. Licenses are unique to all SciChart products, so licenses for another products cannot be used for SciChart JavaScript Charts and vice versa.
Please be aware before starting usage of the SciChart software constitutes acceptance of the licensing terms & conditions. SciChart is licensed per-developer with a royalty-free redistribution rights for your applications. A helpful licensing FAQ can be found here.
If you wish to purchase a paid SciChart license, you can do so at the store.scichart.com. Likewise, you can download the framework at our scichart.com/downloads page.
To try out SciChart.js, you will first need to start a trial. You can do this using our cross-platform licensing wizard which is common to all SciChart platforms.
Download the licensing wizard from here and install on your Mac desktop.
Next, log in to the Licensing Wizard using your scichart.com username and password. If you do not have an yet, you can create one here.
Once logged in, click “Start Trial” on the Trials tab for SciChart.js.
Your SciChart.js applications on localhost will search for the licensing wizard to validate the trial license locally. Leave the licensing wizard open or minimise to tray while developing!
To activate a developer license so that you can unlock the full version of SciChart.js, download the cross platform licensing wizard and install on your Windows or Mac desktop.
Once installed, and you have logged in with scichart.com account, you can activate the developer serial you received when you purchased.
After activation you will see your license status on the wizard homepage.
Note: Your SciChart.js applications on localhost will search for the licensing wizard validate the trial license locally. Leave the licensing wizard open or minimise to tray while developing!
Deploying SciChart.js to Live Sites
When you have a paid SciChart.js developer license, to deploy an application to a domain you need to register that domain with your account.
The Runtime Key must be placed in your application once before any SciChartSurface is shown or instantiated, for example in a Root component in a React App.
Code samples below:
// Set a runtime key in JavaScript once before any SciChartSurface is created
SciChartSurface.setRuntimeLicenseKey("YOUR_RUNTIME_KEY_HERE");
Note: You can register a single domain for each developer license you have purchased. Site licenses or company-global licenses can register unlimited domains.
Make sure you update your runtime keys after adding a new domain!
Github Source Code Access
If you are a SciChart.js Source-Code customer, you can now access the source code via our Github repository. To get access, please follow the steps below:
#1 Activate your SciChart License
You need to activate your SciChart License following the steps above ‘Activating a Paid License’.
#2 Link your account to Github
Now enter your Github Username in the box directly below. If you do not have a Github account, head over to www.github.com and register.
Note: You will need to be logged in to scichart to use the profile page. Please log in at or create an account at www.scichart.com/login if you haven’t already
#3 Respond to Invitation
You will receive an email with an invitation to join the SciChart.js Github repository! Accept the invitation to get access!
Troubleshooting
If you cannot manage to get your application working with the license applied, please check out our licensing troubleshooting steps below or contact us and we will do our best to help.
Locating License Keys
Your serial key and developer runtime key is found in your License Certificate email and also online at www.scichart.com/profile. If you do not have either, please contact-us!
View your license keys at the profile page
SciChart Licensing Email Example
Trial Expired or Invalid License Problems
Sometimes people report that after deploying their application, the Trial Watermark still appears, or, end users see Trial Expired.
Follow the steps below to debug this.
Check support expiry date: if your support subscription has expired, then you cannot use the latest versions of SciChart. You can check your support subscription at the profile page or in the cross platform licensing wizard. Contact sales to renew your license, as generous discounts are available if you renew promptly!
For localhost: check the Licensing Wizard application is open. Licensing error messages are reported to the browser console, and SciChart.js periodically has to check the licensing wizard for a valid license key.
Check the Runtime License Key is set: Follow the steps above to set your Trial or Paid Runtime License key in your app. Without this, the app will not work!
Ensure Runtime Key is set once before any SciChartSurface is created: The SciChartSurface.SetRuntimeLicenseKey method must be called once before any SciChartSurface is instantiated.
Check out this Quickest of the QuickStart Guide below which shows you how to run the Examples Suite, work through the tutorials and see what SciChart.js can do.
1. Starting a SciChart JavaScript Trial
To try out SciChart.js, you will first need to start a trial. You can do this using our licensing wizard which is common to all SciChart platforms.
1. Download the Licensing Wizard
To start the trial, please download the Licensing Wizard to your Windows or Mac Desktop.
Note: On your first login, on Windows, you may have to accept Firewall access for the Licensing Wizard. This is required for starting trials and licensing on SciChart.js and only uses traffic over localhost.
3. Start a Trial
Click “Start Trial” on the Trials tab for SciChart.js.
Your SciChart.js applications on localhost will search for the licensing wizard to validate the trial license locally. Leave the licensing wizard open or minimise to tray while developing!
Note, if you have purchased a paid license, then head over to Licensing SciChart.js to learn how to activate and use it, and create deployment keys for your domains.
2. Compiling the SciChart.js Examples
The SciChart.js Examples features a rich examples suite with over 40 JavaScript Chart examples. We are also adding new examples all the time! You can clone the SciChart.Js.Examples from GitHub, or grab the latest SDK from the downloads page and unzip to get started.
Once you’ve downloaded it, open the Examples folder in VSCode, or WebStorm.
You’ll need to:
Start a trial if you have not already done so (see Step #1 above)
Leave the licensing wizard open as the examples fetch the license from it
In terminal, type npm install
Next type npm run dev
Compile and Run SciChart.Js.Examples
3. Creating your First SciChartSurface (Tutorials)
We now have a full set of tutorials online, to walk you through the basics of getting to know SciChart.js. Each Tutorial has an npm project which you can find in SciChart.Js.Examples Github repository.
We recommend to learn SciChart quickly, get through the tutorials as soon as you can, as they will teach you a lot of techniques quickly (Creating a project, series, data, real-time updates, tooltips, zooming, panning and more).
4. Deploying a SciChart.js Application during Trial
If you wish to share or deploy your website with a trial SciChart.js license, you will need to set the Runtime Key in your application code. This application will work until the trial expires.
After starting a trial (see step #1 above), get the Runtime (Deployment) Key by clicking ‘Key Code” next to your trial.
The Key Code must be set in your app once before any SciChartSurface is shown. Do this by calling the static function SciChartSurface.setRuntimeLicenseKey() in your JavaScript app startup or root component.
// Set a runtime key in JavaScript once before any SciChartSurface is created
SciChartSurface.setRuntimeLicenseKey("YOUR_TRIAL_RUNTIME_KEY_HERE");
This process can also be used to apply trial extensions if you are given one from our sales team.
5. Ok Great! So where is the Documentation?
All of our documentation is online. Please see the following resources to help you get started.
SciChart.js v1.x Documentation at SciChart.js SDK Documentation (Also viewable from Homepage Menu -> Developers -> Documentation)
During your trial of SciChart.js we will gladly answer your technical questions about the chart. We also welcome feedback about how we can improve the software and make it easier to use, more feature-rich or perform better.
You can get in contact with us through any of the following channels:
After the trial expires, you may purchase a support subscription to maintain access to technical support & to continue developing with SciChart. For pricing and licensing please either contact us, or see our online store.
We are excited to announce SciChart JavaScript ultra-high-performance charts first official version released!
SciChart.js v1.0 official release
SciChart.js is an ultra-fast, realtime 2D & 3D Chart Component for HTML5 / JavaScript apps. SciChart.js is based on our multi award-winning cross-platform graphics engine, Visual Xccelerator® built in C++, and compiled to WebGL and WebAssembly.
We bring you a brand new library for JavaScript graphs and charts which is fully hardware accelerated. SciChart.js API will allow you to plot and update data in real-time to create next-generation data-visualisation applications in JavaScript, TypeScript, and React, or any other JavaScript framework.
See our live demos in the SciChart.js examples suite: demo.scichart.com
SciChart.js charting component is tailored for demanding applications in Financial & trading, Scientific & Medical, Engineering domains as well as complex enterprise applications which need the best performance and best possible visualizations.
Our proprietary visual engine allows drawing primitives in Immediate-Mode rendering at extremely high speed so that high-performance 2D & 3D Charts can be rendered on multiple platforms including the web. This engine has been successfully compiled to WebGL and WebAssembly, and enables native speed by taking advantage of the CPU and GPU.
Millions of lines at once is no problem for SciChart.js!
We provide multiple configuration options allowing for the creation of complex dashboards and visualizations, such as creating JavaScript stock-chart financial applications and more.
With SciChart.js annotating the charts and graphs in your application will be easy! We offer the ability to add Lines, Text, Shapes, Boxes or rectangles onto the chart out of the box.
These can move, pan and scale with the chart, or be positioned absolutely e.g. in the center of the chart, or top left, bottom right etc…
6. Themeing, Styling the chart and Per-Point Colouring
SciChart.js allows you to custom every element in code. We also ship with two themes, light and a dark theme, but also our flexible API will let you create your own custom themes.
SciChart.js features per-point coloring and styling via the PaletteProvider API. This will allow you to color individual data-points, add gradient-lines or mark the values over some threshold.
You can get SciChart.js version 1.0 examples zip from our downloads page at www.scichart.com/downloads. You will need to create an account at scichart.com/login in order to access this page.
SciChart.js is included in the Bundle 2D Pro, Bundle SDK Pro and Bundle SDK Enterprise products available on our web store. These packages include our 2D Charts, 2D/3D and 2D/3D+Source code for all our platforms (Windows, iOS, Android, Mac and JavaScript).
Customers with the up today support active license of SciChart Bundle packages will get SciChart.js for free.
We are also be shipping SciChart.js individually as a JavaScript 2D Chart license and JavaScript 2D and 3D Chart license, that can be purchased at our store.
All our licenses will come with 1-year technical support & updates as standard. If you have any questions, please contact us!
Road map for v1.1
Next on our roadmap for the release of SciChart.js 1.1, we have the following top priorities.
3D charts API improvements: there more features coming for SciChart.js 3D, like tooltips and selection, PinchZoomModifier, and ZoomExtentsModifier. We will also be adding new chart types, such as Pie and Donut 3D Chart types.
Splines Series Types/ Smoothing API: we will add a build-in smoothing algorithm for different series, by adding SplineBand, SplineLine, SplineMountain series types. Sometimes displaying raw data is not useful and hard to read, smoothing algorithms assist with visualizing it over time in an easy to read manner.
ChartAnimations: we will add support for animating the charts with fade, sweep, fly-in, fly-out, scale, wave animation, and more.
More examples. tutorials: we will be building out the examples / demo application to have even more examples of how to use our software. If you have a request, just let us know!
That’s an incredible amount of work for a year which has been challenging to say the least! … A year in which we’ve also achieved substantial economic growth, despite the circumstances.
We published originally about our roadmap and vision for SciChart a few years ago, where we talked about how we planned to build a common C++ core across platforms, and build every platform on top of that. That vision is now complete!
All the SciChart platforms: WPF (Windows), iOS/Android (Mobile), Xamarin, macOS and JavaScript share a common core written in C++, an extremely fast, lightweight, 2D/3D graphics engine which we call Visual Xccelerator. We’ve built this engine to compile to many targets, and use a variety of graphics technologies such as DirectX, OpenGL, Metal and WebGL to run on various platforms.
What this has done is allowed us to re-use code and build for platforms faster:
SciChart WPF took us 7-8 years to perfect. This is an incredibly well engineered piece of software with millions of lines of code. Achieving the balance of fastest WPF Chart performance, but also high flexibility and depth of features required six iterations and several complete re-writes along the way.
SciChart Mobile (iOS/Android) took us 3-4 years to build. The mobile platforms introduced new challenges such as running on low-power or slower CPU hardware, and the overall efficiency of algorithms had to be investigated.
SciChart.js was completed in under a year. This acceleration of our multi-platform rollout is a direct result of our investment into a common/shared C++ codebase.
Having a common C++ codebase allows us not only to have the fastest chart libraries across platforms, but also well tested libraries due to the number of users across platforms, and a set of libraries which is more efficient and to maintain and faster to market for new platforms.
Our investment into the Visual Xccelerator Engine puts SciChart in a unique position amongst chart component vendors. Should a new platform be created tomorrow, or should our customers request an existing platform, we can build it and fast.
What’s Next for SciChart?
We’ve come a long way, and while this vision of cross-platform chart libraries is complete, we are by no means done.
2021 and onwards we aim to do the following:
Continue to support and maintain our award-winning, cross-platform chart libraries.
Add features based on requests from our customers in the Feature Request system, which could include chart types, minor features or even entire platform ports.
Build layers on top of SciChart: for example we now have the potential to move into data-analytics space or build services which our users require.
Consult for our customers – which we are already doing – we provide customisation & consultancy services to build enhancements or entire applications as requested by customers who want to work more closely with our development team for a fee.
One thing is for sure, that the excellence you’ve seen from SciChart in the past is core to our work ethos both now and in the future, we aim to keep going and keep delivering for our customers and continue adding value to them in 2021 and beyond!
What do you want to see next from SciChart?
We practice customer-driven development at SciChart and we’ve always been keen to hear your requests to steer our roadmap. So, if there’s something specific you want to see from us, please do not hesitate to use the feature-request system, or contact us directly.
Thanks for your time for reading this, and a big thank-you to our customers who have supported us this year and beyond! As always, your feedback is welcome and if there’s anything you need, then by all means contact-us and we will be glad to help!
We are pleased to announce a minor update to SciChart.js: version 1.1.1295. This release contains a number of minor improvements and bug fixes and builds upon our v1.0 release earlier in the month. Find out what’s new below!
What’s New in SciChart.js v1.1.1359?
1. Added Browser Global Module support
It allows using SciChart.js library directly in the browser without using bundlers like webpack. See example.
2. Added boilerplate projects for various platforms.
Added a number of boilerplate projects to show what SciChart.js supports and how it can be used with Angular, Electron, React, and Vue platforms.
3. Completed a set of tutorials.
You can view all the tutorials for SciChart.js, many of which have YouTube videos, at the following links:
SciChart.js now allows you to create a single hostname per developer license, plus two test hostnames. Hostnames may be edited/updated at www.scichart.com/profile
Fixed overflow error when “margin: auto” is used on SciChart.js containing div
Fixed issue with the charts bigger than 1920×1080
Fixed issue when heatmap series does not respond to opacity
Fixed contours orientation issue allowing contours to be used without a color map
Fixed Vertical charts issues: flipping problem for heatmap, usage with ZoomPanModifier, X/YAxisDradModifier, MouseWheelZoomModifier and RubberBandXyZoomModifier
Improved heatmap opacity handling by using HTML5 context.globalAlpha flag
Where to get SciChart.js v1.1
You can get SciChart.js version 1.1 examples zip from our downloads page at www.scichart.com/downloads. You will need to create an account at scichart.com/login in order to access this page.
We are pleased to announce that the SciChart WPF v6.3 build 13476, has now been released! This update includes a number of bug fixes and minor enhancements requested by users since version 6.2.x. This release is a drop-in replacement for 6.x and it is recommended for all users to update.
What’s New in SciChart v6.3?
1) .NET 5 Support
SciChart WPF library has been tested to work in .NET 5 applications! Please also note that SciChart WPF Library has upgraded to NetCore 3.1.
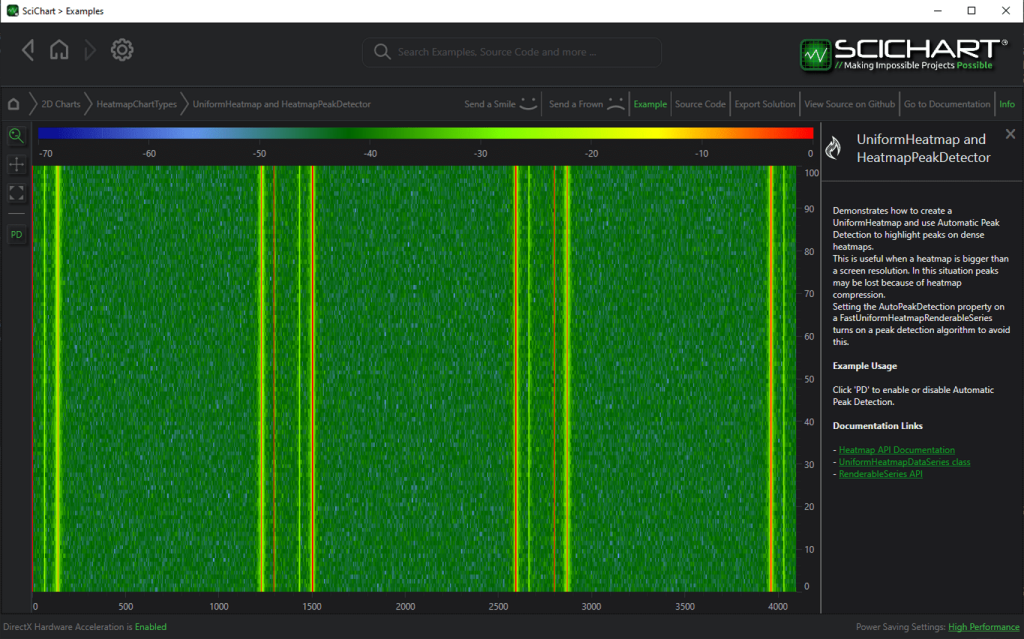
2) Heatmap Peak detector Feature
This is a new feature requested by many customers of SciChart WPF. When a heatmap dimension exceeds the corresponding screen dimension the peaks can be lost because of the heatmap compression, so it becomes important to find and show those.
The Heatmap Peak Detector example demonstrates how to create a WPF 2D Uniform Heatmap and use Automatic Peak Detection to highlight the peaks.
Simply setting the AutoPeakDetection property on a FastUniformHeatmapRenderableSeries in SciChart turns on peak detection algorithm.
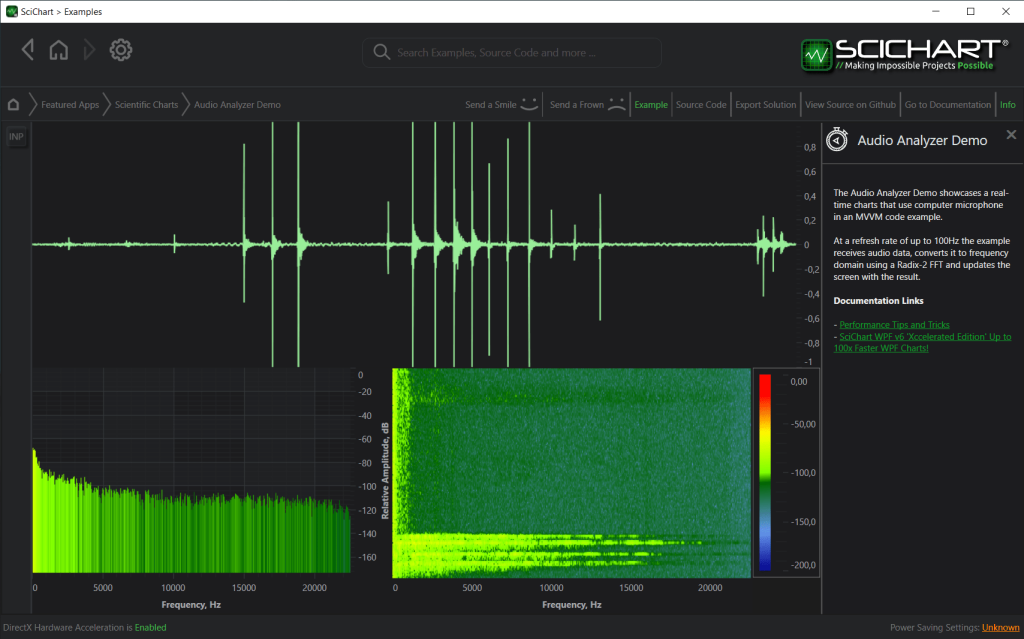
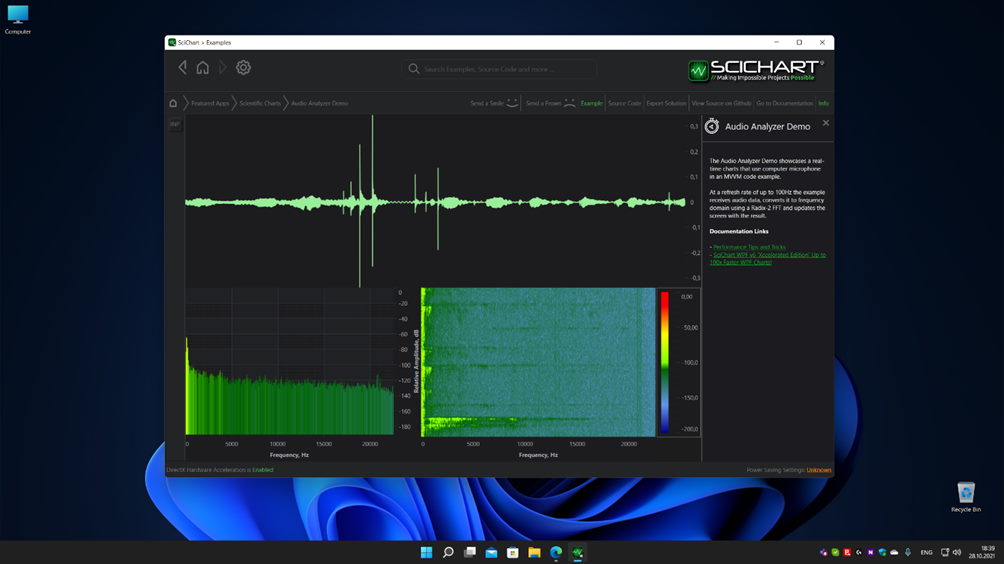
The Audio Analyzer demo showcases realtime charts that use computer microphone.
At a refresh rate of up to 100 Hz the example receives audio data and creates a waveform of the sounds, that you can see in the top chart.
The example next converts the audio data to a frequency domain using a Radix-2FFT and updates the screen with the result in form of the column chart on the lower left side and the spectrogram, created with heatmap on the right.
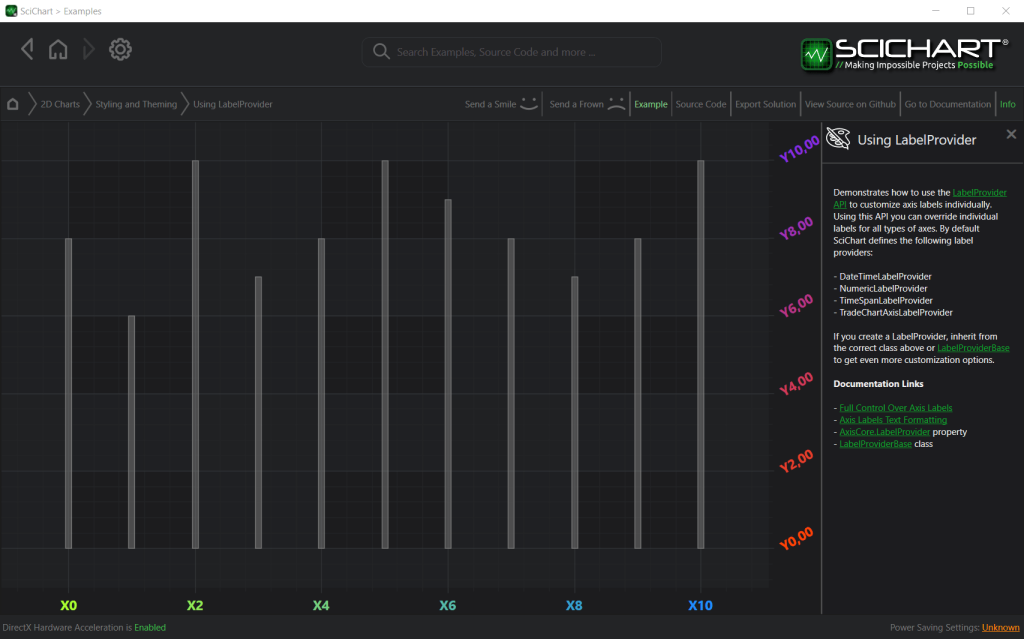
SciChart API is designed to be very flexible. You can customize every element of the chart to your needs. We have created an example that demonstrates how to customize axis labels individually with the LabelProviderAPI.
Using this API, you can override individual labels for all types of axes.
SC-5575 Fixed: HistobarRenderableSeries cannot be added as HistobarRenderableSeriesViewModel
SC-5574 Fixed: issue when Legend could be empty in SciStockChart with enabled Cursor/Rollover modifier
SC-5559 Fixed: When hit testing a 3D mesh, the HitTest() fails until the chart is either zoomed or resized
SC-5565 Fixed: VisibleRangeChanged is not raised for DateTimeAxisViewModel
SC-5563 Fixed: bugs with horizontal scroll bar, RubberBandXyZoom, and ZoomExtents Modifiers on the touchscreen
SC-5566 Fixed: The color of the FastBubbleRenderableSeries swaps between blue and red when IPaletteProvider is used
SC-5477 Fixed: Dashed line doesn’t work on stacked mountain series
SC-5560 Fixed: System.InvalidOperationException when “SciChart Trader Demo” example is launched
Fixed: dashed lines in stacked mountain series, bands and mountain series
SC-5553 Fixed: System.AccessViolationException: ‘Attempted to read or write protected memory’ when PaletteProvider is used for Scatter Series
SC-5554 Fixed: System.NullReferenceException when annotation is deleted from the collection
SC-5555 Fixed: Memory leak for annotation labels when view-models are switched
SC-5523 Fixed: unhandled exception in LiDAR example
SC-5548 Fixed: 2 of 4 resize grips of the BoxAnnotations do not work on the vertical chart
SC-5527 Fixed: VerticalLineAnnotation doesn’t reach the first RenderableSeries point if you move it to the left
SC-5542 Fixed: Transparent Stroke Color set by PaletteProvider changes RenderableSeries Shape
SC-5543 Fixed: Stroke Color set by PaletteProvider is not applied to RenderableSeries when VisualXcceleratorEngine is enabled
SC-5502 Fixed: Y-values mismatch after panning the chart to the left
SC-5500 Fixed: VerticalSliceModifier.VerticalLines with RelativeCoordinateMode doesn’t display tooltip in correct location
SC-5545 Fixed: the issue when users couldn’t implement IPointMetadata3D because of direct casts in XyzDataSeries3D
SC-5529 Fixed: Changing Color in ExamplePointCloudPaletteProvider in the “Simple Select Scatter Point 3D Chart” example doesn’t change the selected PointMarker color
SC-549 and SC-5501 Fixed: DoubleScaleDiscontinuousDateTimeAxis. The bottom labels are overlapped and drawn in wrong place
SC-5528 Fixed: System.ArgumentNullException, value cannot be null appears when Visual Xccelerator Engine is enabled
SC-5536 Fixed: System.TypeInitializationException when a view-model is created in code and don’t used in a surface in XAML
SC-5507 Fixed: The YStrokeColorMapping property does not apply to WaterfallRenderableSeries3D
SC-5511 Fixed: 3D Memory leak with AccessViolationException and InvalidOperationException: Native collection has been destructed!
SC-5504 Fixed: Surface doesn’t render Or AccessViolationException
Please ensure you uninstall the previous version(s) of SciChart before installing the latest version as this can prevent some issues in the upgrade process!
Pricing and Licensing
SciChart WPF v6.3 is free of charge to customers with an active Support-Subscription.
For new customers, please find our pricing at our store page.
If your support has expired and you would like to get access to the improvements & fixes in this release, contact-sales and we will prepare you a renewal quote.
We are pleased to announce that the SciChart iOS, macOS, and Android v4.2, has now been released! There is a new feature, a number of improvements, memory leaks and critical bugs fixed. It is recommended for all users of SciChart to update to the latest version! Please see more information below.
What is new in SciChart v4.2
New Series Value Modifier Feature
In the new version of SciChart iOS, macOS and Android we have added an often requested by users in Financial and Trading feature, the SeriesValueModifier. This is a modifier that displays the last series value as a marker on the YAxis. This modifier automatically creates one marker per series and places it at the series latest Y-Value on the Y axis.
This helps you to know what the latest value is no matter where you panned the screen to.
The application distribution issue with macOS BigSur and XCode 12 fixed
From this version following Apple, we have bumped the minimum supported iOS version to 9. Everything worked well until macOS BigSur and XCode 12 were released. With that many of our users reported that they were unable to distribute theirs apps through the AppStore. This has been fixed now!
SC_DROID-797: Fixed isHitPointValid() check which was preventing showing of tooltip beyond data bounds of series
SC_DROID-796: Fixed PieSegmentSelectionModifier selectedSegmentStyle doesn’t work
Fixed 3D text on Android
SC_DROID-794: Fixed incorrect rendering of point markers in OpenGL – added switching of blending mode when rendering sprites to fix this
SC_DROID-791: Fixed overriding of MajorTickLineLength by ThemeProvider
Fixed differences in the rendering of texture brush in canvas vs OpenGL surfaces
Added per primitive rendering of triangles in canvas RenderContext
Added per primitive triangle strips rendering for OpenGL surface
Implemented ISuspendable for data series
Fixed bug in adding observers for ObservableCollection which pass equals check, but actually are different objects
Fixed crash of demo application in landscape mode – added missing ids into XML layout
Removed usage of ButterKnife in all examples since it’s now deprecated and replaced it with ViewBinding
Updated project to Android plugin v4.1; updated third-party libs used for testing and in demo app
SciChart iOS / macOS:
SCIOS-1048: Fixed crash when place Legend manually on iOS12
SCIOS-1050: Changed hit checks for line series to provide correct line search for isHit check;
SCIOS-1051: Fixed attaching/detaching first hitProvider in SCICompositeHitProvider
SCIOS-1049: Fixed missing layoutMargin setter
SCIOS-1042: Fixed SCIPieSegmentSelectionModifier selectedSegmentStyle doesn’t work
Fixed a bunch of memory leaks in SciChart.framework as well as in some examples in demo application.
SCIOS-1039: Fixed placing Legend outside the Chart or SCIChartLegend manual placement (added helper methods to add/remove legend)
SciChart both iOS/ macOS and Android:
Fixed heatmap border issue
Improved fonts quality, using mipmaps with font textures and forcing a minimum texture size
Added texture mapping properties for mountain chart
Added getCategoryXRange() method into IRenderableSeries to provide correct DataRange calculations for category axis in case of using series that doesn’t require additional space (line, mountain vs candlestick, column)
Where to get SciChart iOS / macOS / Android v4.2?
You can get SciChart iOS, macOS and Android from Downloads pages.
Separately you will need to download the Cross Platform Licensing Wizard, required to activate and license SciChart Mobile SDK v3
It consists of new features, great improvements, and bug fixes. It is suggested for all the users of SciChart.js v 1.1 and earlier to upgrade to this version.
What’s new in SciChart.js v1.2?
New Features
New Annotations Types: Horizontal Line, Vertical Line, and Axis Marker Annotation The HorizontalLineAnnotation draws a horizontal line at Y1 and VerticalLineAnnotation draws a vertical line at X1. The HorizontalLineAnnotation may be stretched (horizontally) across the chart or drawn to a specific X-value, same as VerticalLine annotation can be all across the chart or just to a specific point.
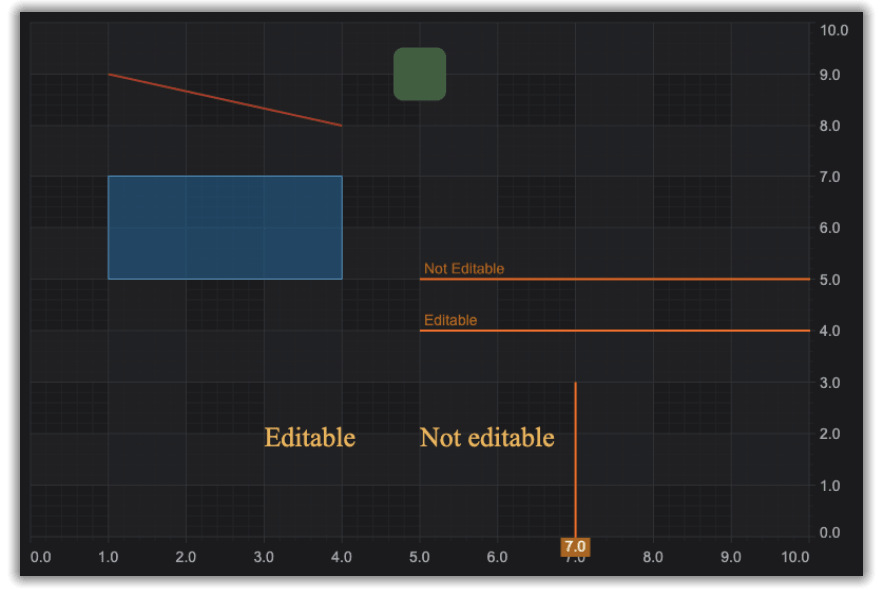
2. Annotations Editable Now you can select an annotation, then drag it by the corners to resize and move it around the chart.
All the annotations are editable now, including Line Annotation, Box Annotations, Text Annotations, Horizontal and Vertical Annotations, and Custom Annotation.
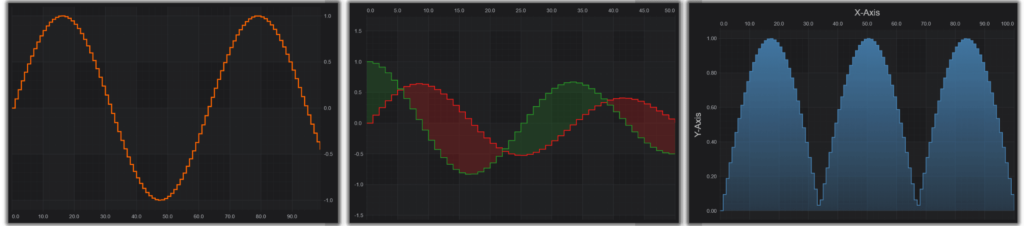
3. Step or Digital Chart types: Step Line, Step Band, and Step Mountain chart types
The step or digital chart types are often used to visualize data that changes at irregular intervals. SciChart.js now supports digital line, digital band and digital mountain series that can be used in rendering high performance visualization.
SciChart.js now allows even more flexible styling of your javascript charts. You can easily edit the thickness and color of the borders around any part of a chart: chart surface itself (viewportBorder), the render surface (canvasBorder), X and Y axis (axisBorder), even if there is more than one of each.
SCJS-434 Performance improvement: for DataSeries.removeRange
SCJS-447 Fixed: Pie Chart does not respond to the theme
SCJS-455 Fixed: The legendModifier.sciChartLegend.update() method does not seem to update the chart legend.
SCJS-446 Fixed: Vertical Chart labels overlap
SCJS-440 Fixed: Multiple synchronized Charts are laggy, recurring issues
SCJS-438 Added: Allow configuring Padding on SciChartSurface
SCJS-432 Added: Culling axis labels
SCJS-411 Add: StrokeDashArray to LineAnnotation
SCJS-437 Fixed: WebGL rendering breaks when appending duplicate X-values
SCJS-436 Fixed: Cannot read property growBy of undefined
SCJS-406 Fixed: Uncaught Typeerror, cannot read property growBy of undefined
SCJS-459 Fixed: Bug when removing/detaching CursorModifier
SCJS-458 Fixed: ZoomPanModifier Zoom out showing NaN on the scale.
SCJS-436 Fixed: error if growby is set, but no data
Added: customizable labels on line annotations
Fixed: bug with adding a new item to legend
Fixed: logic for flipped coordinates and flipped axis
Fixed: Annotations, Labels, and PointMarkers issues on vertical mode
Fixed: heatmap framerate drop bug
Fixed: bug with cropped labels
Fixed: theming bug for RenderableSeries and ChartModifiers
Fixed: Pie Chart theming and on click segment selection
Where to get SciChart.js v1.2
You can get SciChart.js version 1.2 examples zip from our downloads page at www.scichart.com/downloads. You will need to create an account at scichart.com/login in order to access this page.
At SciChart we focus on creating the world’s fastest, and best chart components across platforms. Our award-winning software has already been considered the best in class for WPF (Windows) and mobile, and our goal for SciChart.js is exactly the same – to make this the world’s best, most flexible and powerful charting & data-visualization toolkit for JavaScript apps.
What has made us great in the past is customer feedback. We have a really loyal customer-base who in the past has not been shy about giving us feedback: both positive and negative. We like to follow customer-driven-development to ensure that we are creating the most valuable products and features for your applications.
With that in mind I would to share with you our plans & roadmap for SciChart.js in 2021, but also to get your feedback on what features you would like to see, what bugs or issues annoy you and how best we can improve.
The first version featured many chart types including Line, Scatter, Bubble, Column, Candlestick, Ohlc, Mountain, Area, Band, Fan, Heatmap, Stacked Column, Stacked Mountain, Pie, Donut, 3D Bubble Chart, 3D Surface Mesh chart.
Extreme realtime or Big-data performance
Zooming, panning, scaling interactions via the ChartModifier API
Added more examples including contours, creating annotations on mouse-click, heatmaps in vertical charts, data-point selection, animating Xy values, realtime zooming and panning, 1-million point demo
We are about to release another update to SciChart.js, version 1.3. This contains some excellent features and improvements and we will be publishing this shortly.
Series animations, including opacity (fade), sweep, wave and scale which are featured in our other platforms (WPF, iOS, Android, macOS).
Various bug fixes and improvements including performance issues, a memory leak and other issues reported by our users.
Q2-Q3 Roadmap
So what next? That depends entirely on you, our userbase. You need to tell us what you want to see us build! We have been collecting feedback and already have these features on our roadmap.
Features in WPF/iOS/Android SciChart which are being ported to Js soon:
PointMetadata feature. Ability to tag data points with objects which can be consumed in tooltips.
Finally we’re also redesigning the SciChart.js Examples App. This is going to look considerably better and be more usable. It will also help us as we add many more examples (we plan to add hundreds).
SciChart.js Features Survey
So there’s plenty on our roadmap but we’d love to hear from you what is most important? What do you want to see us build in SciChart.js? What would make you become a customer (if not already)?
We’ve created a simple SciChart.js Features survey with where you can tell us your features. It should only take a few minutes to fill out. If you want to see something in SciChart.js then please tell us below! These are going to get reviewed and fed back into our roadmap so we can create the most valuable, most useful products for your projects.
It consists of new features, great improvements, and bug fixes. It is suggested for all the users of SciChart.js v 1.2 and earlier to upgrade to this version.
What’s new in SciChart.js v1.3?
New Features
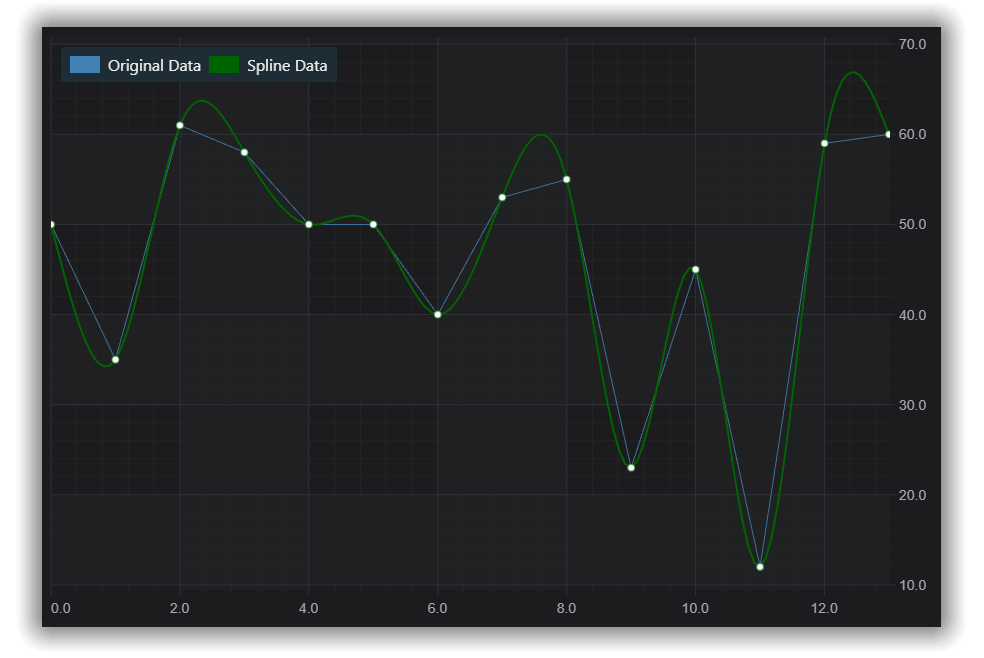
Spline Series
Spline Line Chart SciChart.js features a native spline-line (smoothed line) series. It provides aesthetically attractive, yet high-performance smoothed line charts for web applications. Given raw data, which can be a large number of points, our customers needed to see the smoothed line to help analyze the data.
Spline Line series uses Bezier interpolation between data-points. Our intelligent and dynamic smoothing keeps the performance outstanding and allows visualizing hundreds of thousands and even millions of data-points.
Spline Mountain Charts SciChart for JavaScript 1.3 features a spline mountain or area series which provides aesthetically pleasing, high performance smoothed mountain/area charts for JavaScript apps. Again, performance is excellent thanks to our dynamic smoothing and this chart type allows interactive frame-rates into the hundreds of thousands of points.
Spline Band Chart SciCHart.js provides the API for slick smoothed band chart type as well. This allows you to create high performance smoothed band / high-low fill charts for JavaScript web applications.
SciChart’s JavaScript Chart now features a new JavaScript Chart Animation API. Animated JavaScript charts will help you create captivating web applications. There are four standard animation types introduced in SciChart.js, including Wave, Sweep, Fade and Scale animations.
Wave JavaScriptChart Animation
Sweep JavaScript Chart Animation
Fade JavaScriptChart Animation
Scale JavaScriptChart Animation
Animation API is flexible so you can control when the animation starts and stops, the delay, as well as duration. You can also combine different animations for one chart!
Spline Series and Animations
It is an interesting and unique case of combining the spline algorithms with applying animations on one series. Please see the example and the source code for more information: Animated JavaScript Spline Area Chart.
Dashed Line Styling
SciChart.js v 1.3 introduces more options to style your chart by adding the dashed line styling.
Fixed Y axis autorange for zero range series and added undefined range check (SCJS-479)
Fixed AutoRange for Horizontal line (SCJS-479)
Added ExecutesOn property to some ChartModifiers (SCJS-457). It allows using RubberBandXyZoomModifier and ZoomPanModifier simultaneously with different mouse buttons.
Changed naming for axisLabelFill, axisLabelStroke/ added axisFontSize, axisFontFamily and added AxisLabelFont and AxisLabelFontSize properties to LineAnnotation
Fixed CursorModifier and RolloverModifier bug when RenderableSeries has zero-length data
Fixed bug using together RubberBandXyZoomModifier, XAxisDragModifier, YAxisDragModifier
You can get SciChart.js version 1.3 examples zip from our downloads page at www.scichart.com/downloads. You will need to create an account at scichart.com/login in order to access this page.
Search through more than 50 examples to see the many features we offer for your JavaScript Charting Applications, various popular and complex 2D and 3D chart types, extreme performance demos, different axis options, markers and annotations, styling and themes, chart interactions with tooltips, rollovers and more!
We are always open to the feedback and will be happy to hear back!
With SciChart.js 1.3.1514 or above you can specify the URL of the WebAssembly file. We publish SciChart.js to npm but also to a global CDN. Use this syntax to specify loading the wasm file from URL. Be sure to set the version number to match the scichart.js version number if you use our CDN!
// Load the SciChart.js WebAssembly (Wasm) File from a specific URL
// Example below is for cdn.jsdeliver which we publish to
SciChart.SciChartSurface.configure({
    dataUrl: "https://cdn.jsdelivr.net/npm/scichart@1.3.1514/_wasm/scichart2d.data",
    wasmUrl: "https://cdn.jsdelivr.net/npm/scichart@1.3.1514/_wasm/scichart2d.wasm"
});
Where to get SciChart.js v1.3.1514
You can get SciChart.js version 1.3.1514 examples zip from our downloads page at www.scichart.com/downloads. You will need to create an account at scichart.com/login in order to access this page.
It consists of manymemory leaks that are fixed, other important bug fixes, and great improvements. It is suggested for all the users of SciChart.js v 1.3 and earlier to upgrade to this version.
What’s new in SciChart.js v1.4.1595?
Important Fixes
Fixed memory leaks for Heatmap, Contour Chart, LineAnnotation, CursorModifier and RolloverModifier
Fixed Gradient Brush memory leak
Fixed PointMarkers for Y2 values for Band Spline Animation
Fixed initial blinking when animating series with point markers
Known issue: WebGL Context loss issue on Intel HD 620/630 hardware. Our team is in communication with Intel engineers to resolve this.
Where to get SciChart.js v1.4.1595
You can get SciChart.js version 1.4.1595 examples zip from our downloads page at www.scichart.com/downloads. You will need to create an account at scichart.com/login in order to access this page.
We are pleased to announce that the SciChart WPF v6.4 build 13629 has now been released! This update includes new features, a number of bug fixes, and minor enhancements requested by users since version 6.3.x. This release is a drop-in replacement for 6.x and it is recommended for all users to update.
Enabling UseAlternativeFillSource slightly changes the drawing pipeline. This method reads the rendered output back from GPU memory to main memory before setting it on a WPF image in a bitmap, sending it back to the GPU. The performance impact caused by this change is insignificant (about a millisecond on modern GPUs) and can be neglected.
To disable it please set static property VisualXcceleratorEngine.UseAlternativeFillSource to “False” anywhere in code.
New Features and examples
3D light modes
This feature introduces dynamic scene lighting to SciChart 3D. It allows users to control the light direction in 3D charts. It is enabled on the SciChart3DSurface using Viewport3D methods. The Viewport3D is attached to the SciChart3DSurface.Viewport3D property and may be used to customize the presentation of the 3D Scene.
To use it, you have to set LightMode to “GlobalSpace” on the current Viewport3D instance:
viewport.SetMainLightMode(MainLightMode.GlobalSpace);

Then LightDirection can be set as a vector in global space coordinates:

var vector = viewport.GetMainLightDirection();

vector.x = 0.25f;
vector.y = 0.5f;
vector.z = -0.5f;

viewport.SetMainLightDirection(vector);
The LightDirection vector is normalized, so its components can obtain values from -1 to 1.
You can try it in our examples demo. Clicking LD button on the left lets switching between main light modes. You can also change X,Y,Z light direction properties to see how the viewport of the 3D Chart changes.
Multiple Axis Markers for the SeriesValueModifier on a composite renderable series
This feature allows adding multiple axis markers for the SeriesValueModifier on composite renderable series. By default, SeriesValueModifier shows multiple axis markers for the following composite series: – Band Series – Digital Band Series – Grouped Column Series – Stacked Column Series – Stacked Mountain Series
If you need to create additional SeriesValue markers, you can inherit the default SeriesInfo provider and override the OnAppendDataColumnInfo method.
SeriesInfoProvider allows Modifiers to receive multiple information units from a single RenderableSeries. This is useful when there is a need to show several feedbacks, for instance, multiple AxisMarkers per one RenderableSeries with SeriesValueModifier. SeriesInfoProvider must implement the ISeriesInfoProvider interface and can be assigned to a RenderableSeries via the SeriesInfoProvider property.
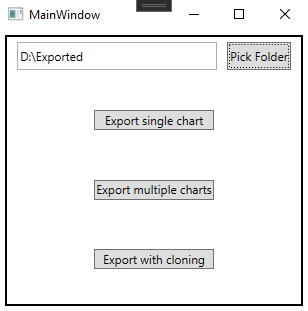
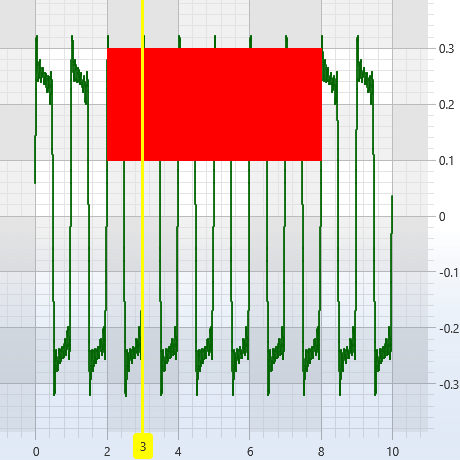
This is a very often asked question on our forums and support desk. Our team has created an off-screen export example that shows how to export a single chart, export multiple charts, and export with cloning.
Example UI and Single Chart Off-screen export
The example interface is simple and will save a png file of a chart that is created in code into the folder that you choose.
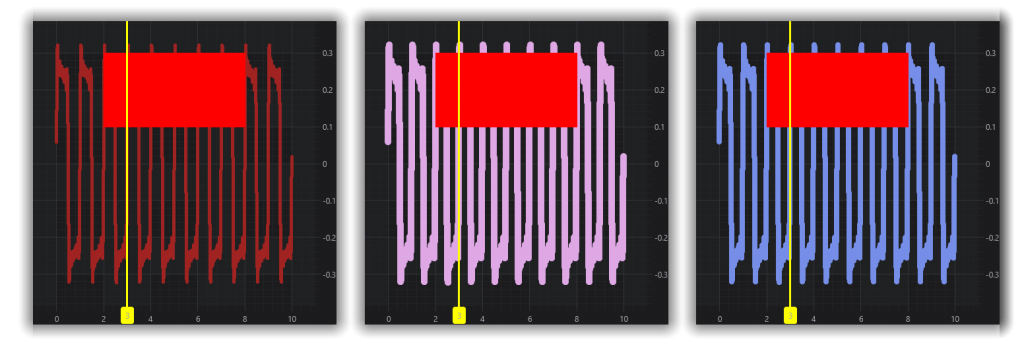
Export Multiple Charts
This exports multiple charts with different line thicknesses and colors, for example.
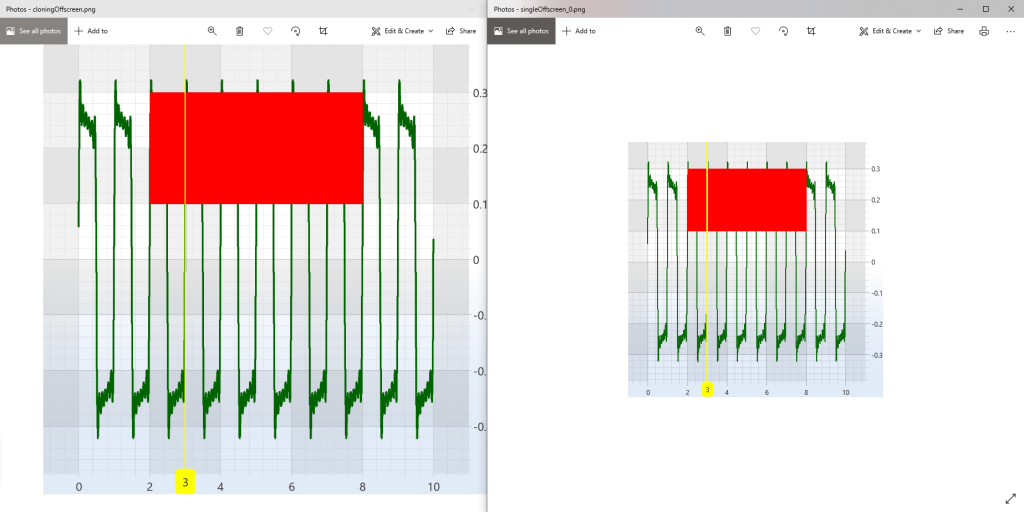
Export with Cloning
Allows exporting an image with a different size. When a user will be calling surface.ExportToFile(path, ExportType.Png, false, new Size(1200, 1200)), for example, will allow us to create a chart clone in code and then change its size. As the result, we can export a cloned chart of any size!
The difference between an original size chart export on and resized cloned chart export.
SС-5889 Fixed ArgumentOutOfRangeException with MVVM API when RenderableSeries collection is Reset
Other bugs fixed and improvements made in 6.4
Added AxisBase.AllowFastMath property, turned off by default. This makes single precision shader based coordinate calculation an opt-in rather than heuristic-based.
SC-5702 Fixed issue with formating CategoryDateTimeAxis to show Labels in TextFormatting format
SC-5148 Fixed broken StackedSeries rendering with Logarithmic Y axis
Implemented drawing of DigitalBands, DigitalMountains using 2 separate meshes for fill and lines. Fixes overlap issue
SC-5714 Fixed AnnotationBase sets IsHidden directly, which may cause broken one-way Bindings
SC-5704 Fixed the issue when only some Annotations were hidden after a click on the “Show/Hide” button
SC-5372 Fixed disappearing BoxPlot, ScatterSeries when switching from VXccelarator to HighQuality
SC-5369 Fixed hangs caused by switching to SoftwareRenderer and back to VXccelarator
SC-5693 Fixed freezes on the tab switch when Tooltips are shown
Fixed visual bug with PaletteProvider with DigitalLines and DigitalBands, DigitalMountains
SC-5724 FastMountainRenderableSeries disappears when LogarithmicNumericAxis is used as YAxis and VXccelarator is enabled
SC-5492 “Realtime Polar” – remove RubberBandZoom
Fixed bug in ProcessStackedColumnVertex, the Y and Height were swapped
SC-5723 Allowed multiple individually configurable Light Sources and selectable shading model. Created an example
SC-5683 Fixed wrong Redo in the “Simple Undo Redo” example after zoom-undo-scale-undo procedure
Fixed issue with inverted gradient in columns that shows in StackedBar chart
SC-5777 Added an example showing in-memory rendering to the Sandbox
SC-5766 Fixed missing PointMarkers from the second series of FastBandRenderableSeries when VisualXcceleratorEngine is disabled; Made PointMarkers from second series visible in non-Vxccel rendering
SC-5761 Fixed slow DrawLine(..) method with HighQuality
Fixed default NormalYValue with YValueSelector in LineDrawingProvider and PointMarkerDrawingProvider
SC-5763 Added an option to switch between PeakDetector mode and ordinary mode to FastUniformHeatmapSeries
SC-5659 Fixed issue with showing values for StackedSeries in SeriesValueModifier
Fixed the issue when RadarPolygonSeries would throw with VXccel
Fixed incorrect StrokeDashArray usage for Y1 line of BandSeries
SC-5894 Fixed drawing artifacts when Zoom to Extents
Fixed missing behavior of MaxHistoBarCandles
Fixed the issue when FontSize coulndt become zero
SC-5851 Updated BandDrawingProvider to support overridden Fill and Stroke from PaletteProvider
SC-5844 Fixed incorrect indexes across PaletteProviders for MountainRenderableSeries
SC-5797 Fixed issue when XAML style with DrawLabels=False is applied via AxisViewModel.StyleKey
SC-5856 Fixed default AxisTitleStyle which caused Binding Errors
SC-5659 Added SeriesInfoProvider to generate a SeriesInfo with data columns
SC-5659 Fixed issue with removing old AxisMarkers in SeriesValueModifier
SC-5941 Fixed issue in ClosedLines mode with VXccel
SC-5920 Fixed: Annotation AnchorPoints don’t have effect when export with Size
SC-5891 Fixed coordinate calculations when a chart is zoomed in
SC-5914 Fixed an issue in DashboardStylePolarCharts: series disappears if Renderer changes
SC-5919 Fixed size of Selected PointMarkers not preserved when export with Size
SC-5923 Fixed ErrorBars selection issues
SC-5929 Fixed examples where Modifiers didnt work on LMB
SC-5890 Fixed FastBandSeries – incorrect (stepped) semi-transparent fill
Fixed not supported BeginInvoke(..) for .Net Core platform
SC-5951 Fixed zero StrokeThickness issue for DigitalBand and DigitalMountain
SC-5905 Fixed corner issues in 2d columns shader
Fixed the single flashing frame issue
Engine update: added support for OBJ material libraries (loading obj models with multiple geometries, preparing obj loader to use load mutiple geomeries, a new string tools function)
SC-5891 Fixed clipping in case 2 lines are meeting outside viewport
Please ensure you uninstall the previous version(s) of SciChart before installing the latest version as this can prevent some issues in the upgrade process!
Pricing and Licensing
SciChart WPF v6.4 is free of charge to customers with an active Support-Subscription.
For new customers, please find our pricing at our store page.
If your support has expired and you would like to get access to the improvements & fixes in this release, contact-sales and we will prepare you a renewal quote.
We are pleased to announce that the SciChart iOS, macOS, and Android v4.3, has now been released! It includes a lot of improvements and bug fixes. It is recommended for all users of SciChart to update to the latest version! Please see more information below.
What is new in SciChart v4.3
Major Improvements
Improved axis label formatting used in trading charts on both Android and iOS:
This feature is extremely popular in financial and trading applications. When zooming the chart you can make the labels on x-axis automatically scale. This means that at a particular zoom level you can be showing years, but zooming in closer it will transform into months, dates, and so on.
Example: zooming changes from years to years and months labels on X-axis:
Example: zooming changes from months to month and dates labels on X-axis:
This is what has been improved:
made trade chart label formatter more declarative with ability to select formats and provide quite a bit nicer output
formatters now obey locale while formatting labels
added separate DateFormatters for axis labels and for cursor labels, those are encapsulated in SCITradeChartAxisLabelFormatter
removed defaultTextFormatting for CategoryDateAxis
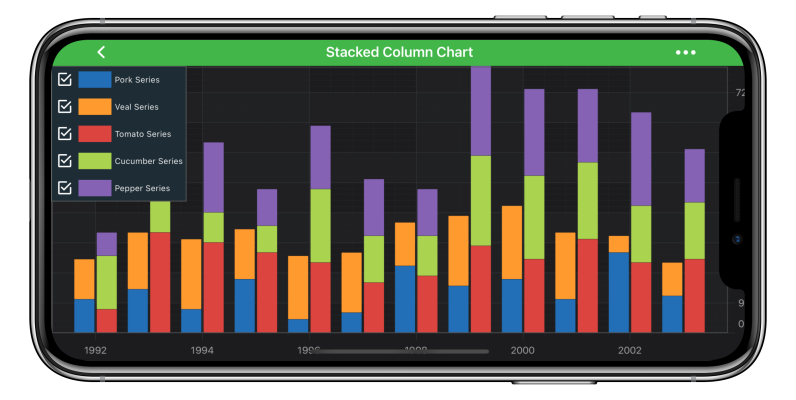
Stacked Series improvements for both Android and iOS platforms:
There has been a number of improvements and edge cases fixed that were reported by customers. One of the improvements allows having a proper legend for the stacked series chart, like in the example below.
Some other changes and improvements for stacked series include:
added `getYRange` implementation to fix Stacked Series range calculation issues (similar to `getXRange`)
fixed edge cases `SCILegendModifier` crashes with different Stacked Series combinations
added missing initialisers
fixed crash when there’s no visible series in `vertical collection` which is inside `horizontal collection`
fixed accumulation of vertically stacked series in different edge cases
consider only stacked series collection children as candidates for the legend, not the collection itself
Ability to modify an already existing SciChart theme
The functionality to amend the exciting SciChart theme was already in our Android version and is added to SciChart iOS library with the release of v 4.3. In the previous version of SciChart, the user had to copy the theme and then define all the keys, whether they have been changed from default ones or not. With this release, users can create themes “basedOn” parent SciChart already existing theme and override only the keys that need to be different.
Below you can see how we styled a chart using exciting SciChart Theme v4 Dark (on the left). We have changed line series and labels colors, also background color. MinorGridlines color is changed so they seem not visible at all, as well as axisBandColor is changed. This is a very easy way to give your chart the look and feel that your design requires!
Our team has been recently working on creating a financial charting component using SciChart iOS and SciChart Android. You can read about it in our blog post “Creating Native mobile Stock and Crypto Trading apps with SciChart – Preview“. Working on the iOS side we realized we can improve SciChart.framework consumption in the Swift world. Even though there is plenty of general knowledge about Objective-C to Swift and Swift to Objective-C interoperability we decided to go the extra mile and make improvements that are specific to SciChart iOS library.
SCIOS-1071 – fixed incorrect drawing of Axis GridLines and Bands when size of renderable series area changes
SC_DROID-802 -fixed `CategoryDateAxis` NPE when trying to convert date to index before label provider was updated
SCIOS-1063, SC_DROID-800 – fixed clearing of pie/donut segments when detaching legend modifier from the chart as well as optimise it (in both 2D and 3D)
improved implementation of `DefaultSeriesValueMarker`/`SCIDefaultSeriesValueMarker` to allow simpler override of its logic
added `IDoubleValueLabelFormatter`/`ISCIDoubleValueLabelFormatter` interface which defines methods for formatting double values
added this new interface into `ISCILabelProvider`/`ILabelProvider` to prevent boxing/unboxing when formatting axis labels in `updateTickLabels`
added possibility to override callback for `IsPrimaryAxis` property in `AxisBase`/`SCIAxisBase`
SciChart Android:
fixed bug in PinchZoomModifier which led to division by zero if delta was equal to zero
fixed missing SeriesValueModifier annotations if using yAxis with non-default AxisId
fixed moving of axes annotations between axis modifier surfaces when changing axis ids in annotation
fixed dragging in annotation examples because of incorrect coords from CategoryDateAxis
changed updateCurrentPoint() signature in MasterSlaveTouchModifierBase to allow override of isMaster flag;
SC_DROID-804 – fixed typo in RenderableSeriesProviderBase when isAttached was set to true instead of false on detach()
added new methods for searching and getting double value in ISciList
added methods to CategoryDateAxis for conversion Date to point coordinate and vice versa instead
added per-point interpolation in ColorMap
added onDataSeriesChanged() call when setting DataSeries for RenderableSeries;
optimized code in CategoryLabelProviderBase to make it more thread-safe
improved MotionEventManager implementation to better support case when motion events should work between charts
updated code for rendering triangle point marker to make edges rounded
applied proper blend mode for drawing sprites to correctly render tick labels on white background
changed SciChartSurfaceBase to allow replacing default IPublishMotionEvents source which is passed with services
deprecated getPointRelativeTo() in IReceiveMotionEventGroup (this transformation moved to ModifierTouchEventArgs and performed relative to original source of event)
SciChart iOS / macOS:
SCIOS-1065 – fixed unable to customise SCIPieChartTooltipModifier tooltips issue
SCIOS-1068 – fixed axis tooltips issue of drawing without background and content cutting on Mac
SCIOS-1081 – fixed drawing NSAttributedString with baselineOffset attribute
SCIOS-1080 – fixed issue with the check SCIDrawableText size before drawing because TSRMetalTexture size can’t be zero.
SCIOS-977 – fixed point markers, axis labels drawing to omit artefacts on edges
SCIOS-1079 – fixed calling wrong ISCIDataDistributionCalculator methods on ISCIDataSeries append/insert/update
SCIOS-1074 – fixed issue of update range with NSDate, not double in SCIListDate
SCIOS-988 – fixed issue when palette provider didn’t work with SCIFastBubbleRenderableSeries
SCIOS-1073 – fixed SCIView methods isPointWithinBounds worked incorrectly
SCIOS-1087 – fixed unexpected border line in SCIChartSurface on certain iOS devices
fixed blending mode while drawing triangle strips
fixed SCRTTextureBrush which should take opacity into account
fixed color interpolation in SCIColorMap, added convenience initialisers in color extensions
SCIOS-1061 – added drawRoundedRects API to the ISCIRenderContext2D
SCIOS-1076 – added improvements in unsorted data, added unsortedDataException to onUpdateXValues method
improved SCIDateValues APIs, especially for Swift
improved texture mappingMode to PerScreen to match Android and allow drawing line series with gradient style
improved SCICollectionChangedEventArgs where new and old items should be readonly which also natively improves Swift API
improved add\remove observer in SCIObservableCollection – now they obey to it’s collection generic type
added missing weak/strong declarations
used const float * pointers in ISCIRenderContext2D for drawing methods, to declare that memory should not be modified and better Swift interoperability
improved and made ISCIValues and it’s implementors more strict and Swift friendly
made annotation resizing grip index a SCIAnnotationPointIndex extensible enum
used callback instead of protocol for SCIPieChartSurfaceRenderedListener, same as in SCIChartSurface
Where to get SciChart iOS / macOS / Android v4.3?
You can get SciChart iOS, macOS and Android from Downloads pages.
Separately you will need to download the Cross-Platform Licensing Wizard, required to activate and license SciChart Mobile SDK v3 and higher.
It’s my great pleasure to announce today we are releasing SciChart.js version 2.0-Beta. This version is a HUGE upgrade to our already powerful & feature rich JavaScript chart library, which we’ve worked hard on for the past 6 months or so this year.
We’ve compiled a “What’s New” list below. Take a look through, and then we recommend you try it out for yourselves. SciChart.js version 2 brings a host of new features and improvements to the library and is a massive upgrade for users of our WebGL / WebAssembly powered JavaScript & Typescript charts.
What’s New in SciChart.js v2.0?
Where do we start? Let’s go through the features one by one:
1. Series Selection
We’ve added Series Selection on click, and Hover events to SciChart.js v2.x. With the new SeriesSelectionModifier, you can get notified if a user clicked or hovered a series, and make some visual changes such as changing or animating series style.
We’ve also added Datapoint Selection into SciChart.js v2.x. You can now click select individual datapoints, drag to select multiple datapoints, get notified on click and display visual feedback. To use this feature, add a DataPointSelectionModifier to your chart.
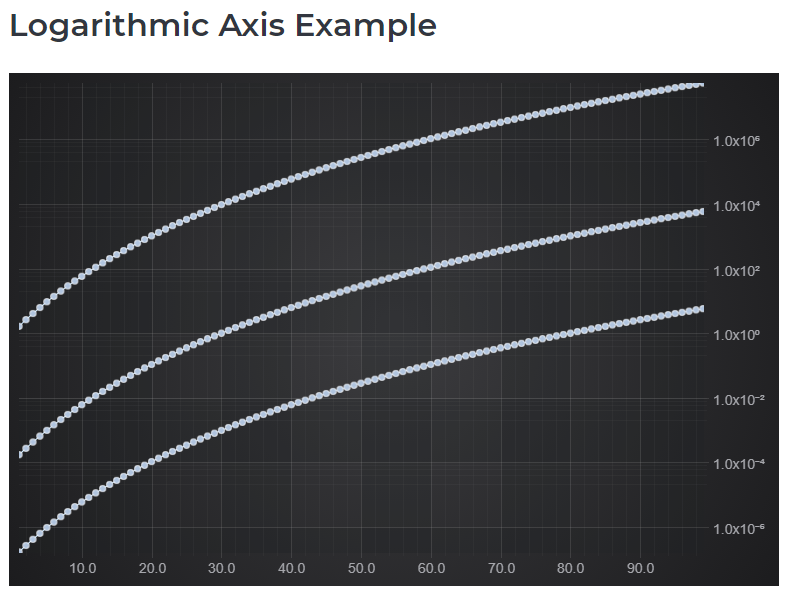
Another hotly requested feature, we’ve added a Logarithmic Axis to SciChart.js v2! Display charts with a logarithmic scale, on either X or Y axis, with a user-defined base. For example Log(10) charts, Log(e) for scientific applications or Log(2) for finance & trading.
You can specify the label format to display scientific notation with superscript, engineering notation or N-significant figures. Major and minor ticks can be displayed in linear or logarithmic scale.
We’ve added further customisations to the axis in SciChart.js v2. You can now place an X,Y axis in the center of the chart to create oscilloscope like graphs, or inside the chart as opposed to fixed on the outside of the chart area. Placement of the axis is fully customisable.
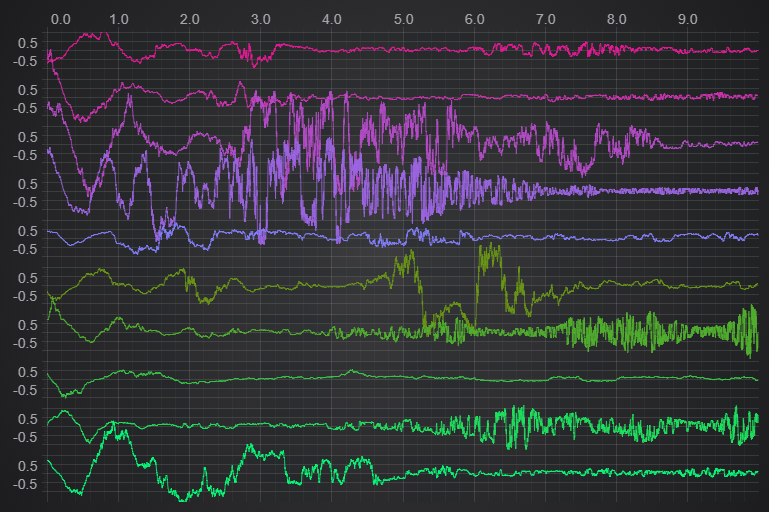
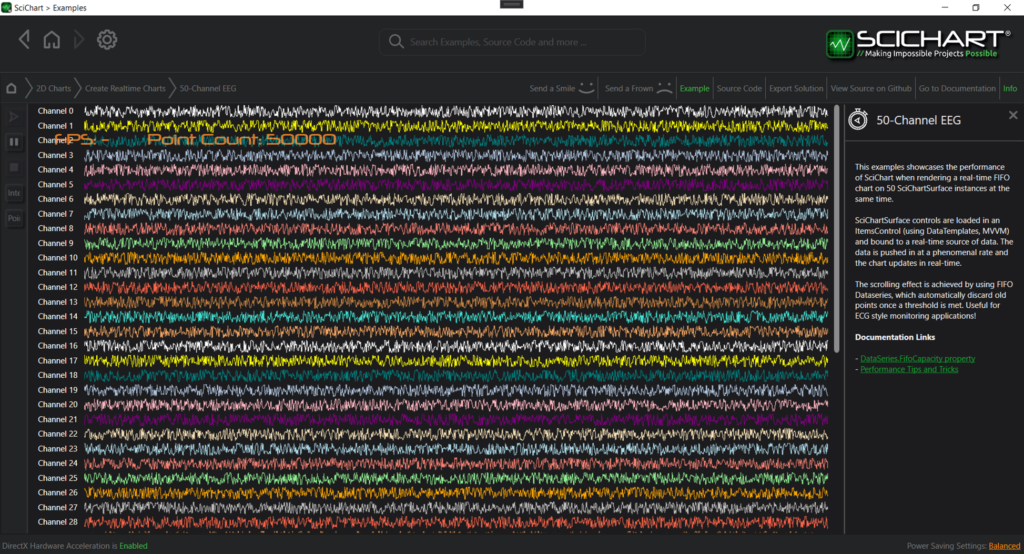
There’s another axis customisation which we’ve added! Vertically Stacked Axis allows you to change the layout of axis panels.
Instead of left to right for Y-Axis, you can now layout several axis top to bottom. This gives you layout options like this where a single chart has mutiple traces with it’s own Y-Axis, but the traces are stacked one on top of each other.
Perfect for EEG / ECG like charts where you want to display several overlapping traces on a single SciChartSurface.
There are now several ways to customise axis labels in SciChart.js v2.
SciChart now supports rotated axis labels, multi-line axis labels and even image labels. All this and more is possible via our Custom LabelProviders API.
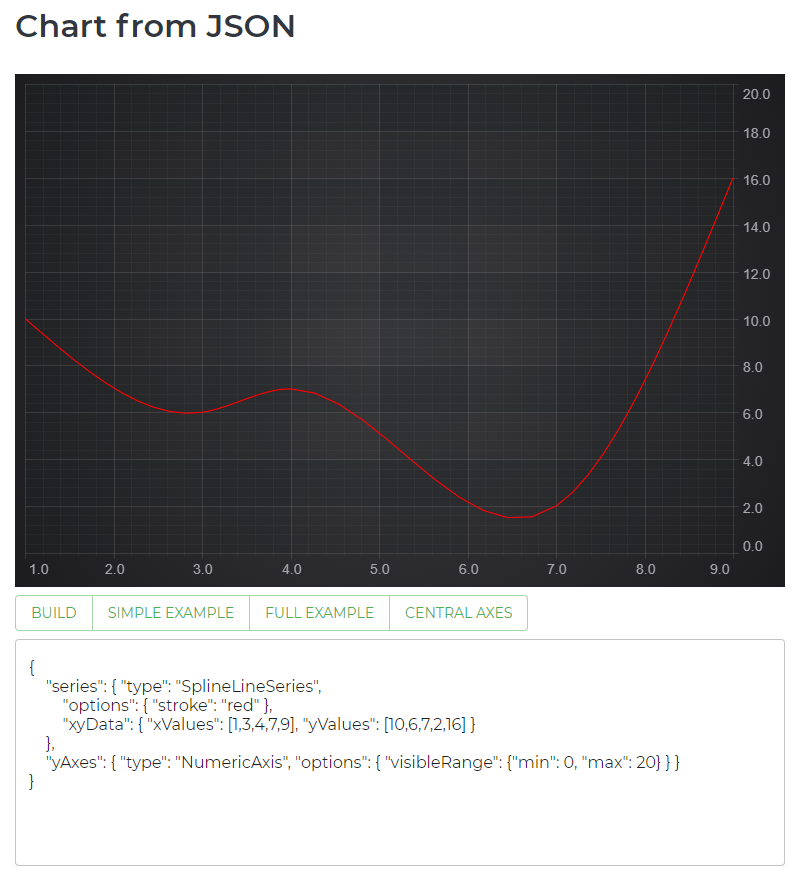
A brand new API in SciChart.js – the Builder API – allows you to construct charts with a JavaScript object definition.
API code like this allows you to create charts, set series, data, axis types, even interactivity modifiers.
// Using the Builder API to construct a chart with X,Y axis, line series, light theme and zoom pan modifier
const { sciChartSurface, wasmContext } = await chartBuilder.buildChart(divElementId, {
     surface: { theme: { type: EThemeProviderType.Light }},
     series: {
		 type: ESeriesType.LineSeries,
         options: { stroke: "blue" },
         xyData: {
             xValues: [1, 3, 4, 7, 9],
             yValues: [10, 6, 7, 2, 16]
         }
     },
     yAxes: {
         type: EAxisType.NumericAxis,
         options: {
             axisTitle: "Number of things",
             visibleRange: new NumberRange(0, 20),
             labelPrecision: 0
         }
     },
     modifiers: [
         { type: EChart2DModifierType.Rollover },
         { type: EChart2DModifierType.ZoomPan }
     ]
 });
The Builder API is a layer built on top of SciChart.js programmatic API. It’ll be a lot more familiar for JavaScript developers and will allow some neat tricks, such as specifying and re-using chart definitions which will make React / Vue / Angular, or client-server apps easier to build with SciChart.js.
The Builder API also allows JSON Serialization / Deserialization. It is now possible to construct chart definitions including data server-side, and reconstruct the SciChart.js chart client side.
SciChart.js v2.x now features a PointMetadata API, comparable to our iOS Android and Windows charts. This API allows you to tag some or all x,y datapoints with a custom object.
Data can now be in the format X, Y, {Object} which allows you to store additional metadata on x-y data points. Metadata can then be routed through to Tooltips, Hit-Test or PaletteProvider.
For example, if you click or hover a point you can get this metadata object back which allows you to do more complex interactions with the chart when linked to external datasets.
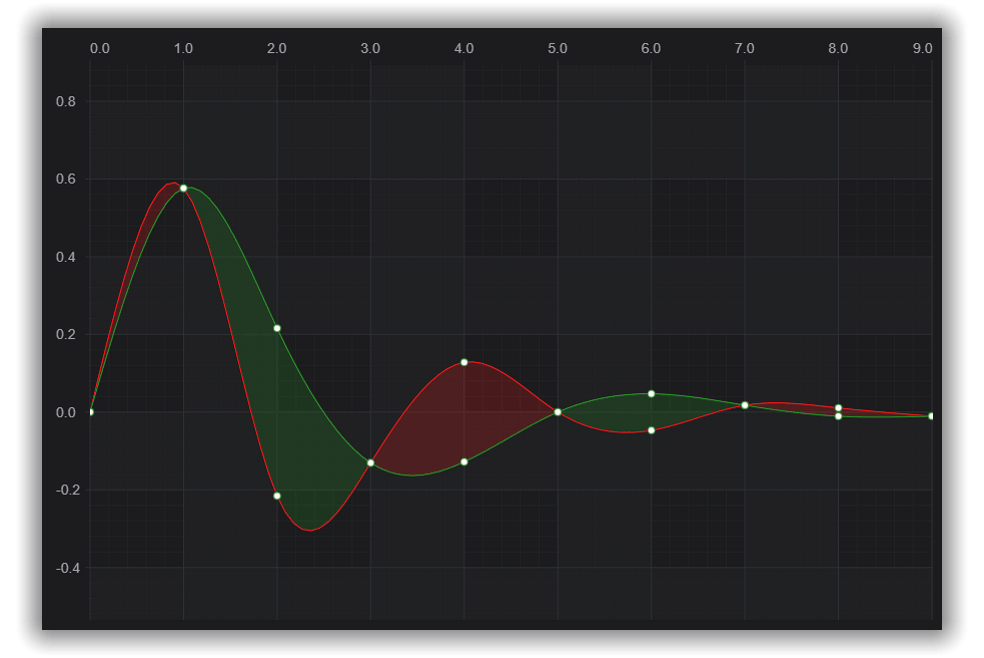
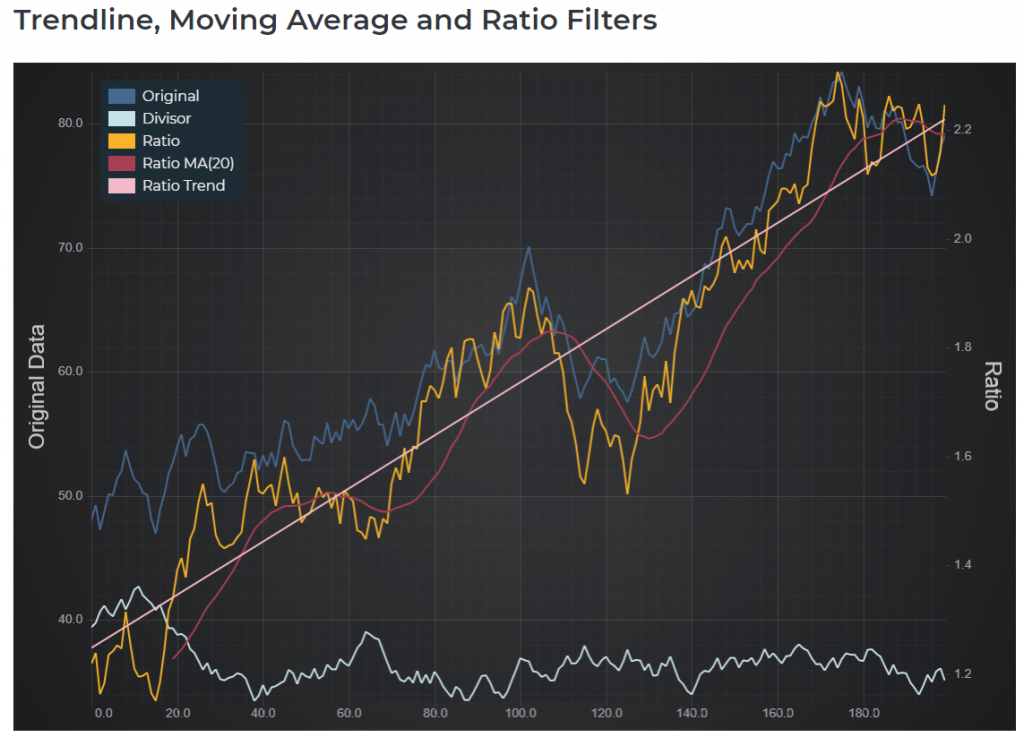
SciChart.js now features a Filters or Data Transforms API. This allows you to add data transforms such as Linear Trendlines, Moving Averages, Scale/Offset, or Ratio of two DataSeries to your chart.
Filters automatically update when the underlying data changes, making it easy to apply transforms to your data.
What’s more, you can create custom filters easily if you wanted to add any other kind of behaviour.
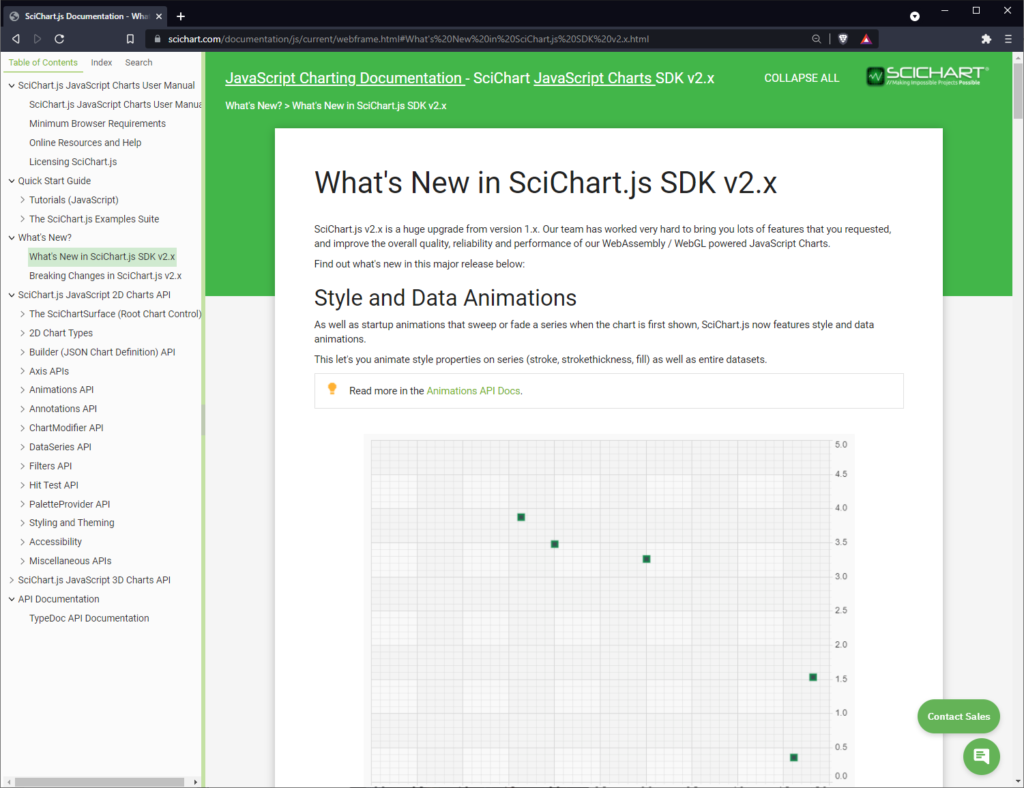
As well as start-up animations that sweep or fade a series when the chart is first shown, SciChart.js now features style and data animations.
This let’s you animate style properties on series (stroke, stroke thickness, fill) as well as entire datasets.
For example, animate one entire dataset (x,y values) to another. You can animate the stroke colour, line thickness or fill colours of a series. You can even animate the point marker being displayed.
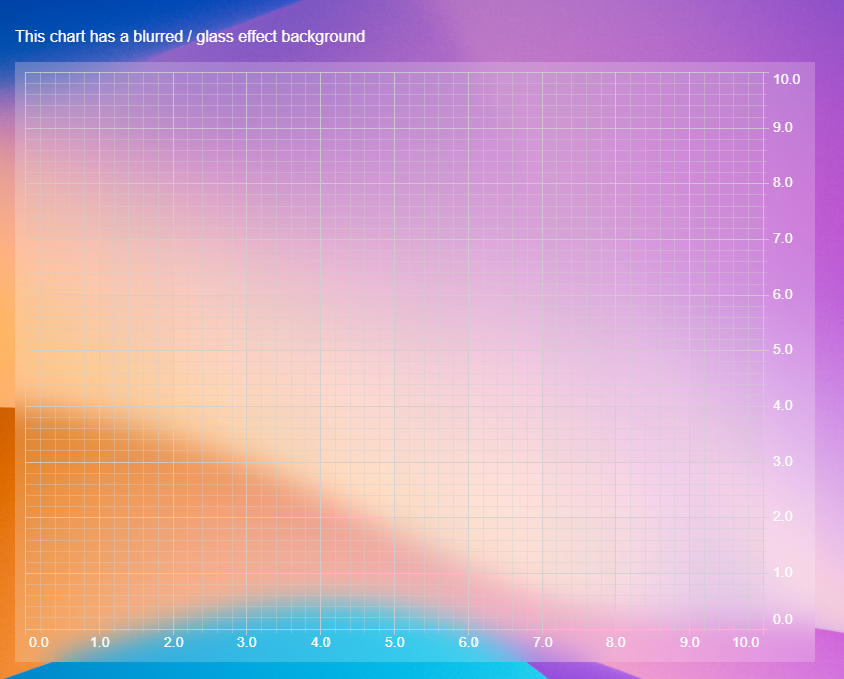
12. Transparent, Image or Blurred/Glass Backgrounds
In SciChart.js v2.x, we’ve completely re-written the way we composite WebGL powered JavaScript Charts onto the HTML page, allowing you to now create charts with transparent backgrounds, image backgrounds or even blurred/glass effect backgrounds.
More styling & Theming changes in SciChart.js v2.x, you can now style the wait-loader, displayed when the chart initially starts up.
Styling options include simple changing of foreground & background colours, right through to customizing the DOM which is displayed as the chart loads for the first time.
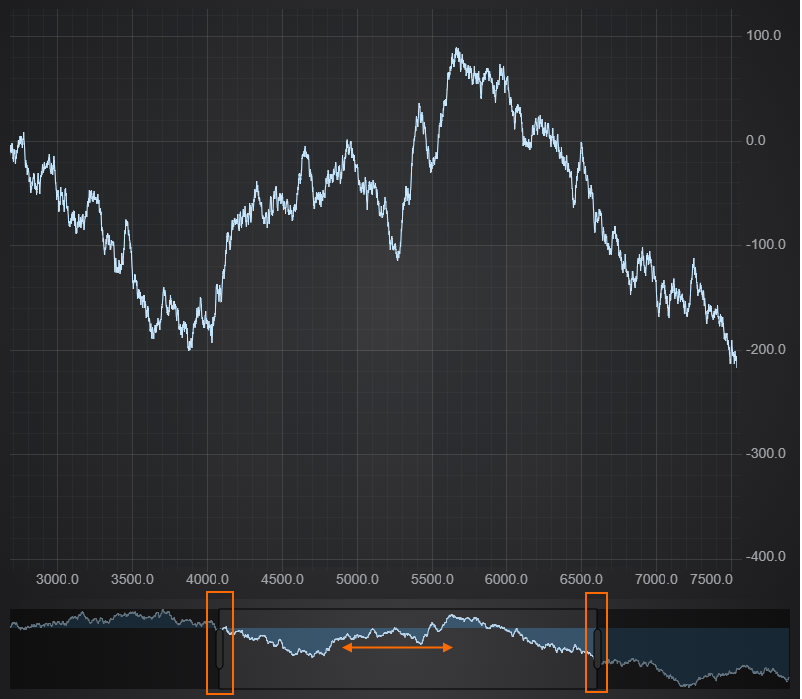
After requests from our userbase, we’ve added the SciChartOverview control to SciChart.js v2.x.
The SciChartOverview is a Scrollbar control which lets you see an overview of your dataset, and scroll left/right at the touch of a button.
It works on vertical or horizontal charts, you can customize what series get displayed behind the overview, and customize the look & feel of the scroll grips and selection rectangle too.
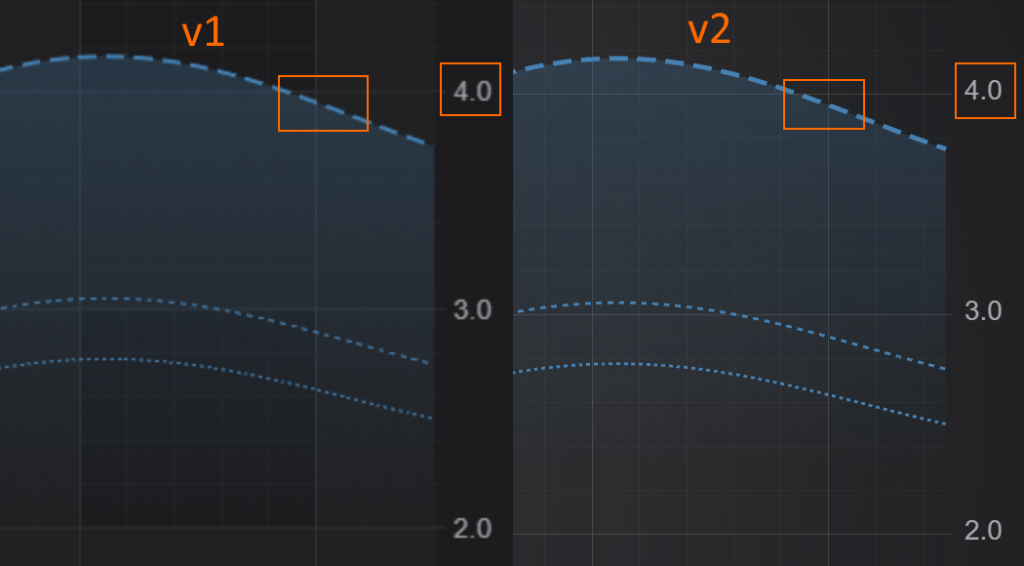
15. Retina / High DPI Display / Browser Zoom Support
SciChart.js v2.x now supports sharp graphics on high DPI / Retina displays, as well as Browser Zoom functionality.
Previously in SciChart.js, retina displays would look low quality, and when the browser is zoomed the image that SciChart renders to would simply be scaled. In SciChart.js v2, every element is now rendered at the native resolution and scaled down for display. This results in the following benefits:
Lines, strokes, shapes now look sharper and clearer on higher DPI displays or when browser is zoomed
Text is rendered at a higher resolution. Text scales with browser zoom (good for Accessibility)
Stroke line thickness increases with Browser Zoom
Take a look below to see some comparison images side by side of SciChart.js v1 vs. v2 at 200% Browser zoom in Chrome.
Guess what, we’ve also added a way to natively put text labels onto an axis.
The TextLabelProvider provides text labels rather than numeric. Specify text labels as an array with a mapping and our library displays them on the axis. This also features a rudimentary word wrapping algorithm for long labels.
We’ve made multiple improvements to the Hit-Test API, allowing for greater control over what a hit (click) means on the chart.
You can now listen to mouse events and clicks on the chart and determine if the user:
Clicked on a series segment (e.g. column body, candle body, line series segment)
Clicked on an X-Y data-point
Finding the nearest point using X-first (for timeseries) or X-Y distance (for scatter series)
The Hit-Test API returns an object which describes which points or series were under or nearest the mouse, and may be used for getting click notifications on chart series, implementing drill-downs, custom interactions or behaviours and more.
We’ve made lots of improvements into SciChart.js, including:
improving overall reliability
helpful error messages in the JavaScript console
improvements to the usability of APIs
improvements to documentation and examples
.. plus much more.
If you’re an existing user of SciChart.js or you’ve tried it out in the past, download SciChart.js v2 now and try it out! We would love to hear your feedback!
Breaking Changes
They say you can’t make an omelette without breaking some eggs. In order to bring you this major upgrade to SciChart.js v2.x we’ve had to introduce some small breaking changes to the API.
As a result, SciChart.js v2.x is not fully backward compatible to SciChart.js v1, however we’ve tried to keep disruption and changes to the bare minimum. Most apps will Just Work with SciChart.js version 2.
We’ve published a full list of breaking changes to our Documentation Here.
To reflect the huge value in in this upgrade to SciChart.js, we’ve made a small change to our pricing & licensing. New Pricing for SciChart.js can be found below. This will be effective upon launch of the new version:
SciChart.js 2D Charts: Was $999, Now $1,299
SciChart.js 3D Charts: No Change
Bundle 2D / Bundle SDK / Bundle Enterprise: No Change
Existing customers with an active support & updates subscription will get the update for FREE. We are also able to provide 1, 2 and 3-year subscription renewals if you would like to lock in pricing for longer term projects.
Where to get it
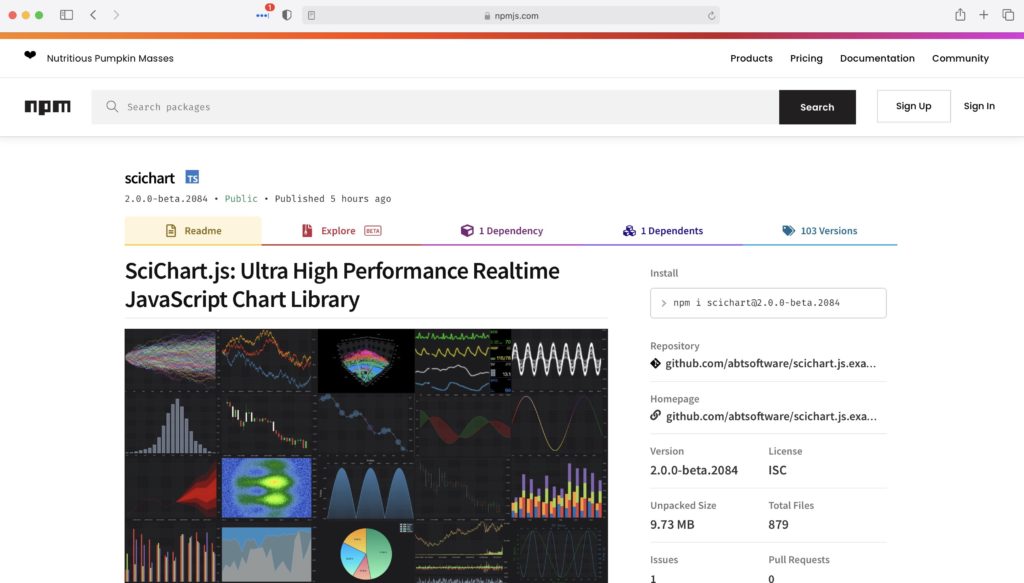
We’re in the process of packaging SciChart.js v2 for release now, but in the meantime you can get it straight from npmjs by using this script:
npm install scichart@2.0.0-beta.2084
And Finally
… That was a huge piece of work and special thanks go to our JavaScript / WebAssembly / WebGL team for making this massive improvement to SciChart.js.
Finally we also want to thank our customers who have supported us since SciChart.js v1 was released and we hope to see more and more of you use our awesome JavaScript Charts SDK in the future!
We’re delighted to announce SciChart.js v2 has now completed it’s BETA testing phase and is now released!
What’s New in SciChart.js Version 2?
The amount of features & improvements in SciChart.js Version 2 is absolutely huge!
We’ve compiled a list over at the page What’s New in SciChart JS SDK v2. Take a look! There are seventeen new features and many improvements to our High Performance JavaScript Chart library.
Bugs fixed since the BETA
The team has squashed the following bugs reported since the BETA went live:
Builder API now supports stacked axes
Improved rollover modifier tooltip positioning
Legend now supports wrapping and is easier to customise
Improved handling of select and resize of overview annotation
Option to drag horizontal and vertical line annotations by their axis label
Fix Annotation dragging when using vertical charts / flipped coordinates
Fix Error if Logarithmic x-axis used with no data
Fix performance issue if tick settings would result in too many labels.
Fix RubberBandXyZoomModifier only honours EXyDirection.XyDirection
Fix AxisMarkerAnnotation shows wrong value for vertical chart
Fix Annotation Adorners not being cleared
Fix delete was unsubscribing from some events, causing JavaScript memory leaks
If you have any bugs to report, you can do so by emailing support@scichart.com directly. Please include steps to reproduce with all bugs and code samples or images/video if applicable.
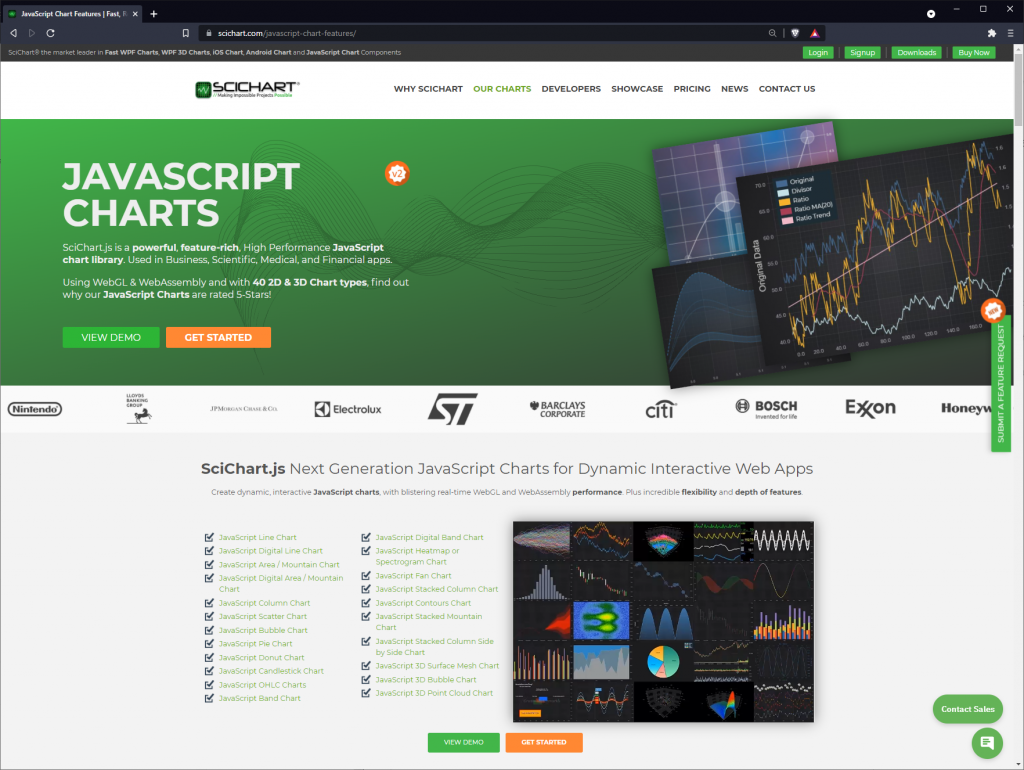
Updated Features Page for SciChart.js version 2
With a new SciChart.js our Features page needs a new look! If you’d like to see the powerful features at-a-glance of our JavaScript 2D/3D chart library, head on over to scichart.com/javascript-chart-features.
This has links to the Online Demo and Getting Started pages so this is the first place to look if you want to learn more about SciChart.js
Pricing & Licensing
Existing customers with an active support & updates subscription will get the update for FREE.
For developers using vanilla JavaScript (no Node Package Manager), you can load SciChart.js directly in browser. Add this script to your Html head and away you go.
// Add this script to head
<script src="https://cdn.jsdelivr.net/npm/scichart@2.0.2115/_wasm/scichart.browser.js" crossorigin="anonymous"></script>

// Now Configure SciChartSurface in code to load the wasm file from CDN
SciChart.SciChartSurface.configure({
    dataUrl: "https://cdn.jsdelivr.net/npm/scichart@2.0.2115/_wasm/scichart2d.data",
    wasmUrl: "https://cdn.jsdelivr.net/npm/scichart@2.0.2115/_wasm/scichart2d.wasm"
});
// Now create a SciChartSurface as you would normally!
const { sciChartSurface, wasmContext } = await SciChart.SciChartSurface.create("div-id");
Developers – Getting Started Guides
We’ve collected all the links to help you get started under scichart.com/downloads. Go there and take a look. If you have any questions just ask!
We are pleased to announce that the SciChart WPF v6.5 build TODOhas now been released! This update includes a number of excellent new features, lots of stability fixes and performance & memory enhancements. This release is a drop-in replacement for 6.x and it is backward compatible for users of SciChart WPF version 6.
What’s New in SciChart v6.5?
Windows 11 Officially Supported
It’s always pleasant to bring SciChart to new platforms and runtimes. Even though in most cases SciChart WPF ‘Just worked’ on the latest version of Windows, we are delighted to announce SciChart WPF v6.5 now has official support of Windows 11. More to come later!
SciChart WPF now officially supports Windows 11!
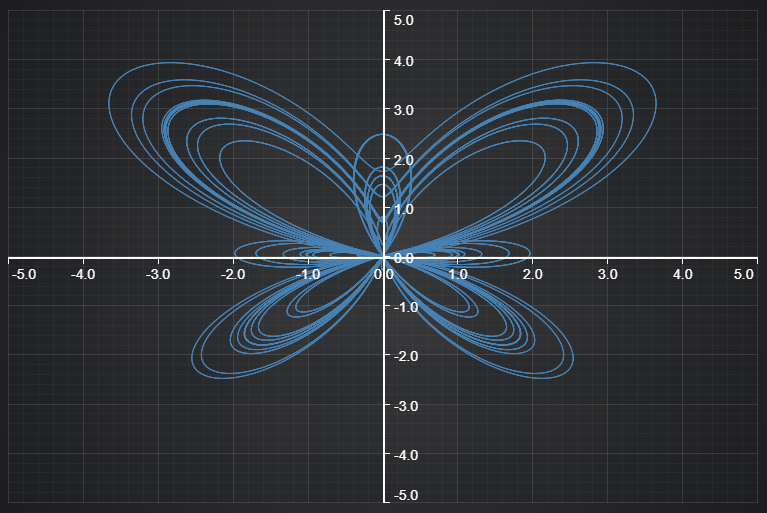
Parallel Coordinate Plot Chart Type
A feature request from an enterprise customer – we’ve added a Parallel Coordinate Plot to SciChart WPF. This is a chart type used for visualizing and analysing multi-dimensional statistical datasets. For example, it can be used to compare several sets of observations (represented by lines) of a combination of different factors (each represented by an axis) to find and visualize relationships between them.
In SciChart, the Parallel Coordinate Plot is represented by a new Control type called SciChartParallelCoordinateSurface. It is capable of rendering thousands of series or records, connected either by straight lines or splines. It is possible to have multiple Y-Axes representing different categories, each with a corresponding scale. Series may be selected. Individual styling of Y-Axes is also supported. Zooming, panning and Series selection is provided by corresponding ChartModifiers.
SciChart WPF now supports a Parallel Coordinate Plot through the SciChartParallelCoordinateSurface type
New Uniform Data Series type
Another feature hotly requested on our Feature Request System. We’ve created a brand-new Data Series type called the UniformXyDataSeries. This uses Y-values only and assumes a fixed-stepping for X-Values. This saves 50% of the memory required in the most performance-intensive and demanding applications where data is sampled from data acquisition hardware, sensors or logic analysers.
The UniformXyDataSeries has already been road-tested in an application we built for a customer, which had to display up to Tens of Billion Datapoints of acquired binary and analogue data from a Logic Analyzer.
The UniformXyDataSeries is performant into the tens of billions of data-points for static datasets. With our templated DataSeries types it supports float, double, byte, short, int or long types, with a fixed stepping computed by sample number and step size.
Note:This series type has not yet been optimised for real-time but we plan to do that soon! When we have, we will be updating you with how to use it.
Digital (Logic) Analyzer 64-Billion Point Performance Demo
To show you the speed & power of the UniformXyDataSeries we’ve created a new demo – the Digital Analyzer Performance Demo.
Modelled after a generic “Logic Analyzer” application it shows how SciChart is capable of displaying tens, hundreds of millions of even tens billions of datapoints of digital data acquired from Data Acquisition hardware, sensors, telemetry or logic analysers for this special case of time series with evenly spaced X-values.
Run the example by running the SciChart WPF Examples Suite -> And searching for ‘Digital Analyzer’
Here’s a video below of me running the Digital Analyzer Demo with 64 Billion Datapoints of digital data, all on a mid-level workstation with 64GB RAM and 6-core processor.
In fact, we’ve tested this up to 100 Billion data-points on powerful workstations (requires 128GB RAM).
SciChart is very capable for this kind of extreme big-data visualization in logic or hardware analysers, digital analysers or data acquisition hardware. No tricks, no if’s, no buts. We’ve worked hard to ensure every step of our graphics pipeline is fully optimised, using low-level gaming technology to achieve our incredible fast performance.
Shared Render Timer
Some applications such as those with tens or hundreds of charts, or applications with SciChart WPF hosted inside WinForms or Win32 suffered from performance problems due to scheduling of our rendering on WPF’s UI Thread.
To solve this problem we’ve introduced a new SharedRenderTimer that allows to sync rendering between multiple SciChartSurfaces. It can be enabled or disabled by setting static RenderSurfaceBase.UseThreadedRenderTimer property anywhere in your code.
It is demonstrated in the “50-Channel EEG” example in our Demo App, which contains a ListBox with 50 SciChartSurfaces that are updated simultaneously.
Use of the SharedRenderTimer can improve performance significantly in apps with tens or hundreds of WPF charts by ensuring one shared redraw timer on a background thread
Use of the SharedRenderTimer can improve performance significantly in some apps but is not recommended for default operation. If in doubt, contact our helpful, knowledgeable tech support team who will advise you how best to use SciChart in your application.
Important Fixes & Improvements in v6.5
SC-5964 Fixed an AccessViolationException crash when Axis Font is changed
SC-5864 Fixed incorrect drawing of PointMarkers with selected PointMarkers
SC-6139 Fixed some crashes in 2D examples in Demo App
SC-6039 Improved export of SciChartSurface so it works consistently in all cases
SC-5995 Improved VxRenderSettings – handling of memory buffers allocation, especially low-memory scenarios such as some on-board GPUs or Intel GPUs
SC-5762 Fixed saving and loading of TradingAnnotations
SC-6125 Implemented null-reference checks through unmanaged classes. These sometimes got Disposed but still called resulting in AccessViolationExceptions randomly in code. This fix will greatly improve stability of SciChart WPF
SC-6220 Fixed MarketProfile mode in FastHistobarRenderableSeries – correct Ask and Bid volumes are passed to HistobarPaletteProvider now
SC-5970 Improved OscilloscopeDemo: Rollover and Tooltip modifiers cannot be disabled
SC-5966 Fixed issue when changing MinorsPerMajor property on a TimeSpanAxis had no effect
SC-5959 Improved XPS export – axes do not contain bitmaps in exported image
SC-5963 Fixed FastBandRenderableSeries Fill not working with HighSpeedRenderer depending on the floating values
SC-5799 Fixed AnnotationCreationModifier, which didn’t preserve position of first point if chart is zoomed/panned during Annotation creation
SC-5980 Fixed DataPointSelectionModifier.AllowMultiselection property. Now it allows selection of data points from different RenderableSeries simultaneously
SC-6093 Allowed having Triggers in DataTemplate for SciChartGroup Panes
SC-5450 Fixed an issue with small-value OHLC bars not visible with VXEngine
Fixed setting of the Image inside RenderSurface to avoid misalignment of gridlines and ticks by setting proper Stretch mode
Fixed case when SciChart didn’t fallback to software renderering on some Virtual Machines that resulted in a crash
Added ability for SciChart to work on Virtual Machines with hardware acceleration turned off
SC-5925 Added UseInterpolation option to Rollover menu in Toolbar
SC-5970 Fixed OscilloscopeDemo: Rollover and Tooltip modifiers cannot be disabled
SC-5924 Fixed Toolbar Menu placement in Demo App
SC-6030 Improved “Drag Area to Zoom” example for consistent look & feel with other examples
SC-6044 Fixed Watermark Annotation in “Annotations are Easy!” example. It was barely visible
SC-6189 Used SharedRenderShedulerTimer in “50-Channels EEG” example
SC-6114 Updated some examples in ExamplesDemo to showcase UniformXyDataSeries
We have also added a huge number of tests for covering new features, improvements and updated documentation.
We have re-tested performance across a variety of chart types & features. SciChart WPF is still to our knowledge, the World’s Fastest WPF chart component, allowing for an order of magnitude or more performance gain against even the strongest competitor, when tested in a number of challenging and varied real-world use-cases.
With SciChart WPF, you can be confident you are buying the best WPF chart on the market. Not only best performing in a variety of real-world use cases, but also the best API to work with, certainly the friendliest and most helpful staff when you need help
Where to get SciChart WPF v6.5?
SciChart WPF v6.5 is available by:
Downloading the installer from our scichart.com/downloads page
Using Install-Package or Update-Package from Nuget
By cloning and compiling the examples source code on Github.
By cloning or downloading the SciChart source code on Github (source code customers only)
Please ensure you uninstall the previous version(s) of SciChart before installing the latest version as this can prevent some issues in the upgrade process!


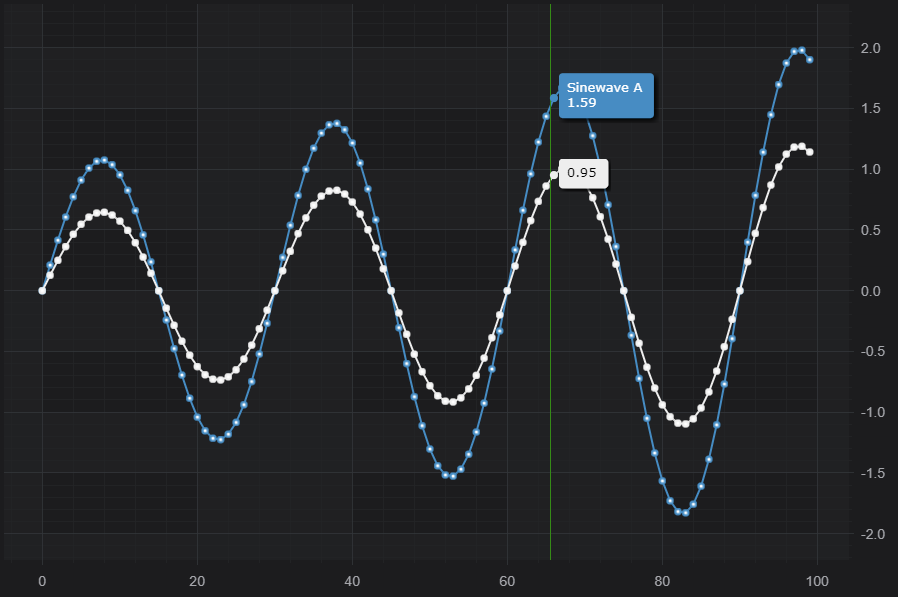
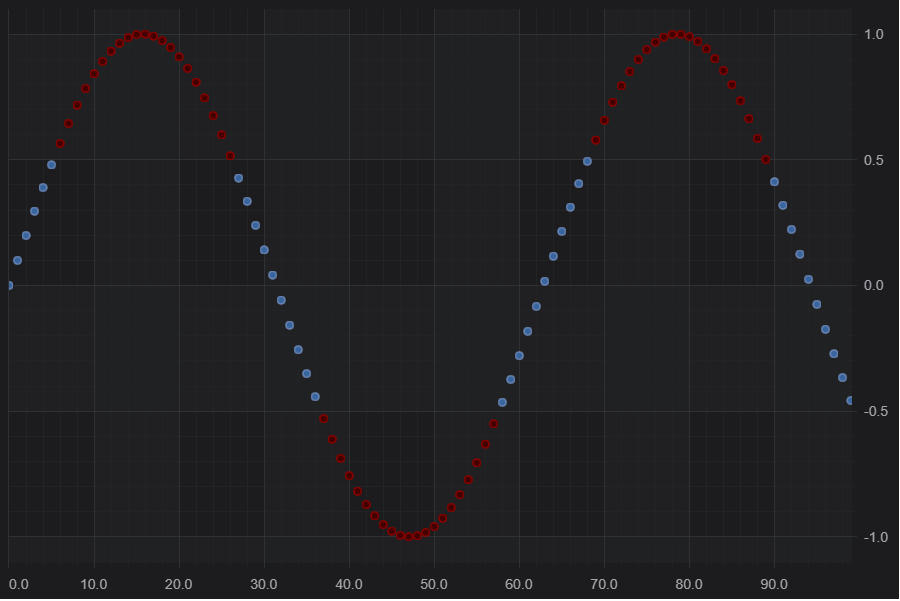
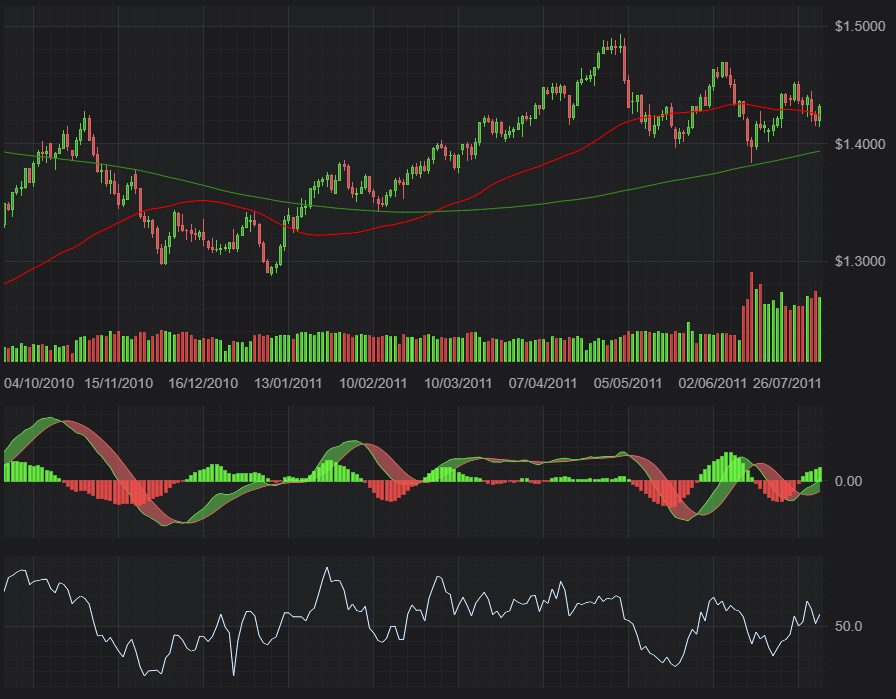
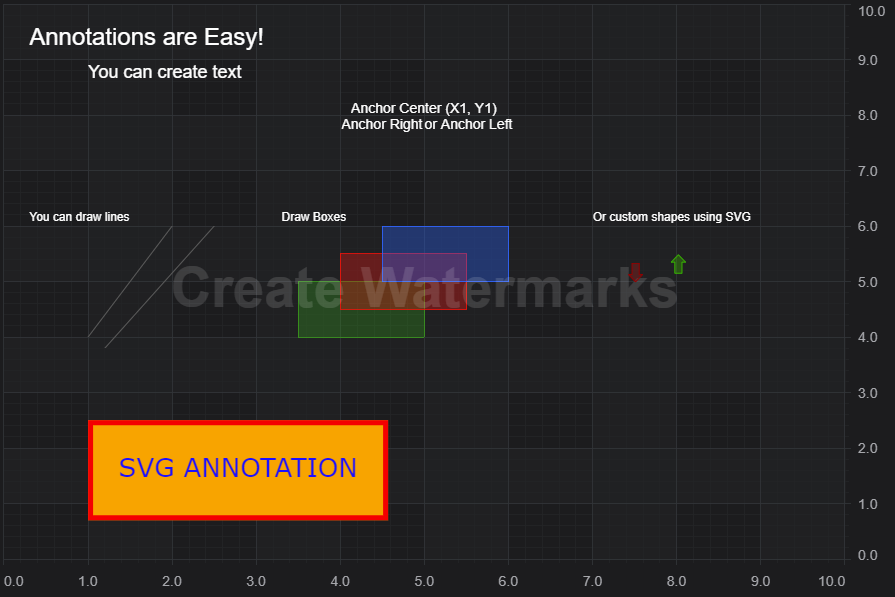
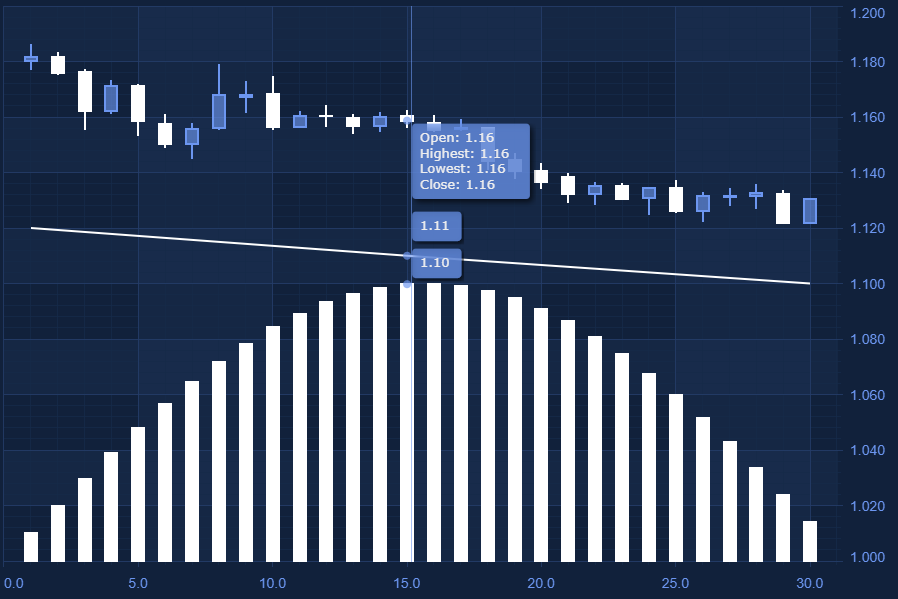
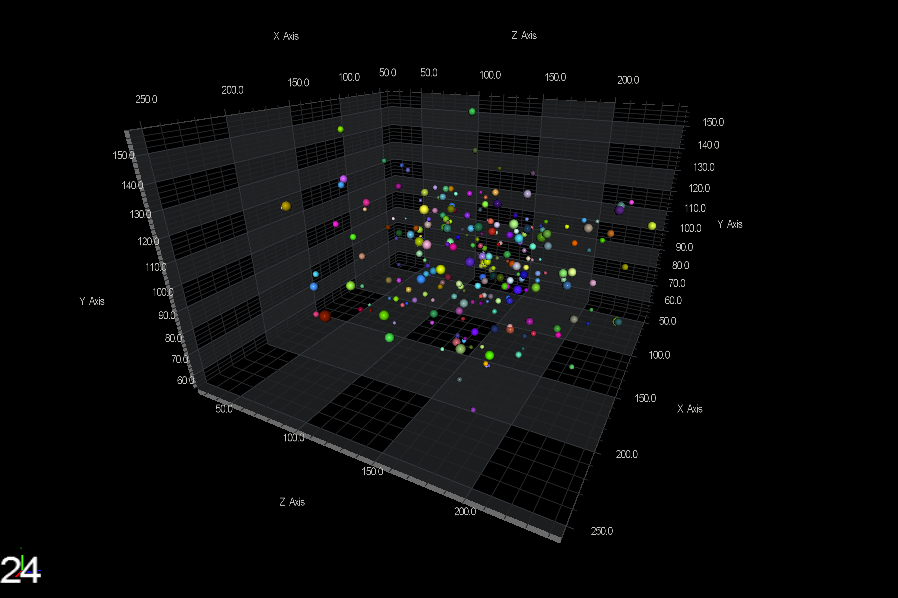
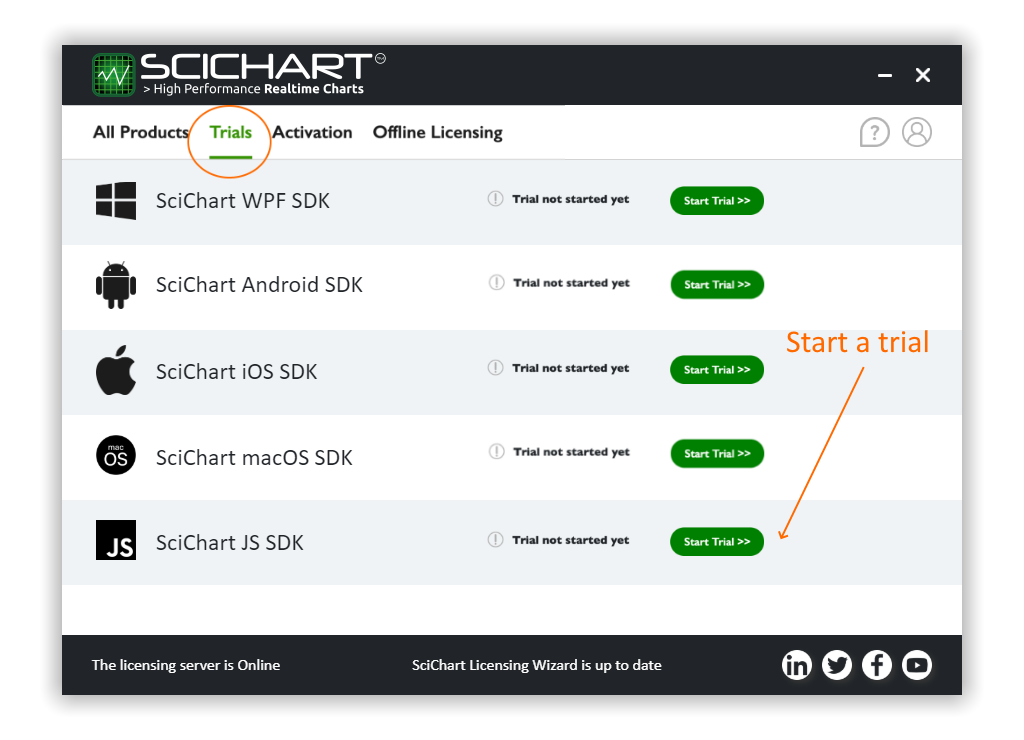
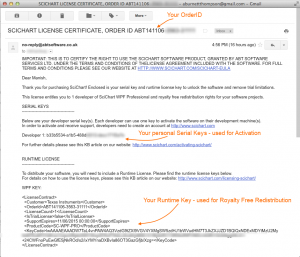
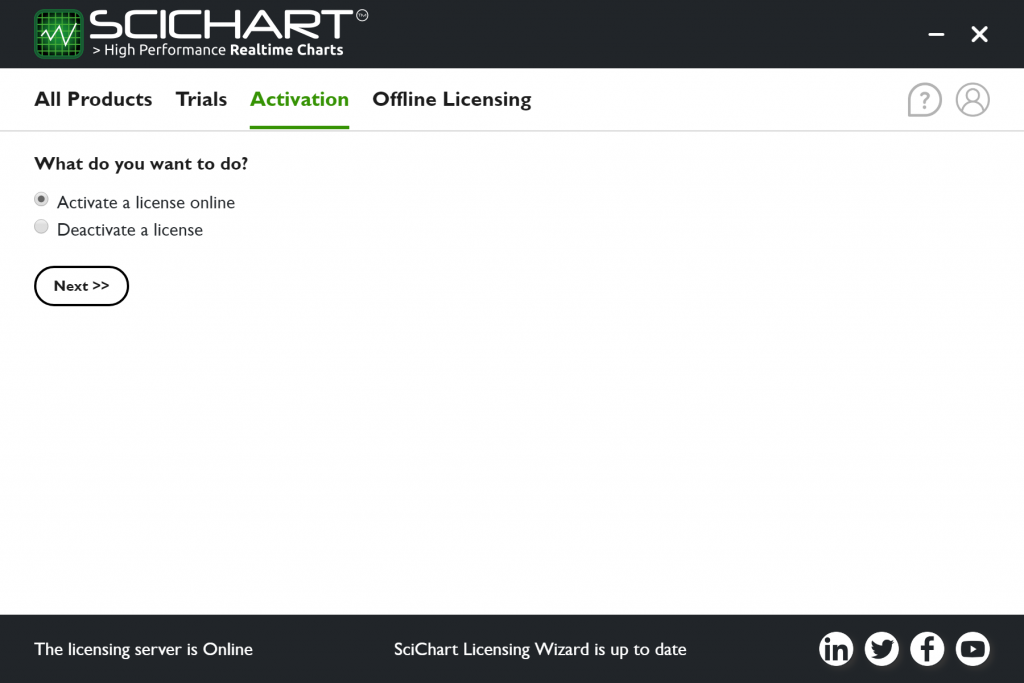

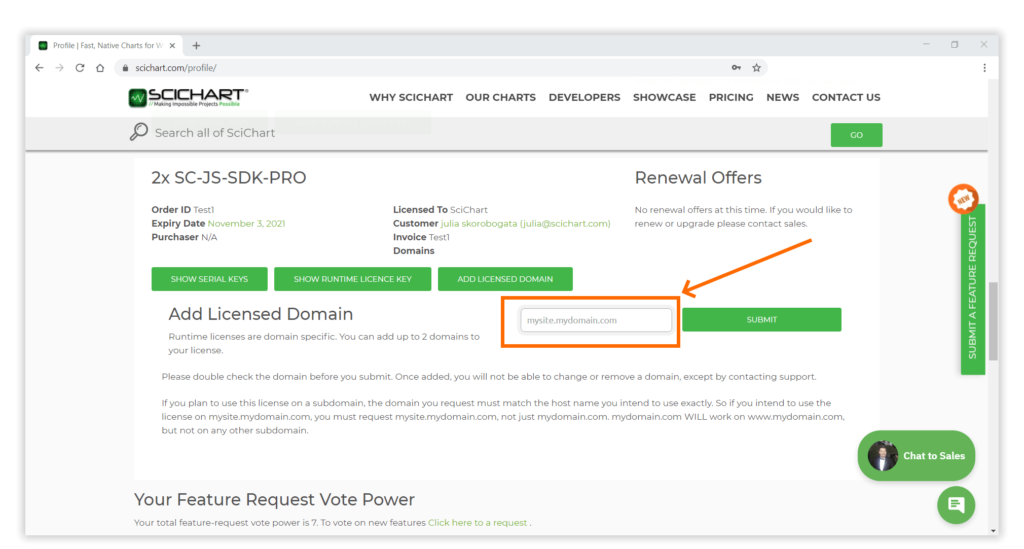

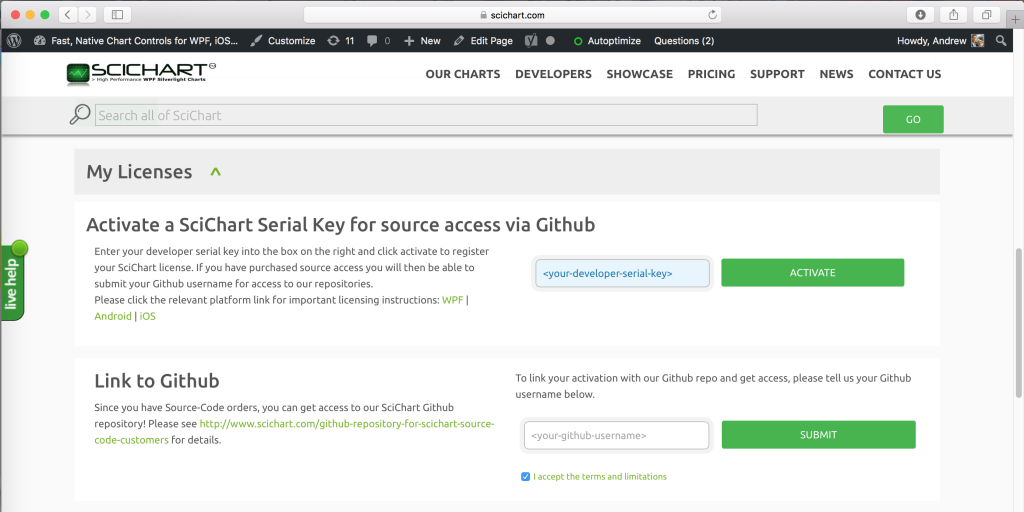
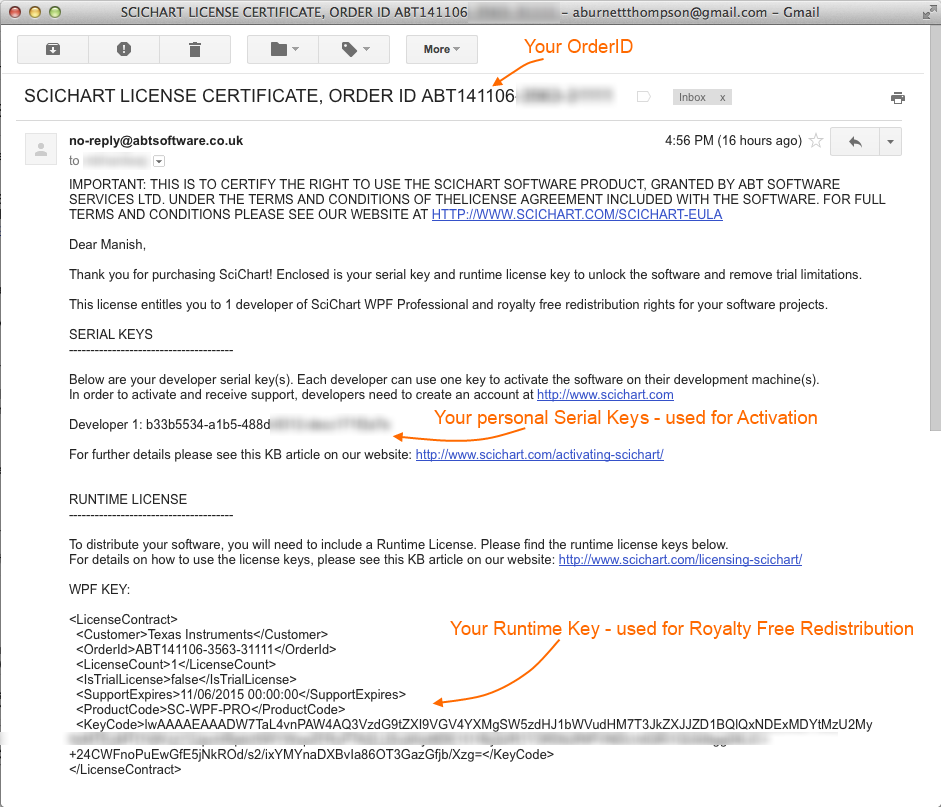
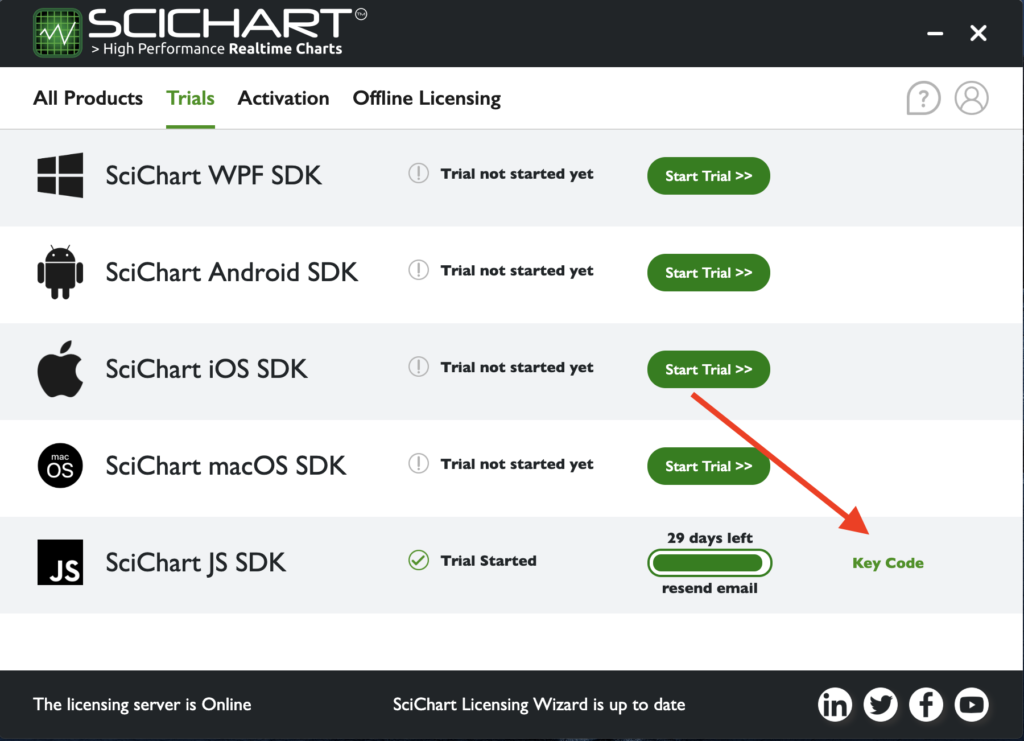
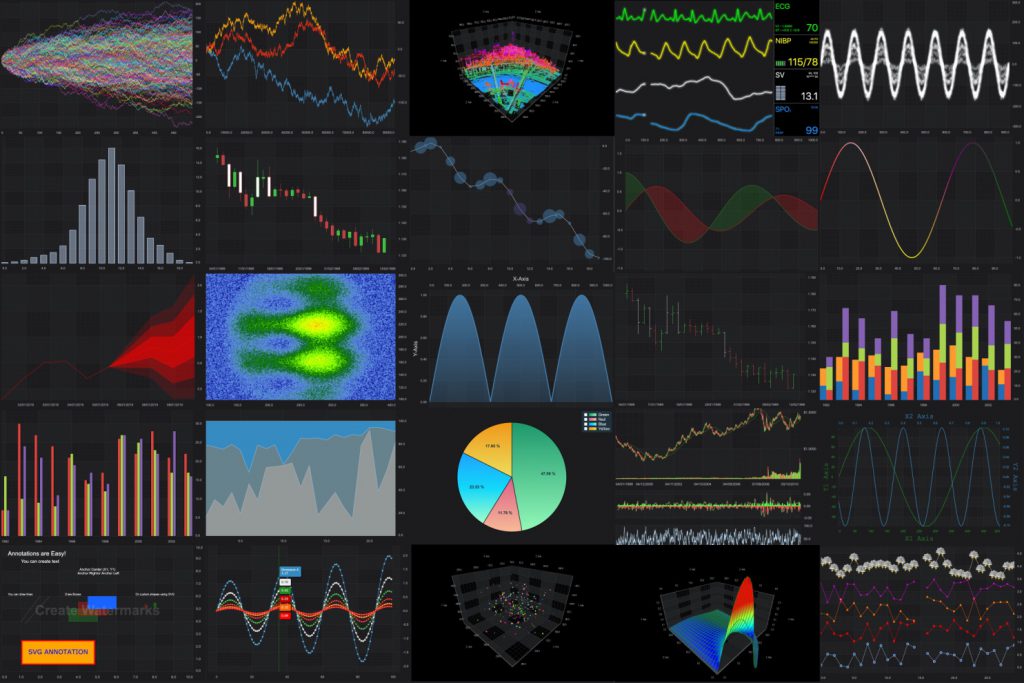
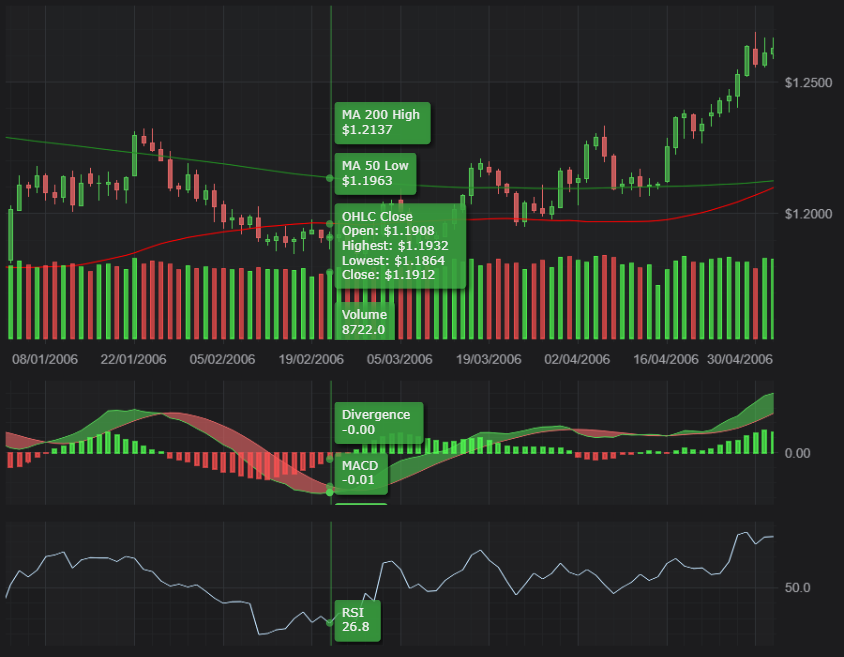
 . We’ve built this engine to compile to many targets, and use a variety of graphics technologies such as DirectX, OpenGL, Metal and WebGL to run on various platforms.