Quantcast
Channel: SciChart
Viewing all 302 articles
Browse latest View live

SciChart v3.6.0 Build 7618 Released

$
0
0

We are pleased to announce a Minor update to SciChart High Performance WPF Charts

This release contains several critical bug fixes and some minor features. Since v3.2, we are now following semantic versioning and this should be backward compatible to SciChart v3.2, v3.3, v3.4 and v3.5, and it is safe and recommended to upgrade subject to testing your application.

What’s New in v3.6.0.7618?

New/Improved

  1. Added High Quality Vector (XPS) Export functionality to SciChart WPF. This is licensed to the SciChart Source-code customers only
  2. Added a new RenderSurface plugin: XamlRenderSurface. This allows rendering all SciChart WPF to XAML / Canvas and enables high-quality scalable vector export
  3. Added ExportToXps Extension method for XamlRenderSurface
  4. Derived DataSeries types (XyyDataSeries, HlcDataSeries, OhlcDataSeries, BoxPlotDataSeries) Append, Insert, Update methods have all been made virtual
  5. Added a property called AllowsHighPrecisionColormap to FastHeatMapRenderableSeries, which fixed the issue with high-precision numbers as offsets in ColorMap. However it comes at the expense of performance
  6. Digitally signed the SciChart v3.x Installer with MS Authenticode Code Signing Certificate
  7. SC-3079 Added XIndex, YIndex to HeatmapSeriesInfo and HitTestInfo for Heatmap2DArrayDataSeries

Fixed

  1. SC-3092 Fixed the 1px long lines drawing issue for HQ renderer
  2. SC-3122 Fixed small ellipses aren’t rendered when width or height < 2
  3. SC-3092 Added ability to switch Antialiasing on\off, fixed binding to StrokeThickness
  4. SC-3092 Fixed bad rendering of short lines for HS renderer, small red dots when 1 StrokeThickness & AntiAliasing turned on, blinking series when drawing short, 1px lines & StrokeThickness > 1
  5. SC-3118 CursorModifier with ShowTooltip=True causes a fast memory leak on mouse-move. Fixes a long running memory leak in CursorModifier, TooltipModifier and Rollovermodifier where SeriesInfoTemplateSelector had an event handler leak
  6. SC-3102 Heatmap2DArrayDataSeries does not implement InvalidateParentSurface
  7. SC-3103 Multiple IDataSeries APIs in Heatmap2DArrayDataSeries not implemented!
  8. SC-3085 Fixed the bug when MinZoomConstrain wouldn’t work with LogarithmicAxi
  9. SC-3087 Fixed memory leak on resize of a chart containing Direct3D10RenderSurface
  10. SC-3073 Fixed Direct3D10RenderSurface memory leak after last SciChartSurface is removed, one Direct3D10RenderSurface instance remains
  11. SC-3080 DirectX Static memory (VertexBuffers etc..) is never reclaimed when the last SciChartSurface is garbage collected
  12. SC-3078 Fixed Heatmap goes beyond the viewport when zoomed to the data extents
  13. SC-3077 Fixed SciChartOverview stopped showing the background when bound to an ItemTemplate
  14. Fixed a bug when HeatMap recreated cached resources every time MappingSettings was get

Where can I get it?

If you are licensed and your support expiry is after the 9th December 2015, you can upgrade to SciChart v3.6.0 for free. Download options are found below:

The post SciChart v3.6.0 Build 7618 Released appeared first on SciChart.


SciChart WPF v4 Update

$
0
0

Just a quick heads up. A lot of people have asked us about SciChart v4 / SciChart 3D. We intended to release an MSI Installer for SciChart WPF v4 / SciChart WPF 3D today but we found a last minute crash bug and one or two other minute bugs which need investigating…

Rest assured, we’re going to be getting this out to you very shortly! Watch this space!

Best regards,
[SciChart Team]


The post SciChart WPF v4 Update appeared first on SciChart.

SciChart WPF v4 / SciChart WPF 3D BETA

$
0
0

Many people are eagerly anticipating the SciChart WPF v4 / SciChart WPF 3D BETA which we announced a month ago in the press release SciChart v4 SDK / SciChart 3D WPF Chart Coming Soon.

WPF 2D CHART FEATURESWPF 3D CHART FEATURES

We are pleased to announce we now have a pre-release MSI Installer for the SciChart v4 SDK. This includes the following:

  1. SciChart v4 SDK Libraries:
    • SciChart.Core.dll
    • SciChart.Data.dll
    • SciChart.Drawing.dll
    • SciChart.Chart.dll
    • SciChart.Charting3D.dll (Required for 3D Charts)
    • SciChart.Drawing.DirectX.dll (Required for the DirectX Renderer in 2D Charts)
  2. SciChart v4 SDK Examples Suite
  3. SciChart v4 Licensing Wizard
  4. API Documentation (CHM File) for all classes/interfaces in the SciChart SDK
  5. SciChart UpdaterTool – a Visual Studio addin to assist updating your projects from v3.x of SciChart to v4.x.
  6. Pre-requisites, including Visual C++ Runtime (for 3D), DirectX Redistributable (for 2D DirectX)

What’s New in SciChart v4

Well, this is a long list, so let’s try to keep it short & sweet!

#1 PointMetadata API

Tag data-points with any metadata class, route through to Tooltips, PaletteProvider, Hit-Test and more.

#2 Tooltips API

Improved API for setting DataTemplates for Rollover, Tooltip, Cursor and Vertical Slice Modifiers where custom tooltips are required via an intuitive Attached Property API. No more need for template selectors and complex templates to achieve custom tooltips.

#3 Data-point Selection API

DatapointSelectionModifier now natively supports click to select and CTRL click to multi-select data-points. Programmatic selection available via PointMetadata.IsSelected.

#4 MVVM API

SeriesBinding Markup Extension for MVVM Applications, which allows binding to a collection of pure ViewModels (no more RenderableSeries in ViewModels as per SeriesSource, which is now obsolete).

#5 Composite Annotations API

Nested, composite Annotations API allows creation of complex annotations such as measuring peak-to-peak, cycle duration, and financial annotations such as Fibonacci Retracements, Fibonacci Extensions etc…

#6 ChartModifier API

Improvements to ChartModifierBase API, allowing handling of keyboard shortcuts and KeyDown/KeyUp events in ChartModifiers.

#7 Undo/Redo Zoom

ZoomHistoryManager allows programmatic Undo/Redo of zoom or pan for all SciChart Modifiers.

#8 Export to Vector (Enterprise Edition only)

XamlRenderSurface implementation which allows export to vector / printing at extremely high quality and with scalable vector output.

XamlRenderSurface is available in certain editions of SciChart only: SciChart WPF Enterprise, SciChart WPF SDK Professional and SciChart WPF SDK Enterprise. The BETA comes with a 30-day trial for all product tiers. 

#9 Performance Improvements

SciChart v4 is faster than ever, thanks to various caching and memory usage improvements. All DataSeries now cache resample results and only resample when data or viewport size has changed. Memory is re-used (as opposed to recreated) during resampling/draw for lower GC load. Removed boxing/unboxing in various places. Memory is re-used when clearing / re-filling series for lower GC load. All PointMarkers perform lossless clustering by default. DirectX PointMarker performance increased 40x!!

#10 Styles, Themes

New Theme: SciChartv4Dark. New styling for cursor, tooltip labels, axis labels and legends. Gratuitous use of dropshadows and #222 grays for a modern look throughout.

#11 3D Charts!

8 new 3D Chart Types including Bubble, Scatter, Point-Cloud, Impulse, Column, Surface Mesh, Point-Line. Hardware accelerated, real-time 3D Charts with backgward compatibility to DirectX 9c. Point-Selection, Tooltips and Dynamic camera out of the box.

3D Charts are available in new editions of SciChart: SciChart 3D Professional, SciChart SDK Professional and SciChart SDK Enterprise. The BETA comes with a 30-day trial for all product tiers. 

#12 New Examples Suite

New updated SciChart Examples Suite with 100+ examples. Cool new theme and modern style in a reactive WPF UI. Features Example Export to Visual Studio, or search title/description/source-code. Send feedback from the examples suite. Trial license *never expires* for the Examples Suite (your own applications will expire). Loads of new examples. Much awesomeness, very SciChart.

#13 Documentation

Comprehensive, 300+ page documentation for SciChart 2D. All API topics are now full documented with code samples. Never again wonder how we did that. SciChart 3D Docs a work in progress.

#14 Utils: SciChart.UpdaterTool

SciChart Updater tool to help migrate a project from v3.x to v4.x is included in the SciChart MSI Installer. Upgrade instructions included in the documentation.

Wait, you promised us Documentation?

Yes, yes, we did. It’s a work in progress, to document this control is truly huge, but here is our draft SciChart v4.0 Documentation in View only mode. We are continuing to update this and it will ship either with the installer, or be transcribed online.

You can also view the API docs (class hierachy, method and type comments) online here.

Pricing & Licensing

Tldr: Pricing and licensing of SciChart 2D Will not change. SciChart 3D will be a new product.

If you are a SciChart WPF Basic, SciChart WPF Professional or SciChart Source-Code customer and your support has not expired on release, then you will be able to use the new SciChart v4 2D  free of charge. Hurray! 

Pricing of SciChart 2D/3D will then be as follows:

  • SciChart 2D WPF Basic. Product is discontinued, but existing Basic customers will be able to continue to use SciChart v4 WPF, with option to upgrade to Pro at renewal time.
  • SciChart 2D WPF Professional: $899  (No change to product pricing. Existing customers will be able to use SciChart v4 WPF).
  • SciChart 2D Source Code: $1499 (No Change to product pricing. Existing customers will be able to use SciChart v4 WPF).
  • SciChart 3D Professional: $999 less 30%* = $699.30 When purchased with early-bird discount
  • SciChart 2D+3D Professional: $1749 less 30%* = $1224.30 When purchased with early-bird discount
  • SciChart 2D+3D Source Code: $2549 less 30%* = $1784.30 When purchased with early-bird discount

*Early-bird discount is available NOW to new customers as well existing customers of SciChart to upgrade to a 3D product for a limited period of time. 

Upgrade pricing is also available for existing customers of SciChart WPF.

You can purchase now by getting in touch with sales, and quite soon, our web-store will be updated allowing purchasing of all new product tiers online.

Where to Get It

The MSI Installer is available from www.scichart.com/downloads. It is strongly recommended to use the MSI Installer to get access to the Examples Suite and Updater Tool.

The NuGet packages are available for a limited time over at https://www.myget.org/feed/Packages/abtsoftware-bleeding-edge before being moved to our main NuGet feed. Packages include ‘SciChart’, ‘SciChart3D’ and ‘SciChart.DirectX’ for DirectX 2D chart plugin

The 2D Charts source-code is already deployed to GitHub. If you are a source-code customer of SciChart 2D, you can access the v4 Prerelease source already! To link your SciChart account to Github and get access to our source code nightly build, visit the Profile page.

The 3D Charts Source-code will be limited to customers of SciChart 3D Products and is also deployed to a Github repository.


The post SciChart WPF v4 / SciChart WPF 3D BETA appeared first on SciChart.

Upgrade guide from SciChart v3.x to SciChart v4.x

$
0
0

So a lot of people are checking out the SciChart v4 BETA. That’s great! Except, of those who contacted us, no-one seemed to be aware that we’ve actually created a tool to help you migrate from v3.x to v4.x. This could save you a *lot* of time as there are significant API changes in the SciChart v4 SDK. The following is a guide to help you upgrade quickly from v3.x to v4.x.

Upgrading from v3.x of SciChart WPF to v4

At SciChart we follow Semantic Versioning. This means that major version changes (v3, v4, v5) have breaking API changes and will require changes to your project to compile. Minor versions (e.g. v3.3, v3.4) or patches (v3.4.1, v3.4.2) should be backward compatible drop-in replacements.

Since v4.x has major API changes, we have built a tool to help you do the bulk of the update. This is the SciChart.UpdaterTool!

Installing the SciChart.UpdaterTool (Visual Studio 2012, 2013, 2015)

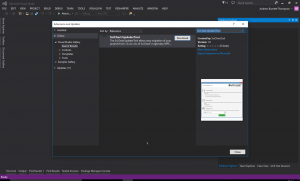
The SciChart Updater Tool is now available as a Visual Studio add-in via the Visual Studio gallery. To download and install it, go to Tools -> Extensions and Updates and search for ‘SciChart.UpdaterTool’ in the Visual Studio Gallery.

The SciChart.UpdaterTool on Visual Studio Gallery

The SciChart.UpdaterTool on Visual Studio Gallery

After installation you will need to restart Visual Studio. The SciChart.UpdaterTool should now be available via the Tools menu in Visual Studio.

Installing the SciChart.UpdaterTool (Visual Studio 2010)

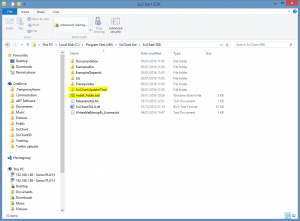
The SciChart UpdaterTool is copied to the Install directory when you install SciChart v4.x from the MSI Installer. This basically copies the contents of the %InstallDir%/SciChart.UpdaterTool to %CurrentUser%/Documents/Visual Studio/Addins

SciChart.UpdaterTool

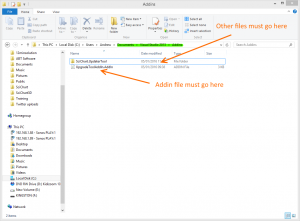
If for any reason this fails, you can try running the Install_Addin.bat batch file manually, or, copying the SciChart.UpdaterTool files over to %CurrentUser%/Documents/Visual Studio/Addins manually.

SciChart.UpdaterTool2

Using the SciChart.UpdaterTool

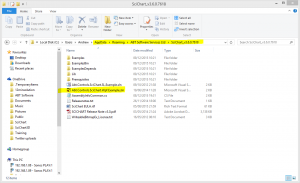
As a tutorial, we are going to update the Examples from v3.6 of SciChart to use v4.x with the updater tool. To follow the tutorial, open the Abt.Controls.SciChart.Wpf.Example.sln, or, use your own Visual Studio solution which references v3.x of SciChart.

SciChart.UpdaterTool3

Starting the SciChart.UpdaterTool

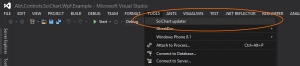
To start the SciChart.UpdaterTool, after opening a Visual Studio project which uses SciChart v3.x go to Tools -> SciChart Updater.

Note: If the SciChart Updater addin is not available, go back to step #1 and run the Install_Addin.bat batch file.

SciChart.UpdaterTool4

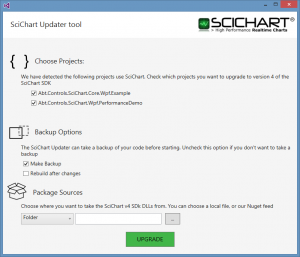
This should start the updater GUI

SciChart.UpdaterTool5

  1. Choose your projects to update. By default the updater chooses all projects which reference SciChart. If you do not see any projects here, then either your project does not reference SciChart, or, another problem has occurred.
  2. By default the SciChart Updater Tool creates a backup of your files. You can deselect this option if you are operating under version control.
  3. You need to choose the Package sources. This can be a local file / folder or NuGet feed.

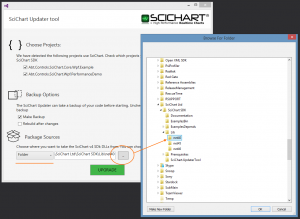
Updating from local DLL files

To update your project referencing local DLL files, select ‘Folder’ as the package source, and navigate to the directory where SciChart v4 DLLs are installed. By default, this is C:\Program Files (x86)\SciChart Ltd\SciChart SDK\Lib\net40 (for .NET4.0).

SciChart.UpdaterTool6

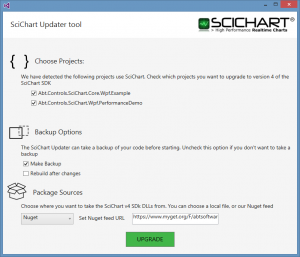
Updating from NuGet feed

To update your project referencing our packages from NuGet, select ‘NuGet’ as the package source, and check the NuGet feed. This should be https://www.myget.org/F/abtsoftware/api/v2 for Visual Studio 2012, 2013, and https://www.myget.org/F/abtsoftware/api/v3/index.json for Visual Studio 2015.

SciChart.UpdaterTool7

Running the SciChart Updater Tool

We’re going to run ours from installed-files. So, selecting the SciChart DLL folder, hit the ‘Upgrade’ button.

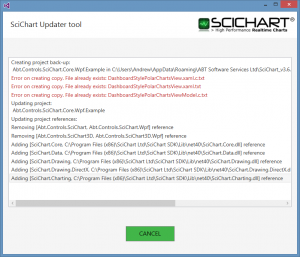
The updater should start. It may output some warnings at the start (if you have a previous backup). These can be ignored.

SciChart.UpdaterTool8

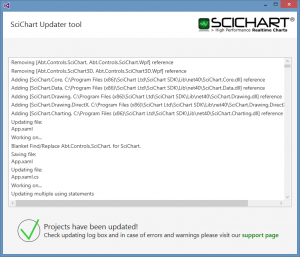
The updater then reports on files being upgraded.

SciChart.UpdaterTool9

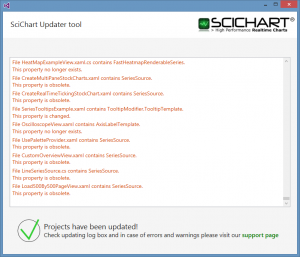
Finally, warnings are shown at the end of the process, once the update has completed.

SciChart.UpdaterTool10

Fixing Build Errors after using SciChart.UpdaterTool

The SciChart.UpdaterTool unfortunately doesn’t do all the work (it does do about 90%!). The last few steps are manual.

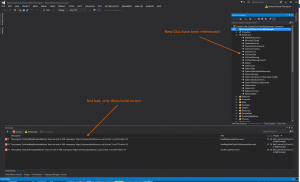
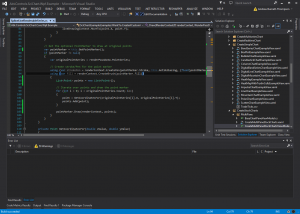
We can start by building our project and seeing what errors occur. Also, what warnings were output by the SciChart.UpdaterTool.

SciChart.UpdaterTool11

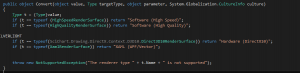
Build Error: The property ‘FastHeatMapRenderableSeries’ does not exist in XML namespace ‘http://schemas.abtsoftware.co.uk/scichart’

This error occurs because of an API Change to HeatmapColorMap. The HeatmapColorMap.FastHeatmapRenderableSeries property is deprecated and has been removed.

SciChart.UpdaterTool12

To upgrade your code, please do the following.

Before

<s:HeatmapColourMap Margin="30" HorizontalAlignment="Left" VerticalAlignment="Top" FastHeatMapRenderableSeries="{Binding ElementName=heatmapSeries}" Opacity="0.8" Orientation="Vertical" />

After

<s:HeatmapColourMap Margin="30"
                    HorizontalAlignment="Left"
                    VerticalAlignment="Top"
                    ColorMap="{Binding ElementName=heatmapSeries, Path=ColorMap}"
                    Minimum="{Binding ElementName=heatmapSeries, Path=Minimum}"
                    Maximum="{Binding ElementName=heatmapSeries, Path=Maximum}"
                    Opacity="0.8"
                    Orientation="Vertical" />

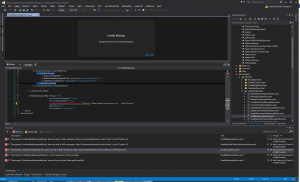
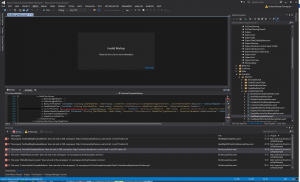
Build Error: The property ‘AxisLabelTemplateSelector’ does not exist in XML namespace ‘http://schemas.abtsoftware.co.uk/scichart’

This error occurs because of changes to the CursorModifier. We no longer use AxisLabelTemplateSelectors to change axis labels on a per-axis type basis, but instead, have an attached property which is placed on the axis.

SciChart.UpdaterTool13

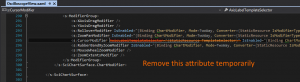
For now, we will simply remove this attribute temporarily.

SciChart.UpdaterTool14

To put it back, please see the updated documentation about the CursorModifier AxisLabelTemplate Attached Property.

Build Error: The type or namespace name ‘PaletteProviderBase’ could not be found (are you missing a using directive or an assembly reference?)

SciChart.UpdaterTool also reports this as a warning: File RedIfOverThresholdPaletteProvider.cs contains PaletteProviderBase. This class no longer exists.

From v3.x to v4.x PaletteProviderBase, IPaletteProvider have been significantly refactored. You will need to adjust your PaletteProvider implementations following the updated documentation for PaletteProviders in v4.

As a quick guideline, there is no longer a base-class for PaletteProividers, and the base interface IPaletteProvider has only one method on it. To implement a new palette provider, you may need to implement the following interfaces:

  • IStrokePaletteProvider: for lines, and series which have a stroke
  • IFillPaletteProvider: for series which have a fill
  • IPointMarkerPaletteProvider: for series which have a point-marker
Example: RedIfOverThresholdPaletteProvider

Before

using SciChart.Charting.ChartModifiers;
using SciChart.Charting.Visuals.RenderableSeries;
using SciChart.Charting.Numerics;
using System;
using System.Windows.Media;
using SciChart.Charting.Model.DataSeries;

namespace SciChart.Example.Examples.IWantTo.AnnotateAChart.DragHorizontalThreshold
{
    /// <summary>
    /// Defines a paletter provider to return a red color if the Y-Value is over a threshold value
    /// </summary>
    public class RedIfOverThresholdPaletteProvider : PaletteProviderBase
    {
        public double Threshold { get; set; }

        public override Color? GetColor(IRenderableSeries series, double xValue, double yValue)
        {
            if (yValue > Threshold)
                return Color.FromArgb(0xFF, 0xFF, 0x33, 0x33);

            // Returning null means use the default color when rendering
            return null;
        }
    }
}

After

using SciChart.Charting.Visuals.RenderableSeries;
using System.Windows.Media;
using SciChart.Charting.Model.DataSeries;
using SciChart.Charting.Visuals.PaletteProviders;

namespace SciChart.Example.Examples.IWantTo.AnnotateAChart.DragHorizontalThreshold
{
    /// <summary>
    /// Defines a paletter provider to return a red color if the Y-Value is over a threshold value
    /// </summary>
    public class RedIfOverThresholdPaletteProvider : IStrokePaletteProvider, IFillPaletteProvider
    {
        private XyDataSeries<double, double> _xyData;
        public double Threshold { get; set; }

        private Color? GetColor(IRenderableSeries series, double xValue, double yValue)
        {
            if (yValue > Threshold)
                return Color.FromArgb(0xFF, 0xFF, 0x33, 0x33);

            // Returning null means use the default color when rendering
            return null;
        }

        public void OnBeginSeriesDraw(IRenderableSeries series)
        {
            // Do nothing. Can be used to reset fields before a draw       
            // For performance, we also recommend getting, casting and caching a DataSeries here, e.g. 
            _xyData = series.DataSeries as XyDataSeries<double, double>;
        }

        public Brush OverrideFillBrush(IRenderableSeries series, int index, IPointMetadata metadata)
        {
            // PaletteProviders now pass in the series + index to data. You can get the data out as follows
            var color = GetColor(series, _xyData.XValues[index], _xyData.YValues[index]);
            if (color.HasValue)
                return new SolidColorBrush(color.Value); // Note: Caching brushes is advisable

            return null;
        }

        public Color? OverrideStrokeColor(IRenderableSeries series, int index, IPointMetadata metadata)
        {
            // PaletteProviders now pass in the series + index to data. You can get the data out as follows:
            var color = GetColor(series, _xyData.XValues[index], _xyData.YValues[index]);
            return color;
        }
    }
}

Build Error: The type or namespace name ‘Rendering’ does not exist in the namespace ‘SciChart’ (are you missing an assembly reference?)

This build error should only affects the upgrade of SciChart Examples solution from v3.x to v4.x, e.g. you should not see this when you update your own projects. For the purpose of the tutorial, to fix this, we remove the fully qualified namespace.

Before

SciChart.UpdaterTool15

After 

SciChart.UpdaterTool16

Build Error: ‘ActionCommand’ is an ambiguous reference between ActionCommand …

This build error should only affects the upgrade of SciChart Examples solution from v3.x to v4.x, e.g. you should not see this when you update your own projects. For the purpose of the tutorial, to fix this, we simply specify the fully qualified namespace

Before

SciChart.UpdaterTool17

After

SciChart.UpdaterTool18

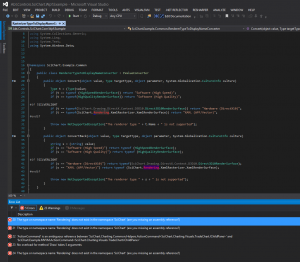
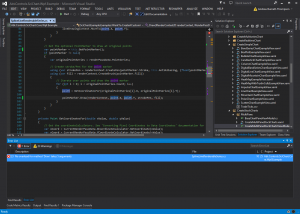
Build Error: No overload for method ‘Draw’ takes 5 arguments

There have been significant changes to the PointMarker API. You may see this build error if you have a custom PointMarker derived type, or have built a CustomRenderableSeries.

To fix it, please do something like the following:

Before

SciChart.UpdaterTool19

After

SciChart.UpdaterTool20

Fixing Warnings Output by SciChart.UpdaterTool

A number of warnings may also be output by the SciChart.UpdaterTool. Here we review these.

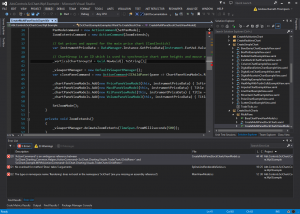
Warning: File ChartTypeViewModel.cs contains SeriesSource. This property is obsolete.

The SciChartSurface.SeriesSource property has been made obsolete, but backward compatible. Your application will still continue to work with it, but we strongly recommend upgrading to the new SeriesBinding MVVM API provided with SciChart v4.x, as the old SeriesSource API will no longer be supported.

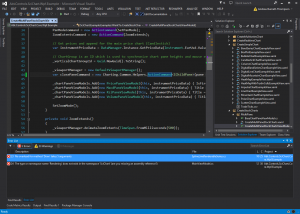
Warning: File RedIfOverThresholdPaletteProvider.cs contains PaletteProviderBase. This class no longer exists.

We have addressed how to resolve this in Section 2.4.3.3, by using the updated PaletteProvider API.

Completing the SciChart.UpdaterTool Tutorial

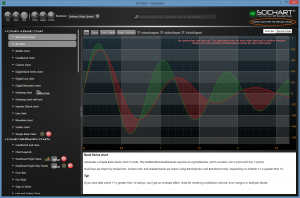
If you have followed the tutorial to update the SciChart WPF Examples from v3.x to v4.x, you should now be able to build and run the SciChart WPF Examples Suite (for v3) but referencing v4.x DLLs!

SciChart.UpdaterTool21

The post Upgrade guide from SciChart v3.x to SciChart v4.x appeared first on SciChart.

SciChart Website Update, v4 / SciChart 3D Pricing and Web Store now Live!

$
0
0

The SciChart Website has just undergone an update! Take a look around the new homepage, and WPF Chart features / WPF 3D Chart Features pages. Let us know your comments or feedback!

// SciChart v4 Web Store now Live!

We are now accepting orders for SciChart 3D, which is still in BETA. You can see pricing & early bird discount rates at www.scichart.com/buy-now

> All orders for SciChart 3D Products are discounted by 30% until 28th February 2016. All upgrades from 2D you only pay the difference.

The new store shows pricing in your local currency, and shows you dynamic discounts as you change product type, support duration and quantity.

SciChart-BuyNow SciChart-BuyNow2

When you click Secure Checkout you will be redirected to our payment processor.

// 1-year, 2-year, 3-year and Lifetime Support Subscriptions

We are now selling 1-year, 2-year, 3-year and lifetime support plans with new licenses and renewals. Purchasing multiple years reduces your overall costs as well as administrative costs if you need to seek approvals each year for a license renewal. All support/update plans come with access to major and minor updates as well as technical support until your support-expiry date.

// Site Licenses

You can now purchase Site-Licenses via the web store! Check out the options on the order ticket for more info

// SciChart 3D Early Bird Discount

SciChart 3D Purchases made before 28th Feb 2016 will be subject to a 30% discount. This discount is applied automatically when you check out.

If you already own a SciChart 2D License and wish to upgrade to 3D, again, you can take advantage of the early-bird discount, but please contact us to get a custom quote as the web store won’t process it automatically.


The post SciChart Website Update, v4 / SciChart 3D Pricing and Web Store now Live! appeared first on SciChart.

WPF Chart Performance Comparison

$
0
0

// WPF Charting Performance Warz!

The story so far

Since starting out in 2012 we at SciChart have made it our aim to become the best wpf chart in the world, the fastest WPF Chart, the most configurable and flexible WPF Chart for scientific and financial applications. We take it personally when our software uses too much memory or is too slow, and have aggressively optimized it and improved it according to user requests right from day one!

In 2012 we briefly held the title of the The World’s Fastest WPF Chart before Visiblox Ultimate pipped us to the post with their Visiblox Ultimate offering. See their comparison article for how SciChart and Visiblox stood way out of the crowd of many WPF Chart components in terms of performance and memory usage back in 2012.

We celebrated! Briefly … As all that changed in 2013, when LightningChart, a WinForms DirectX powered chart released LightningChart Ultimate WPF in 2013….

// The World’s Fastest WPF Chart: Rematch!

Fast forward to mid 2014 and Visiblox is no longer supported, so the two main contenders for High Performance WPF Charts are now SciChart and LightingChart, an all DirectX-based WPF and Winforms Chart component which retails for $2,470 USD per developer license.

We’ve been steadily improving our performance by bringing out the DirectX Renderer in 2015, and introducing various caching and performance enhancements with SciChart v4 in January 2016.

We felt it’s about time we compared the performance of these two charts head-to-head in a performance rematch!

// Comparing the Performance of the Two Fastest WPF Charts

Measuring WPF Chart Performance

We have created an application to measure WPF Chart performance. This tests a number of combinations of real-time WPF chart type, chart usage and various parameters to stress different parts of the renderer. During this what have we learned is …

Charting Performance is Complex, and Hard to Achieve!

Charting performance is complex, and there are several factors which influence overall performance. Such as:

  • The number of Series in a chart
  • Types of Series (e.g. Line, Scatter, Area, Candlestick)
  • Number of data-points per series
  • Rate of change of data (number of points appended or removed per second)
  • Thickness of lines / number of pixels filled
  • Size of the chart viewport on screen
  • Number of transformations between data & pixel coordinates per second
  • Any additional calculations like Logarithmic Axis scaling or Auto Ranging

We’ve tried to test a subset of these by creating a number of independent tests, outlined below.

// Test Setup

What Tests are Run

Test 1: NxM Series Test

SciChart Performance Test 1 - NxM Series

SciChart Performance Test1: NxM Series

N series of M points are appended to DataSeries, then the chart redraws (the same data) as fast as possible by just resizing the Y-Axis for 10 seconds per test. FPS is measured using the time elapsed between subsequent SciChartSurface.Rendered or LightningChart.AfterRendered events.

Areas Stressed: Iterating Data Series, Coordinate Transformation and Drawing.

NOTE: SciChart’s data Resampling is not applicable for short data-series (below a few thousand points) so this tests iterating over many data-series, coordinate transformation as well as raw drawing speed.

Test 2: Scatter Series Test

SciChart Performance Test 2 - Scatter Series

SciChart Performance Test2: Scatter Series

N Scatter points are appended to a DataSeries, then the chart redraws. Immediately after, the points are updated in a Brownian motion fashion and the chart is drawn again. The FPS is measured using the time elapsed between subsequent SciChartSurface.Rendered or LightningChart.AfterRendered events.

Areas Stressed: Coordinate Transformation, Geometry Generation (Ellipse) and Drawing.

NOTE: SciChart’s Data Resampling is not applicable for Scatter Series as our standard resampling algorithms do not work with scatter data, so this test effectively tests the geometry generation and drawing speed.

Test 3: FIFO Series Test

SciChart Performance Test 3 - Fifo Series

SciChart Performance Test3: Fifo Series

N points are appended to a FIFO (circular buffer) series, then a single point is appended (and one dropped), which triggers a redraw of the chart. The FPS is measured using the time elapsed between subsequent SciChartSurface.Rendered or LightningChart.AfterRendered events.

Areas Stressed: Copying Circular Buffers (FIFO Series), Resampling and Drawing, scrolling.

NOTE: Because the data is random (0-1) lots of pixels are drawn. A heavier emphasis on drawing occurs in this test than resampling, although at higher point counts resampling starts to kick in

Test 4: Append Data Test

SciChart Performance Test 4 - Append (NoiseFactor=0)

SciChart Performance Test4: Append (NoiseFactor=0)

SciChart Performance Test 4 - Append (NoiseFactor=100)

SciChart Performance Test4: Append (NoiseFactor=100)

SciChart Performance Test 4 - Append (NoiseFactor=1000)

SciChart Performance Test4: Append (NoiseFactor=1000)

N/3 points are appended to 3 DataSeries, then M points are appended between each draw of the chart. The data is random-walk but we vary noise to create more, or less noisy waves. This has the effect of stressing drawing more (when more noisy) vs. resampling more (when less noisy).

Areas stressed: Appending Data, Resampling, Auto-Ranging and Drawing.

NOTE: As the noise factor is increased, more pixels must be drawn, which stresses the rendering (drawing) more. For lower noise, resampling is the dominant influence on performance.

Test Setup Hardware

  • For the Test Setup we have used a desktop workstation with
    • Intel i7-5820K 3.3GHz Six Core
    • 32GB DDR3-2400 RAM
    • 2GB NVidia GTX760 video card
    • Windows 8.1 Professional
  • We have also ran tests on secondary hardware which was Intel i7 2.3GHz, Quad-Core, Macbook Pro 2012 with nVidia 650GM Graphics in order to confirm results.

Test Setup Software

For SciChart tests, we used the SciChart WPF v4.0.0 BETA and DirectX Renderer plugin was enabled, which is available as part of the SciChart WPF 2D Enterprise and SciChart SDK Editions. To measure FPS, we have used the SciChartSurface.Rendered event, which is fired once after the chart draws.

For LightningChart tests, we used LightningChart WPF Ultimate 6.5.1 and have used default settings following the guidelines in the LightningChart Examples. To measure FPS, we have used the LightningChart.AfterRendered event, which is fired after the chart draws.

// Test Results

We’ve included some test results below:

  • All test result numbers are in FPS (Frames per second), meaning, the average number of redraws per second during the test, as measured by the SciChartSurface.Rendered event and the LightningChart.AfterRendered event.
  • The final column (SC vs LC) is the speed increase of SciChart WPF vs. the LightningChart, e.g. 2.5 means 2.5x faster.
  • Higher Numbers are better!

lightning-scichart-comp-table

No WPF Charting Review could be complete without some results in charting form! So, we’ve included the above results as a set of bar charts :)

All results show FPS (Frames per second). Higher numbers are better!

SciChart (Green) vs Lighting Chart (Amber) Append Data to Series Refresh-Rate Performance Comparison. Higher is better

SciChart (Green) vs Lighting Chart (Amber) Append Data to Series Refresh-Rate Performance Comparison. Higher is better

SciChart (Green) vs Lighting Chart (Amber) Fifo (Scrolling) Series Refresh-Rate Performance Comparison. Higher is better

SciChart (Green) vs Lighting Chart (Amber) Fifo (Scrolling) Series Refresh-Rate Performance Comparison. Higher is better

SciChart (Green) vs Lighting Chart (Amber) Scatter Series Refresh-Rate Performance Comparison. Higher is better

SciChart (Green) vs Lighting Chart (Amber) Scatter Series Refresh-Rate Performance Comparison. Higher is better

SciChart (Green) vs Lighting Chart (Amber) NxM Series Refresh-Rate Performance Comparison. Higher is better

SciChart (Green) vs Lighting Chart (Amber) NxM Series Refresh-Rate Performance Comparison. Higher is better

// Analysis of Test Results

Conclusion 1: SciChart Consistently Outperforms LightningChart

Across a number of test cases including scatter charts, scrolling line series, appending line series and multiple series, SciChart consistently outperforms LightningChart.

  • On average, SciChart v4 with DirectX was 1.42x faster than Lightning Chart
  • In several cases SciChart v4 with was 2x – 5x faster than Lightning Chart
  • In two cases SciChart v4 with was over 8x faster than Lightning Chart
Conclusion 2: LightningChart Suffers when StrokeThickness > 1

We observed in our test results that LightningChart suffers in performance when Line Series are drawn and StrokeThickness is greater than one. This may be because the DirectX Lines primitive only supports hardware-accelerated lines of thickness=1. SciChart doesn’t suffer from a performance degredation when StrokeThickness = 2 or more, whereas according t the test results, LightningChart does.

Conclusion 3: LightningChart Does not offer AntiAliasing at StrokeThickness = 1

We observed in our test results that LightningChart does not antialias lines when StrokeThickness = 1. SciChart by default antialiases at StrokeThickness = 1 and we left this option enabled as for SciChart it makes little performance difference.

Conclusion 4: SciChart is the overall Winner for Performance and Cost

SciChart v4 with DirectX Renderer starts at $1499 USD per developer license, including source-code. This compares with a price of $2470 USD per developer license for LightningChart Ultimate, without source code, or $3900 USD per developer with soruce code. Pricing and performance puts SciChart WPF as the overall winner!

// Download the Performance Comparison App

Click here to download the performance comparison app if you wish to run the performance tests for yourself. We suggest you run the tests in Release mode without a debugger attached, and maximise the test-app window. Please leave it running until all tests complete (it will take about 10-15 minutes).

You will need to link to our NuGet server to download the SciChart WPF v4 DLLs. Please ensure the package SciChart.DirectX is installed.

You will also need the LightningChart Ultimate DLLs. To get these, please head over to the Arction website.

// Learn more about how we stack up!

So, are you ready to Switch to SciChart? Find out more about how we SciChart compares against competitors not only in performance, but also pricing, tech-support and continuous delivery in our article below:

WHICH IS BEST WPF CHART?

The post WPF Chart Performance Comparison appeared first on SciChart.

Student Discounts and Educational Discount Programme

$
0
0

From time to time we get asked for discounts for the SciChart WPF Charting Software, particularly from universities or students who don’t have much funds. What we would like to do is introduce a programme to help students and departments at Universities purchase and use the SciChart WPF Charting software at a discount or even free by partnering with us and helping us in a low-cost but very useful way!

// Sponsorship for Universities!

If you’re a student or researcher at an academic institution we’d like to give you a free license to SciChart 2D or 3D Charts that can use in non-commercial projects (e.g. personal or university related projects).

In return, all we ask is you list SciChart as sponsor of the project on your University website.

We’d love to see your application screenshots if you create a project using SciChart. Please feel free to blog about them or publish and the best ones we will re-publish!

// What’s Included, and what’s not

Features

We can include all the functionality of our SciChart 2D or 3D software for educational use. There will be no limitations on features.

Licensing

The license will be locked to you (or your department) and can be activated on two PCs. What we advise is you use the steps to deactivate and activate if you wish to transfer a license to a third computer.

Support

We can include all the functionality of our SciChart 2D or 3D software for educational use, but we cannot include tech-support as this is a big cost to us! If you have any questions as an educational user please post them over at stackoverflow.com under the Tag SciChart. Questions to support desk or our forums won’t be honoured.

Updates

Typically our commercial licenses come with 1-year of support & updates. An educational license will probably have 90 days of updates so you can grab bug-fix builds, but don’t worry you’ll still be able to develop with SciChart after the 90-days, as the license is perpetual. You just won’t be able to use the latest builds.

// Get in Touch if you are Interested

If you’re interested in taking advantage of this offer, talk to us. We were once students, we understand how it is to not have budget, and we also understand that our software would be great for you in your studies and research.

[SciChart Team]


The post Student Discounts and Educational Discount Programme appeared first on SciChart.

SciChart WPF SDK v4 Released! Early Bird Discounts & more …

$
0
0

SciChart v4.0 SDK Released!

We are pleased to announce that SciChart v4.0 Build 7946 is finally here! This major update adds 2D & 3D chart types to the SciChart SDK, plus makes many API and performance improvements making this release the best, and fastest edition of SciChart ever!

WPF Charts by SciChart WPF v4 SDK

To get the software, head over to our Downloads page for the MSI Installer. We are also distributing to our NuGet feed and source-code to our GitHub repository for source-code customers.

SciChart 3D Early Bird Discount

In case you haven’t seen it, we are discounting all SciChart 3D product purchases and upgrades until February 28th as part of our Early Bird Discount.

  • New Purchases of SciChart 3D Pro, SciChart SDK (2D+3D), or SciChart SDK Enterprise (2D+3D+Source) are discounted by 30%. These can be purchased from our web-store online.
  • Upgrades for existing customers also take advantage of a discounted rate for renewals & upgrades. Contact sales if you want to get a price to upgrade to a 3D product tier.

Remember, the Early Bird Discount ends on 28th Feb so get in touch!

VIEW: SCICHART 3D PRICING

SciChart iOS and Android BETA

Guess what…

Did you know we’ve been secretly building SciChart for iOS and Android? And did you know that our Android charts are extremely fast, like world-beating fast?

It’s being used already by one customer to build bespoke medical instruments and is flattening the competition in terms of performance.

On our new homepage we’ve added buttons to sign up to the newsletter for SciChart iOS and Android. If you’re interested in either of these platforms and want to receive (infrequent, non spammy) updates about our progress as well as BETA or early access/purchase, please sign up!

Android Charts and iOS Charts by SciChart

iOS BETA SIGNUP ANDROID BETA SIGNUP

Educational Discounts

Are you working as a researcher or student in a university? Love what you see in SciChart but can’t afford it? Well, we understand how it is to not have budget , we were once students too!

.. Electronic Engineering, actually 😉 *fist bump*

We are discounting, or even giving away SciChart licenses in exchange for publicity / link backs from high domain-authority ranking sites. Please see our Educational Discounts page for more details.

How does it work? 

Well basically if you can give us an article or link back to us from a university website it will help us in search engine rankings by increasing our domain trust, and no-one is more trusted than educational websites. A decent article / link and you’re effectively paying for the software in what we would save on marketing, so it’s a win win!

Get in contact if you are interested to learn more.

GET IN CONTACT

Send a Smile for SciChart v4

Do you have any feedback for SciChart v4 SDK? Please tell us! We love to hear from our userbase and continue to improve our products & services.

You can do this by clicking ‘Send a Smile’ in the SciChart v4 Examples App. Or, go old-school and use email!

SciChart Examples: Send a Smile

The post SciChart WPF SDK v4 Released! Early Bird Discounts & more … appeared first on SciChart.


How Fast is SciChart’s WPF Chart? DirectX vs. Software Comparison

$
0
0

// TLDR;

Test results demonstrate that SciChart’s Direct3D10RenderSurface, available in the SciChart Enterprise and SDK Editions, is up to 18x faster than software rendering, and median speed increase is 4x faster than software. In a variety of test results and chart types SciChart’s DirectX Renderer plugin excelled in performance vs. software!

// Measuring WPF Chart Performance

WPF Chart Performance is really important to us at SciChart. We strive to have the best, and the fastest WPF Chart components in the world, but how do we demonstrate what we’ve achieved vs. our competitors to would-be customers?

We’ve created an application which measures our WPF Chart Performance in a number of scenarios, such as line, scatter, scrolling-line and many-series scenarios. The tests are designed to really stress the chart control and find it’s limits.

There there are several factors which influence overall performance of a WPF Chart Control. Such as:

  • Number of Series in the chart
  • Types of Series (e.g. Line, Scatter, Area, Candlestick)
  • Number of data-points per series
  • Rate of change of data (number of points appended or removed per second)
  • Thickness of pens / number of pixels filled
  • Size of the chart viewport on screen
  • Number of transformations between data & pixel coordinates per second
  • Any additional calculations like Logarithmic Axis scaling or Auto Ranging

These are reflected in the test cases and show stress on different areas of the renderer.

// The Test Setup

Test Setup Configuration

As you may know, SciChart ships with several RenderSurface plugins including the HighSpeedRenderSurface, HighQualityRenderSurface, and now, the Direct3D10RenderSurface, a DirectX10/11 harware-accelerated RenderSurface implementation.

We’ve tested the latest release of SciChart: v4, and compared the three renderer plugins across a number of different scenarios in order to highlight the difference in performance of the SciChart RenderSurface implementations.

What Tests are Run

A number of tests are run in our WPF Chart Performance Comparison app which stress different areas of the renderer. These tests are designed to really stress the chart, by having huge numbers of series, or points, or many updates per second.

A certain test is run, and FPS, or refresh rate, is measured via the SciChartSurface.Rendered event, which fires once after each drawing pass completes.

The test cases are as follows:

Test 1: NxM Series Test

SciChart Performance Test 1 - NxM Series

SciChart Performance Test1: NxM Series

N series of M points are appended to an XyDataSeries, then the chart redraws (the same data) as fast as possible for 20 seconds per test. FPS is measured using the time elapsed between subsequent SciChartSurface.Rendered events.

Areas Stressed: Iterating Data Series, Coordinate Transformation and Drawing.

NOTE: Resampling is not applicable for short data-series (below a few thousand points) so this tests iterating over many data-series, coordinate transformation as well as raw drawing speed.

Test 2: Scatter Series Test

SciChart Performance Test 2 - Scatter Series

SciChart Performance Test2: Scatter Series

N Scatter points are appended to a XyDataSeries, then the chart redraws. Immediately after, the points are updated in a Brownian motion fashion and the chart is drawn again. The FPS is measured using the time elapsed between subsequent SciChartSurface.Rendered events.

Areas Stressed: Coordinate Transformation, Geometry Generation (Ellipse) and Drawing.

NOTE: Resampling is not applicable for Scatter Series as our standard resampling algorithms do not work with scatter data, so this test effectively tests the geometry generation and drawing speed.

Test 3: FIFO Series Test

SciChart Performance Test 3 - Fifo Series

SciChart Performance Test3: Fifo Series

N points are appended to a FIFO (circular buffer) series, then a single point is appended (and one dropped), which triggers a redraw of the chart. The FPS is measured using the time elapsed between subsequent SciChartSurface.Rendered events.

Areas Stressed: Copying Circular Buffers (FIFO Series), Resampling and Drawing.

NOTE: Because the data is random (0-1) lots of pixels are drawn. A heavier emphasis on drawing occurs in this test than resampling, although at higher point counts resampling starts to kick in

Test 4: Append Data Test

SciChart Performance Test 4 - Append (NoiseFactor=0)

SciChart Performance Test4: Append (NoiseFactor=0)

SciChart Performance Test 4 - Append (NoiseFactor=100)

SciChart Performance Test4: Append (NoiseFactor=100)

SciChart Performance Test 4 - Append (NoiseFactor=1000)

SciChart Performance Test4: Append (NoiseFactor=1000)

N/3 points are appended to 3 DataSeries, then M points are appended between each draw of the chart. The data is random-walk but we vary noise to create more, or less noisy waves. This has the effect of stressing drawing more (when more noisy) vs. resampling more (when less noisy).

Areas stressed: Appending Data, Resampling, Auto-Ranging and Drawing.

NOTE: As the noise factor is increased, more pixels must be drawn, which stresses the rendering (drawing) more. For lower noise, resampling is the dominant influence on performance.

Test Setup Hardware

  • For the Test Setup we have used a desktop workstation with
    • Intel i7-5820K 3.3GHz
    • 32GB DDR3-2400 RAM
    • 2GB NVidia GTX760 video card
    • Windows 8.1 Professional
  • Tests were run on a 16:10 1900×1200 monitor with the Test Suite application maximised.

For SciChart’s WPF Chart, the CPU and RAM speed are the biggest influencers on overall performance. For the DirectX Renderer the GPU becomes more significant. Please note, that we get decent numbers on a dual-core laptop. You don’t need a powerful machine to get good results, but it helps (especially for DirectX).

// Test Results

We’ve included the test results below:

In Table Form

SciChart DirectX vs. Software Performance Comparison

SciChart v4 DirectX vs HighSpeed (software) vs High Quality (software) performance comparison showing FPS (Refresh Rate). High numbers are better!

In Chart Form

No WPF Charting Performance Test could be complete without some results in charting form! So, we’ve included the above results as a set of bar charts :)

All results show FPS (Frames per second). Higher numbers are better!

scichart-wpf-directx-vs-software-multiple-series-results

NxM Series DirectX vs Software Performance Test Results showing FPS (Refresh Rate). Higher is better

scichart-wpf-directx-vs-software-scatter-chart-results

Scatter Chart DirectX vs Software Performance Test Results showing FPS (Refresh Rate). Higher is better

scichart-wpf-directx-vs-software-line-appending-results

Line Appending DirectX vs Software Performance Test Results showing FPS (Refresh Rate). Higher is better

scichart-wpf-directx-vs-software-fifo-results

Line Scrolling DirectX vs Software Performance Test Results showing FPS (Refresh Rate). Higher is better


// Analysis of Test Results

Conclusion 1: DirectX is up to 18x Faster than Software (HS)

In over 7 test cases, Direct3D10RenderSurface performance was between 13x and 18x faster than the HighSpeedRenderSurface. That’s better than an order of magnitude speed improvement.

DirectX performance excelled where there were high numbers of points, e.g. Scatter charts with 10,000 – 1,000,000 points, in the 500 series x 500 points tests and when scrolling or appending millions of points on a line chart.

At lower point counts the HighSpeedRenderSurface matched performance of the Direct3D10RenderSurface and is very capable for many WPF charting applications.

Conslusion 2: Median DirectX Performance is 4.16x Faster than Software

The Median speed for the HighSpeedRenderSurface was 14.29 FPS, whereas Median speed for the Direct3D10RenderSurface was 59.49 FPS. This places the DirectX renderer plugin at approximately 4x faster than the software renderer.

The tests where DirectX particularly excelled vs. software where those where many pixels were drawn to the screen, e.g. line appending with high levels of noisyness, or many scatter-points, or large stroke-thickness of lines.

Conclusion 3: DirectX Quality Exceeds that of the HS Software Renderer

The Direct3D10RenderSurface Quality matches that of the HighQualityRenderSurface, and exceeds that of the HighSpeedRenderSurface. In comparison to High Quality, the median performance of DirectX was almost 6x faster, yet providing similar floating-point antialiased line quality to this render surface.

Conclusion 4: With DirectX enabled, only 8 tests were below 30FPS

The limit for an animation to appear smooth is about 30FPS (frames per second).

32/40 test results were smooth (above 30FPS) for DirectX, compared to 7/40 for the software renderers.

The cases where DirectX Frame-rates dropped below 30 FPS tended to be extreme cases, e.g. 1000 series x 1000 points, 1,000,000 point scatter charts, 10,000,000 points scrolling FIFO charts.

// Enabling DirectX in your Application

To enable DirectX in your application, please use the following code.  The trial version allows the Direct3D10RenderSurface but by default, it is not enabled. It is enabled in our demos and examples.

   
<!-- where xmlns:s="http://schemas.abtsoftware.co.uk/scichart"-->
<!-- and xmlns:s3d="http://schemas.abtsoftware.co.uk/scichart3d"-->
<s:SciChartSurface s3d:DirectXHelper.TryApplyDirectXRenderer="True">
      ...
</s:SciChartSurface>

*Please note: the DirectX Renderer is currently included as part of SciChart WPF 2D Enterprise and SciChart SDK Product Tiers only. It is not enabled by default, but is permitted in the trial version. 

// Download the Test Suite

Download the WPF Chart Performance Test Suite.

This Application is based on the WPF Chart Performance Comparison application published by Scott Logic in 2012 and has been adapted to test SciChart’s WPF Chart performance in a number of scenarios. We are even able to test SciChart performance vs. competitors. Feel free to adjust the application for your needs!

The post How Fast is SciChart’s WPF Chart? DirectX vs. Software Comparison appeared first on SciChart.

SciChart WPF v4.0.1 Build 8001 Released

$
0
0

We are pleased to announce a Minor Update to the SciChart WPF SDK v4

This release contains several critical bug fixes and it is recommended for all users of SciChart WPF v4 to update. We are now following semantic versioning and v4.0.1 is backwards compatible to v4.0.0. It is not backward compatible to v3.x. For this you will need to see our migration guide

What’s New in v4.0.1.8001?

Fixed

  • Fixed crash in SciChart3D if D3DCompiler_43.dll is not present on target machine
  • Fixed intermitted AccessViolationException crash in SciChart3D which occurs on switching example.
  • Fixed a bug in SciChart3D where SurfaceMesh was occassionally drawn incorrectly on first draw only
  • Fixed PointLine 3D and Column 3D Chart examples still crash on fast switching of example
  • Fixed a bug where SciChart.UpdaterTool wouldn’t work in some cases
  • Fixed a bug where SciChart.UpdaterTool hit the wrong NuGet server, not getting latest DLLs.
  • Fixed several licensing & activation issues, including:
    • Chart showing Trial Watermark even after developer license is activated.
    • Chart showing incorrectly warnings such as mismatch in Runtime Key when SC-WPF-PRO or SC-SRC runtime key used.
    • Now possible to have a Trial Extension for a 3D or SDK product when already activated as a 2D product
  • Fixed several SciChart v4 Examples not compiling after export
  • Fixed SciChart v4 Examples Source-code doesn’t compile in the installer
  • Fixed the mismatch between File and Assembly Version info e.g. Assembly Version 4.0.1 was File Version 4.01, now 4.0.1.

Improved

  • Added a property to SciChartSurface.ShowLicensingWarnings. Set to false to hide red licensing warnings in the top right of the SciChartSurface.
  • Improved behaviour and usability of the DataPointSelectionModifier
  • Added a row to the SciChart Licensing Wizard to show you the underlying Trial Status if you are activated on a 2D product. This can assist with understanding Activated on 2D, Trialing 3D combinations.
  • Added new example ‘Waterfall Chart’ to the SciChart WPF v4 Examples Suite
  • Added Version/Build information to Examples Suite Settings page.
  • Added tooltips all over the Licensing Wizard to explain what the various bits mean!
  • [Internal to our Build] Added 75 end-to-end Integration Tests to cover all SciChart Licensing & Activation cases. Hopefully those pesky licensing issues will never rear their head again.

Where to get it!

The usual places: Downloads page, NuGet and Github!

Best regards,
[SciChart Team]


The post SciChart WPF v4.0.1 Build 8001 Released appeared first on SciChart.

SciChart WPF v4.0.2 Build 8045 Released

$
0
0

We are pleased to announce a Minor Update to the SciChart WPF SDK v4

This release contains several critical bug fixes and it is recommended for all users of SciChart WPF v4 to update. We are now following semantic versioning and v4.0.12is backwards compatible to v4.0.0. It is not backward compatible to v3.x. For this you will need to see our migration guide

What’s New in v4.0.2.8045?

Fixed

  • Fixed an issue where the SciChart SDK Installer did not install the Visual C++ 2013 Runtime, meaning 3D Charts failed to load on computers without Visual Studio 2013 with MSVCP.dll not found error
  • Fixed an issue where SciChart.Charting3D did not correctly load D3DCompiler_47.dll dependency when in DirectX 9 mode, causing a crash in 3D Charts on DirectX 9 only PCs.
  • Fixed an issue where several 3D Chart Types crashed when the target computer had .NET4.0 only (not .NET 4.5 or 4.6).
  • Fixed an issue where SciChart 3D Surface Mesh wireframe did not match the surface size/shape of the mesh in some cases.
  • Fixed VerticalLineAnnotation incorrect position at startup
  • Fixed a bug with MountainSeries not skipping NaN data values and drawing gaps incorrectly

Improved

  • The SciChart.UpdaterTool is now packaged as a VSIX Visual Studio Extension. You can download it now in the Visual Studio 2012, 2013, 2015 gallery by following steps from our Migration Guide.
  • Also the SciChart.UpdaterTool several issues are fixed such as blank / not working updater tool on some computers.
  • The WPF Examples Suite now has a proper exception handling dialog with full stack trace, which you can send to us on error (hopefully these don’t occur!)

Where to get it!

The usual places: Downloads page, NuGet and Github!

Best regards,
[SciChart Team]


The post SciChart WPF v4.0.2 Build 8045 Released appeared first on SciChart.

SciChart WPF v4.0.3 Build 8066 Released

$
0
0

We are pleased to announce a Minor Update to the SciChart WPF SDK v4

This release contains several critical bug fixes and it is recommended for all users of SciChart WPF v4 to update. We are now following semantic versioning and v4.0.3 is backwards compatible to v4.0.0. It is not backward compatible to v3.x. For this you will need to see our migration guide

What’s New in v4.0.3.8066?

Fixed

  • Added exception / warning if setting ColumnRenderableSeries3D.DataPointWidth outside of bounds 0.0-1.0
  • Fixed a bug where changing DataSeries.YValues or XValues and Invalidating SciChartSurface did not redraw the chart. This occurred because of the new Caching feature in DataSeries, which did not know about data-values being changed via the YValues list.
  • Fixed rounding error issue which prevented ColumnRenderableSeries3D from displaying in some conditions
  • Fixed NullReferenceException in ColumnRenderableSeries3D when opacity used
  • Merged fixes from v3.6 Branch: Fixed the crash during panning CategoryAxis

Improved

  • SC-3343 Allow disabling all DropShadowEffects (used by tooltips, legends) via the EffectManager.Instance.EnableDropShadows property
  • SC3D-290 Allow hide 3D XYZ Orientation Gizmo and FPS Counter in SciChart3D via SciChart3DSurface.IsFpsVisible and IsXyzGizmoVisible properties
  • SC3D-287 Allow hide entire AxisCube via SciChart3DSurface.IsAxisCubeVisible
  • Added option to SciChart WPF Examples Suite -> Settings -> Use Alternative Fill Source (to enable compatibilty mode for DirectX on older GPUs)
  • Added option to SciChart WPF Examples Suite -> Settings -> Enable/Disable DropShadows (to allow better performance on older hardware)

SC3D 30% Discount Ends Soon!

The Early Bird discount of 30% off all SciChart 3D licenses ends on the 28th February 2016! Only orders placed before this time will be honoured at the discounted rate.

On the 1st March 2016, the SciChart 3D pricing will revert to the normal pricing, so hurry and take advantage of this limited time offer!

  • SciChart 3D Professional: $699.30 in Discount, Normally $999
  • SciChart SDK (2D+3D) Pro: $1224.30 in Discount, Normally $1749
  • SciChart SDK Ent (2D+3D+Src): $1784.30 in Discount, Normally $2549

Also, if you’re an existing customer of SciChart WPF Professional or SciChart WPF Source and wish to upgrade, contact us as we have special rates to upgrade to SciChart 2D+3D (only paying the difference). 

VIEW SCICHART3D PRICING

Where to get SciChart Downloads?

The usual places: Downloads page, NuGet and Github!

GET SCICHART v4.0.3

Best regards,
[SciChart Team]


The post SciChart WPF v4.0.3 Build 8066 Released appeared first on SciChart.

SciChart WPF v4.0.4 Build 8098 Released

$
0
0

We are pleased to announce a Stability Update to the SciChart WPF SDK v4.

Since the release of v4 we’ve released a number of patches 4.0.1, 4.0.2, 4.0.3 which address critical issues such as crash or compatibility bugs in our DirectX powered 2D & 3D charts. It is therefore recommended for all users of SciChart WPF v4 to update, especially if you have experienced one or more crash bugs in SciChart 3D since migrating to v4.

If you are using SciChart v4.x then this update is a drop-in replacement. If you are still using SciChart v3.6.1 we invite you to take a look at SciChart v4 and our migration guide. We’ve made it easier than ever to jump to the latest major version!  

What’s New in v4.0.4.8098?

Fixed

  • SC3D-295 NullReferenceException in Viewport3D after export of a 3D Example referencing SciChart.Charting3D
  • SC-3337 Fixed when AnnotationLabel.RotationAngle gets overriden in VerticalLineAnnotation.ApplyOrientation
  • SC-3119 Fixed scrollbar flickers if you click on the central area
  • SC-3258 Set hit-test data convert to data values from world coordinates to data in 3D Tooltips
  • SC-3353 Fixed HeatMap isn’t redrawn when ColorMap gets changed
  • SC-3352 Fixed BaseRenderableSeriesViewModel.StyleKey change does not show up in app
  • SC-3313 Candlesticks: drawing artifacts on the right edge (Merged from v3.6 branch)
  • Fixed ShowTooltipOn.MouseLeftButtonDown option in VerticalSliceModifier

Improved

  • SC3D-294 Warn if SciChart3D Run without Visual Cpp 2013 Runtime
  • SC3D-285 Implemented new PixelPointMarker3D which can be used in combination with ScatterRenderableSeries3D to render millions or tens of millions of points Point-Cloud charts as single pixels. Dynamically changing 10,000,000 points scatter 3d now takes 300ms. Static point-clouds with 10M points render at over 60 FPS.
  • SC-3354 Better error message if you don’t enter a complete key in licensingWizard
  • Added Fill property to SeriesInfo3D
  • Supporting better exception handling and reporting in Exported code solutions from the WPF Examples Suite.
  • Ensure exported project from WPF Chart Examples Suite uses .NET4.0 not .NET4.5 for best compatibility
  • Enabled SciChart.Examples.Demo logging to text file in user\AppData\Local\SciChart directory

New WPF Chart Examples Page up!

We’ve put up a new page where you can browse the features and examples of the SciChart WPF Examples Suite that come with the trial installer.

It’s a work in progress, but if you want to quickly browse our examples or see what’s available then head over to the WPF Chart Examples page!

SC3D 30% Discount Ends Soon!

The Early Bird discount of 30% off all SciChart 3D licenses ends on the 29th February 2016! Only orders placed before this time will be honoured at the discounted rate.

On the 1st March 2016, the SciChart 3D pricing will revert to the normal pricing, so hurry and take advantage of this limited time offer!

  • SciChart 3D Professional: $699.30 in Discount, Normally $999
  • SciChart SDK (2D+3D) Pro: $1224.30 in Discount, Normally $1749
  • SciChart SDK Ent (2D+3D+Src): $1784.30 in Discount, Normally $2549

Also, if you’re an existing customer of SciChart WPF Professional or SciChart WPF Source and wish to upgrade, contact us as we have special rates to upgrade to SciChart 2D+3D (only paying the difference).

VIEW SCICHART3D PRICING

Where to get SciChart Downloads?

The usual places: Downloads page, NuGet and Github!

GET SCICHART v4.0.4

Best regards,
[SciChart Team]


The post SciChart WPF v4.0.4 Build 8098 Released appeared first on SciChart.

125 WPF Chart Examples and SciChart WPF SDK Documentation now live

$
0
0

We are pleased to announce that the SciChart WPF SDK Documentation and Examples can now be browsed on the website! This is the result of months of unseen work to present an excellent all-round experience to our users.

We are still in the process of updating docs so some of the articles may be incomplete, or may be moved from time to time. Also the KB Articles at support.scichart.com need to be updated.

Browse WPF Chart Examples Online

You can now browse the WPF Chart Examples online by going to the homepage -> under products -> WPF Chart Examples. The direct link is www.scichart.com/wpf-chart-examples

Here you will find all 125 of the SciChart WPF SDK Examples including screenshots, videos, and source-code (very useful for searching our capabilities, or demonstrating to a co-worker or manager!) You can also find instructions on how to export the source-code to Visual Studio so you can get started right away with the SciChart SDK!

How to find the SciChart WPF Chart Examples

How to find the SciChart WPF Examples

The SciChart WPF Examples Page

The SciChart WPF Examples Page at scichart.com

Browse the SciChart WPF SDK Documentation

You can now browse our 400 pages of documentation which have been painstakingly transcribed to the web! You can find the documentation by going to homepage -> under support -> Documentation. The direct link is www.scichart.com/documentation/v4.x/webframe.html. We will be updating this documentation regularly and some topics still are in progress, so do bear with us during this transition period.

Locating the SciChart WPF SDK Documentation

Locating the SciChart WPF SDK Documentation

The SciChart WPF SDK Documentation Online!

The SciChart WPF SDK Documentation Online!

Topics include:

Let us know your feedback!

Let us know your feedback! We’re always keen to hear what you think of SciChart!

Best regards,
[SciChart Team]


The post 125 WPF Chart Examples and SciChart WPF SDK Documentation now live appeared first on SciChart.

Intro to SciChart for Android: High Performance Android Charts!

$
0
0

In the following video we present SciChart for Android, which is currently in development and private BETA.

Check out the performance of our new upcoming Android Chart control, which is able to render millions of points in real-time on an Android device!

scichart-android-play

SciChart for Android has been optimized for Scientific, Engineering, Medical and Financial applications and is perfect for embedded systems where Android is the target operation system.

Chart types completed so far include:

  • Android Line Chart
  • Android Mountain (Area) Chart
  • Android Candlestick Chart
  • Android Column Chart
  • Android Heatmap / Spectrogram Chart
  • Android Scatter Chart
  • Android Impulse (Stem) Chart

Features completed so far include:

  • Multiple X,Y Axis
  • Vertical Charts
  • Annotations
  • Tooltips
  • Series Selection
  • Legends
  • Touch zooming, panning and interaction

We’re actively working to release an early BETA of the compiled library soon and already able to deliver SciChart Android as a product to customers to wish to purchase the source-code!

If you’re interested to learn more or to find out about what we can do for you, please contact us!

Best regards,
[SciChart Team]

The post Intro to SciChart for Android: High Performance Android Charts! appeared first on SciChart.


SciChart WPF v4.0.5 Build 8246 Released

$
0
0

We are pleased to announce a Stability Update to the SciChart WPF SDK v4.

Since the release of v4 we’ve released a number of patches 4.0.1, 4.0.2, 4.0.3, 404 which address critical issues such as crash or compatibility bugs in our DirectX powered 2D & 3D charts. It is therefore recommended for all users of SciChart WPF v4 to update due to the number of minor issues addressed in this patch.

If you are using SciChart v4.x then this update is a drop-in replacement. If you are still using SciChart v3.6.1 we invite you to take a look at SciChart v4 and our migration guide. We’ve made it easier than ever to jump to the latest major version!  

What’s New in v4.0.5.8246?

Fixed

  • SC-3388 Fixed AutoRange change to Always issue
  • Fixed Obfuscator settings not allowing referencing Themes/Default.xaml from SciChart base themes
  • SC-3366 Support Double.Nan in FastHeatmapRenderableSeries when AllowHighPrecisionColorMap setting is true
  • SC-3390 TooltipModifier does not populate SeriesData.
  • SC-3373 Fixed appearance Licensing Warnings for polar chart
  • Fixed zoom history manager issue when HistoryDepth value set to more than 10 it’s continue work only for 10 history range
  • SC3D-311 Fixed LogarithmicNumericAxis3D.TextFormatting when behaving of it is not as expected
  • SC-3379 Fixed issue when Mountains and Bands doesn’t appears
  • Fixed XPS printing in MVVM scenarios
  • Fixes NullReferenceException in SciChartGroup on add-pane
  • SC-3348 Fixed issue when Vertical Slice tooltips are close together, the tooltips start jump slices
  • Fixes Binding Error for StrokeDashArray on BandRenderableSeriesViewModel “BindingExpression path error: ‘Series0StrokeDashArray’ property not found on ‘object’ ”BandRenderableSeriesViewModel'”
  • Fixes NullReferenceException if AxisCore.TickCoordinatesProvider is set in XAML not code
  • SC3D-300 UniformGridDataSeries 3D where ZSize != XSize crashes
  • SC3D-304 Fixes HitTest X-Z issues for non-rectangular meshes in UniformGridDataSeries3D
  • SC3D-301 UniformGridDataSeries3D Transposes data – fixes transposition for Uniform column, heatmap and impulse types
  • SC-3346 Fixed issue when SciChartGroup pane large, XAxis Drag scales, when small XAxisDrag pans
  • Fixed LogarithmicNumericAxis3D issue:
    no labels with ScientificNotation = Normalized
  • SC-3362 Fixed incorrect drawing in RenderContext.DrawText
  • SC-3347 Fixed XAxis Drag issue when zoom it to extremes XAxis Drag stops working
  • SC-3347 Fixed mousewheel issue when zoom it to extremes mousewheel stops working
  • SC-3370 Memory leak in DirectXHelper.TryApplyDirectXRenderer
  • SC-3369 RolloverModifier.ShowTooltipOn = MouseOver is behaving like Always
  • SC-3366 Support NaN for transparent cell in Heatmap
  • SC-3367 RubberBandZoomModifier doens’t work property in Multi-Chart scenarios where charts are of different sizes
  • SC3D-298 Runtime C++ SWIG Binding error from C# in SciChart3D due to file-locks on SciChart3DNative.dll dependency
  • SC-3361 Fixed issue when AxisDrag works on an adjusted surface (where not supposed)
  • SC-3363 Fixed when stackedColumns appears as a thin lines at NaN data values
  • SC-3357 Fixed StackedColumnSeries zooming issue
  • SC-3356 Fixed XyzDataSeries crashes when TY,TZ type are not equal
  • SC-3355 Changed AnnotationCreationModifier.AnnotationType property to dependency property.

Improved

  • SC-3365 Created “Export to XPS, Printing and Screenshots” Example in SciChart Demo
  • SC3D-297 Created specific example for OrbitModifier3D, ZoomExtentsModifier3D
  • Implementing Dispose in SciChart3DSurface to explicitly dispose the Viewport3D and shut down the 3D Engine if this is the last SciChart3DSurface, rather than relying on the Finalizer which is non-deterministic.
  • SC3D-310 Implement SciChart3DSurface.ExportToBitmapSource() / ExportToFile
  • Added the method UniformGridDataSeries3D.ToArray2D() (returns double[,] array)
  • Added the debug extension method ToStringArray2D (accepts double[,] array, formats as X Z text for visual inspection of UniformGridDataSeries3D)
  • Removed Rhino.Mocks from SciChart.Charting!! Why is it there?

SciChart Android / iOS Coming Soon!

Over the past year, we’ve been working hard to port SciChart to iOS / Android and these are going to be released soon (possibly in the next few months).

SciChart for Android is shaping up to be the worlds fastest Android Chart by an order of magnitude, capable of drawing millions of points in real-time on Android devices. Perfect for financial, medical or engineering applications, embedded systems and automotive systems.

SciChart for iOS is also capable of drawing millions of points with instant zoom/pan and offers smooth and stutter free real-time charting on iPad and iPhone devices.

Both are going to be announced shortly, but in the meantime, here is a quick preview of SciChart for iOS and Android in the two videos below.

Screen Shot 2016-04-09 at 15.42.42 Screen Shot 2016-04-09 at 15.42.47

Where to get SciChart Downloads?

The usual places: Installers from the Downloads page, Packages from NuGet and source-code via Github!

GET SCICHART v4.0.5

Best regards,
[SciChart Team]


The post SciChart WPF v4.0.5 Build 8246 Released appeared first on SciChart.

Intro to SciChart for iOS: High Performance iOS Charts!

$
0
0

In the following video we present SciChart for iOS, which is currently in development and private BETA.

Check out the performance and features of our new upcoming iOS Chart control, which is able to render millions of points in real-time on an iOS device!

Screen Shot 2016-04-09 at 15.21.20

SciChart for iOS has been optimized for Scientific, Engineering, Medical and Financial applications and is perfect for embedded systems where iOS is the target operation system.

Chart types completed so far include:

  • iOS Line Chart
  • iOS Mountain (Area) Chart
  • iOS Candlestick Chart
  • iOS Column Chart
  • iOS Heatmap / Spectrogram Chart
  • iOS Scatter Chart
  • iOS Band Chart
  • iOS Stacked Mountain (Area) Chart
  • iOS Bubble Chart

Features completed so far include:

  • Touch to Pinch Zoom, Pan
  • Touch to zoom to fit
  • Auto-Ranging
  • Annotations
  • Tooltips
  • Legends

We’re actively working to release an early BETA of the compiled library soon and already able to deliver SciChart iOS as a product to customers to wish to purchase the source-code!

If you’re interested to learn more or to find out about what we can do for you, please contact us!

Best regards,
[SciChart Team]

The post Intro to SciChart for iOS: High Performance iOS Charts! appeared first on SciChart.

New SciChart Tag on Stackoverflow!

$
0
0

Hey everyone!

We have recently added a SciChart Tag to Stackoverflow! This means you can ask questions on StackOverflow about SciChart and improve your score / ranking on this extremely popular developer Q&A site.

Using this tag also helps us get recognition in the development community, so we encourage you to use it!

SciChart Stackoverflow Tag

Tag: SciChart is now available on StackOverflow

Our staff are monitoring any questions which have the SciChart Tag added so new questions get emailed to them.

You can navigate to all questions tagged with SciChart via the menu on scichart.com, or directly at http://stackoverflow.com/questions/tagged/scichart

How to navigate to SciChart tag on StackOverflow

How to navigate to SciChart tag on StackOverflow

Take a look and have a go!

Best regards,
[SciChart Team]

PS: Our normal support channels (Forums, Support Tickets) are still open and operating, just we have now added this as well. 

The post New SciChart Tag on Stackoverflow! appeared first on SciChart.

Extreme Performance Optimization Survey

$
0
0

From time to time at SciChart HQ, we get asked for even more performance. Yes! I know it’s crazy, SciChart can easily handle 10 million points in real-time (or even up to 100 Million points at 2-4 FPS) in a line-chart, but sometimes we get asked ‘well, can you do more?’

So … wait … you want more than 10s of millions of points? … Ok then! .. 

So we had a go to try to optimize certain critical paths of SciChart’s WPF Chart. Right now, we’re already using unsafe code (pointer arithmetic in .NET) for our performance critical algorithms, plus DirectX for drawing, however there is the potential to move certain critical routines over to C++ with SSE (Streaming SIMD Extensions), which allow us to vectorize and hence accelerate certain numerical methods.

Simd-Performance-Wpf-Chart-Prototype

SciChart WPF Charts SIMD Prototype. 5x performance improvement for some chart types. More performance is possible if we do a whole program optimization.

Our prototype was pretty good! In just a few days, we managed to increase the overall performance of Resampling algorithms (used for lossless timeseries reduction) by 3-3.5x using C++/SSE*. That means a time-series chart which renders comfortably with 10M points at 30FPS can now render at the same framerate with 40M points. Or a chart that can render (albeit slowly) with 100M points can now handle 400M points.

But resampling doesn’t improve everything. In fact, from our own internal tests and extensive experience building High Performance Chart controls we know that Measuring and Improving Charting Performance is extremely complex and with many different pathways, we have to change many parts of the code to provide an optimum overall solution to deliver super High Performance WPF Charts.

For instance, we can move our rendering code to C++. Currently all our rendering is done in C# using interfaces and we transform points one at a time from data to pixel coordinates and vertices! The whole thing could be improved – a lot – if we moved some parts of the code over to C++ and started working in batches.

So, before we embark on this road of painstaking optimization, we’d like to know from you, our user base, how important is it to you? We have a simple Yes or No question “Should we optimize for even more performance?”.

* This optimization introduces a dependency on the Visual C++ Runtime, which must be installed on end-user PCs (pretty easy, but you should be aware of it).

Survey

Please find the survey below. If you’d like to comment, please do so at the footer of this article.

Create your own user feedback survey

The post Extreme Performance Optimization Survey appeared first on SciChart.

SciChart WPF v4.0.6 Build 8482 Released

$
0
0

We are pleased to announce a Stability Update to the SciChart WPF SDK v4.

This release addresses bug fixes which have been reported by our users over the past few weeks. It is therefore recommended for all users of SciChart WPF v4 to update due to the number of minor issues addressed in this patch.

If you are using SciChart v4.x then this update is a drop-in replacement. If you are still using SciChart v3.6.1 we invite you to take a look at SciChart v4 and our migration guide. We’ve made it easier than ever to jump to the latest major version!  

What’s New in v4.0.6.8482?

Fixed

  • Fixed bugs with placement labels behavior on AxisMarkerAnnotation, horizontal\verticalAnnotation
  • SC-3461 AnnotationLabel incorrect alignment when hiding/showing
  • Added fixes for MultipleXAxis example(top and bottom alignment for labels)
  • SC-3461 AnnotationLabel incorrect alignment when hiding/showing. Added fixes for 3 different cases of using label alignments(horizontalLineannotation, cursor, multiple y). Fixes for annotations alignments used with SeriesValueAxisMarkerAnnotation
  • SC-3461 AnnotationLabel incorrect alignment when hiding/showing. Fixed wrong alignment with the scichartSurface.Padding
  • Made DataSeries._lastPointSeries protected so you can subclass DataSeries and access the last resampled point series
  • Fixed SquarePointMarker not respecting StrokeThickness in some cases.
  • Fixes sizes of Pointmarkers does not match requested size, leading to poorer performance in some cases and visual anomalies in others.
  • SC-3222: fixed issue when text annotation changes its size after zoom in or zoom out
  • fixed Annotations Serialization missing some properties
  • Added possibility to change style and template of tooltips on different VerticalLineAnnotation in VerticalSliceModifier
  • SC-3447 Fixed Serialization issues when exporting SciChartSurface to memory. Added fixes for some Annotation properties (LabelPlacement, LabelValue, LabelTextFormatted). Added fixes for some LegendModifier properties (LegendPlacement, Orientation, ShowLegend, GetLegendDataFor)
  • Fixes issue where Axis does not serialize Visibility, SciChartSurface does not serialize Padding. used by ExportToFile with non-standard size and high quality export.
  • SC-3438 Investigate binding errors in the Default theme. Added fallbackvalue for DefaultPointMarker dataContext
  • Fixes alpha blending of semi-transparent lines in PointLineRenderableSeries3D
  • Fixes a bug where ExportToFile() fails with UseHighQualityOutput when the chart was an in-memory chart.
  • SC-3461 AnnotationLabel incorrect alignment when hiding/showing
  • SC-3460: fixed bug when rollover modifier’s data context isn’t updated after series selection
  • SC-3438 Investigate bindings in the Default theme
  • Fix for ArgumentOutOfRange exception in ExportToFile option
  • SC-3448 fixed scrollbar crash
  • Fixed ExportToFile issue when legend or annotations shows on output file but shouldn’t
  • Throw if set RenderSurface when SciChartSurface is disposed. Prevents memory leak
  • Fixed the issue with LabelTextFormatting when it is set in Style/Template
  • DirectX: when line thickness is 1, and no antialising, use DXLines primitive for best performance
  • fix memory leak in SciChart 3D Meshes when resizing the chart
  • On clear of VerticalSliceModifier.VerticalLines, also remove tooltips.
  • SC-3422 Investigate strange lines appearing with LogarithmicAxis. Fixes issue where negative number in the data causes incorrect rendering or a crash when Logarithmic Axis is used
  • Fixed HitTest in StackedMountainRenderableSeries when TooltipModifier tooltips get a wrong SeriesInfo
  • Fixed RolloverModifier marker when it hovers in wrong place on FastLineRenderableSeries (It occurs when IsInterpolated == True, DrawNaNAs == ClosedLines on a LineSeries and there are NaN data points inside it)
  • Fixes PointMetadata column not cleared when calling DataSeries.Clear()
  • Fixes PointMetadata column does not work in FIFO mode
  • Fixed bug when anchor point annotations are not located properly after size changing
  • SC-3405 Fixed TooltipModifier Tooltips when they do not appear for series according to their Z-order
  • Fix for Direct3D10RenderSurface.DrawEllipse not drawing ellipses in some cases
  • Fixes the heatmap blending issue. Blending alpha channel of incoming pixel + destination taking account for heatmap overall opacity + tests.
  • Fixes issue where double.NaN was not drawn as transparent in Heatmaps in the HighSpeed and HighQuality software renderers only
  • Fixes NullReferenceException if GetLegendDataFor.AllVisibleSeries is specified in an MVVM application
  • Fixes compilation issue in WPF Performance demo
  • SC-3341 Fixed issue when tooltip become clipped in PolarCharts
  • SC-3399 Added a capability to export to XPS to the ExportToFile method
  • SC-3222, SC-3391: fixed bug when TextAnnotation resizes on zoom

SciChart Android / iOS Coming Soon!

Over the past year, we’ve been working hard to port SciChart to iOS / Android and these are going to be released very soon. We are just finalising the packaging, distribution and documentation for SciChart iOS / Android v1 and will be announcing these shortly.

SciChart for Android is shaping up to be the worlds fastest Android Chart by an order of magnitude, capable of drawing millions of points in real-time on Android devices. Perfect for financial, medical or engineering applications, embedded systems and automotive systems.

SciChart for iOS is also capable of drawing millions of points with instant zoom/pan and offers smooth and stutter free real-time charting on iPad and iPhone devices.

Both are going to be announced shortly, but in the meantime, here is a quick preview of SciChart for iOS and Android in the two videos below.

Screen Shot 2016-04-09 at 15.42.42 Screen Shot 2016-04-09 at 15.42.47

Where to get SciChart Downloads?

The usual places: Installers from the Downloads page, Packages from NuGet and source-code via Github!

GET SCICHART v4.0.6

Best regards,
[SciChart Team]


The post SciChart WPF v4.0.6 Build 8482 Released appeared first on SciChart.

Viewing all 302 articles
Browse latest View live