Quantcast
Channel: SciChart
Viewing all 302 articles
Browse latest View live

SciChart.com website update / Password Reset, Site Login

$
0
0

We are pleased to announce an update to the SciChart website today, addressing several issues with the site login / membership / user accounts and password reset functionality, which have been reported to us by our users.

We have also improved the security of site membership and password reset no longer sends plain text passwords via email to the requester, but instead sends a link to renew or reset a password.

The roll-out of the website changes requires no action on your part.

However, if you do experience any issues with site login, particularly with the Chrome browser, we recommend clearing your browser cache as old files may be stored on disk.

Best regards,
[SciChart Team]

The post SciChart.com website update / Password Reset, Site Login appeared first on SciChart.


SciChart NuGet Feed – Reliability Update

$
0
0

Back in October 2014 when we announced our NuGet feed for nightly builds, we never realised that in just over 6 months we’d have almost 5,000 downloads and many of our customers integrating SciChart packages directly into their build systems!

So when the ABT Software NuGet feed (which we host ourselves) goes down, we get support requests, sometimes within minutes. It’s affecting your work, as a lot of you have come to rely on it, and you need near 100% uptime.

As a result, today we’re trying out a professional hosted NuGet service – provided by myget.org. We have a new experimental feed up which you can access today. If this goes well we will switch over to MyGet permanently, but for now both feeds are active.

Give the new feed a try, the Feed URL is

Setting up Visual Studio to get SciChart Packages via NuGet

Have a look at our page Getting SciChart Nightly Builds with NuGet which shows you how to setup Visual Studio to consume packages from the ABT Software NuGet feed. To try the new feed, simply create a new connection, e.g. ABT Software (2) and use the new URL which is https://www.myget.org/F/abtsoftware/api/v2.

ToolsOptionsNuget

Adding NuGet Package sources via Visual Studio -> Tools -> Options -> NuGet Package Manager -> Package Sources

We will run both feeds in parallel for a while, and depending on your feedback, we might switch over permanently to the new MyGet feed.

Let us know your feedback!

  • The new NuGet feed is experimental and we require your feedback before switching over permanently. For the time-being, we will run both feeds in parallel.
  • The new feed runs over SSL on port 443 (https). Customers behind corporate firewalls or proxies should now be able to access the new feed where the previous feed was blocked, since it was on port 81.
  • The new experimental feed is NuGet as a Service provided by MyGet – professional NuGet hosting. We’re plugging it as the owner responded to our support requests almost as fast as we do, so this is our way of saying thanks ;-)

Best regards,
Andrew
[SciChart Team]


The post SciChart NuGet Feed – Reliability Update appeared first on SciChart.

SciChart v3.4.1 Build 6431 Released

$
0
0

We are pleased to announce a Minor update to SciChart High Performance WPF Charts

This builds upon our feature-packed v3.3 and v3.4 releases over the last few months. See our Latest Releases Category for details of our releases.

This release contains several critical bug fixes and it is strongly recommended to upgrade if you are using SciChart v3.x. Since v3.2, we are now following semantic versioning and this should be backward compatible to SciChart v3.2, v3.3 and v3.4, and it is safe and recommended to upgrade subject to testing your application.

What’s New in v3.4.1.6431?

Fixed

  1. SC-2716 Line Clipping Algorithm fix in all three renderers (HQ, HS, DX)
  2. SC-2718, SC-2132 Polygon clipping now implemented for Mountain area rendering

    Zooming until VisibleRange.Max-Min was smaller than 1E-5 causes artifacts in line and mountain rendering in DirectX, High Quality, High Speed Renderer plugins including disappearing lines, incorrect line position, flickering lines, flickering mountain areas, disappearing or jagged or incorrectly positioned mountain areas

    This is a critical fix which affects the visual output of the chart when using line or mountain series when the VisibleRange.Max-Min is small

    All series and Renderer Plugins now support zooming to VisibleRange.Max-Min <= 1E-12, which is near the limit of precision for double (64bit) in .NET

  3. SC-2720 Fixed inaccurate positioning of lines where StrokeThickness > 1d in the High Speed renderer, where the line segment is not centered on the X,Y coordinate
  4. SC-2723,1974 Fixed an AntiAliasing issue when drawing artifacts appeared for vertical lines at the edges of the viewport
  5. SC-2710 Fixed a bug with StackedColumnRenderableSeries where XAxis Labels are shifted with respect to column position
  6. SC-2719 Fixed a bug where the size of axis ticks were considered during layout even though ticks were set not to appear
  7. SC-2724 Fixed an issue within the BodyBrush DependencyProperty definition for FastBoxPlotRenderableSeries
  8. SC-2722 Hit-test fix: StrokeThickness is considered during hit-test on series with bodies
  9. SC-2721 Hit-test fix: hitTestRadius is ignored during hit-test on series with bodies
  10. SC-2728 Fixed hit-test on rotated stacked series
  11. SC-2731 StackedColumns aren’t scaled to fit the area if the only data point
  12. SC-2735 Fixed an exception during hit-test when unsigned data types are used
  13. SC-2738 WPF performance demo scatter chart crash fixed
  14. SC-2704 SciChartSurface.ZoomExtents should not apply zoom to axis which has no DataSeries
  15. SC-2705 AxisBase.VisibleRange bindings being lost/overwritten in some cases
  16. SC-2702 StackOverflowException when adding and removing annotations
  17. SC-2700 Fix a recursive layout bug where SciChartSurface re-sized continually in the Visual Studio designer
  18. SC-2706 Fixed LabelTickToIndent Binding Error
  19. SC-2711 Reverted breaking API change introduced in v3.4.0: ChartModifierBase.OnYAxesCollectionChanged, OnXAxesCollectionChanged function signature had changed, now back to the pre v3.4 signature.
  20. SC-2712 Candlestick/OHLCRenderableSeries int arithmetic overflow during drawing
  21. SC-2714 Bug in SciChartScrollbar: viewport overlaps left re-sizing grip ( changed SciChartScrollbar template to prevent overlapping of re-sizing grips by viewport )
  22. SC-2717 SeriesInfo isn’t initialized properly via the constructor which takes 1 param

Where can I get it?

To get SciChart High Performance WPF Charts v3.4.1 please head over to our Downloads page, or, you can get the binaries alone at our Nightly Build page. Source-code customers in support will be emailed shortly with an update. You can find the Source-code URL in the License Certificate email that you receive!

The post SciChart v3.4.1 Build 6431 Released appeared first on SciChart.

support.scichart.com outage

$
0
0

As of Monday 22nd June 2015 08:00 UTC, the support site http://support.scichart.com due to a problem with the data-centre.

Update as of 15:00 UTC 23rd June:

Our webhost for support.scichart.com informs us that they experienced a cyber attack on Sunday at 12:10 PM causing significant outages and extended periods of unavailability. They are slowly bringing services back online between now and the end of the week. 

All other systems (including Licensing server, NuGet, scichart.com) are unaffected and are online. We are also able to handle support requests via email at support@scichart.com.

For urgent support requests, the following support channels are still open:

  • Email support [at] scichart [dot] com
  • Email sales [at] scichart [dot] com
  • or, use our online Forums.

Update as of 09:45 30th June:

Our web host has provided a backup from off-site location of the support site, but has not yet been able to restore support.scichart.com. We expect to get this back online soon, one way or another. In the event (unlikely, we hope) that support.scichart.com is unrecoverable, we will be investing in a new support desk asap, since it’s a central part of our business, and, a big value-add to you, the customer.

We at SciChart thank you for your patience during this time and we promise we will make it up to you!


Best regards
[SciChart HQ]

The post support.scichart.com outage appeared first on SciChart.

support.scichart.com is back!

$
0
0

After last weeks outage of support.scichart.com, we are pleased to announce that the SciChart support desk is back!

The outage was caused by a chain reaction at a data-centre, resulting in critical mass and an implosion of antimatter, causing a rift in the space-time continuum, which is why it took so long to get the site back online. 

Not really … What really happened was one of our web-hosts dropped the ball, big-time. However, we take ultimate responsibility and we will be investing to ensure this does not recur.

So, the support desk is now open again! \o/

Just open a ticket, or email the usual sales or support email and it will convert into tickets. Note the forums are still open at www.scichart.com/questions and they’ve been receiving some love recently. Don’t stop! We like public questions because they become public search results and help us to help you.

Anyway, thank you for bearing with us during this tough week and thank you for your patience and trust.

Best regards,
[SciChart Team]

The post support.scichart.com is back! appeared first on SciChart.

support.scichart.com now migrated to MediaTemple – with 99.999% uptime!

$
0
0

Following last month’s outage of support.scichart.com we have upgraded our web-host to use MediaTemple, a managed VPS service which has been recommended to us as providing outstanding customer support and an SLA-backed 99.999% uptime.

Take a look at the SLA below:

Media Temple offers a 99.999% service Uptime Guarantee on our DV products*. If we ever fall short, you get 20% of your monthly hosting fee back for each 20 minutes of downtime that month. That’s the DV 20/20 Uptime Guarantee.

99.999%! Insane, right!

This is part of our commitment to provide quality services to you, and the support.scichart.com outage showed us really how much both you, and we depend on this service, so we have invested to make it right.

So here’s to the next 365 days of the support-desk and hopefully, to less than 5-minutes of downtime!

Best regards,
[SciChart Team]


The post support.scichart.com now migrated to MediaTemple – with 99.999% uptime! appeared first on SciChart.

Using the VerticalSliceModifier

Insane WPF Scatter Chart performance with Parallel Rendering

$
0
0

Today one of our first ever customers (dan danna naah!) contacted us after 3-years and asked about our Scatter Chart performance. They are still using v1.x of SciChart and wanted to know if it was possible with the latest version to draw a million points in a scatter chart at interactive framerates, and what performance improvements we had achieved over the years.

This was a chance for us to show off, I thought!! :-)

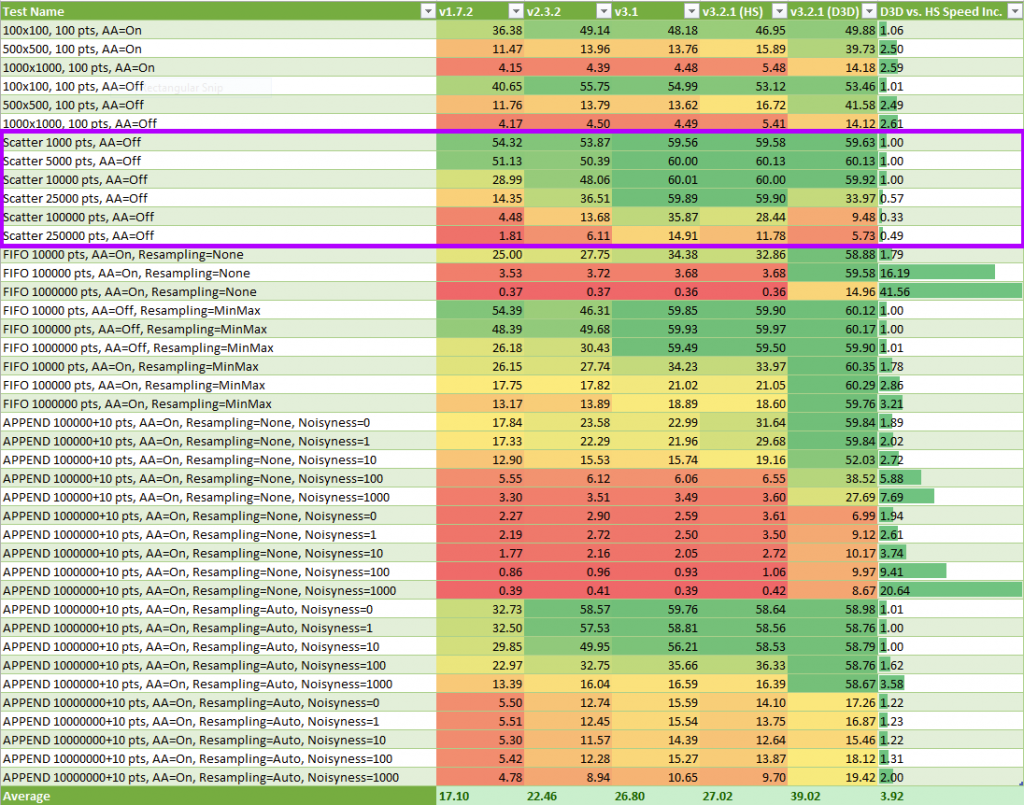
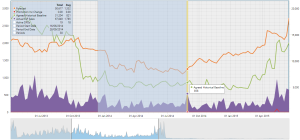
Well, over the major versions we have focused on performance (see our article How Fast is SciChart WPF Chart). SciChart has gotten faster over the major versions as you can see below and in the article above:

ScatterPerformance

Scatter performance in our tests has improved from about 1.8 FPS for 250k points in v1.7 to 12FPS in v3.2, about a 6x speed improvement. This is good, but not quite good enough, the customer would like to draw 1,000,000 points in a scatter chart ….

Parallel Rendering for Scatter Charts

An old FAQ on the SciChart forums show a quick hack to enable multi-threaded rendering for the EllipsePointMarker type. This gives a decent boost in scatter chart performance on dual and quad core machines.

Unfortunately the sample no longer compiles, it only works with SciChart v3.1. So we took this as a starting point and re-worked it for SciChart v3.4.

A small update to the SciChart BasePointMarker API

We needed to add a small enhancement (backward compatible) to the BasePointMarker type. This has been added to v3.4.2.6726 and above which you can get from our NuGet feed. This allows us to be notified in the pointmarker when a batch begins and ends and do some caching.

A new ParallelEllipsePointMarker type

With our new slightly modified API, we can create a new ParallelEllipsePointMarker type that takes advantage of the Begin/End batching.

public class ParallelEllipsePointMarker : BasePointMarker
{
    private float _width;
    private float _height;
    private readonly List<Point> _points = new List<Point>();
    private IPen2D _pen;
    private IBrush2D _brush;

    /// <summary>
    /// When overridden in a derived class, draws the point markers at specified collection of <see cref="Point" /> centers
    /// </summary>
    /// <param name="context">The RenderContext to draw with</param>
    /// <param name="centers">The Centres of the point markers</param>
    /// <param name="pen">The default Stroke pen (if current pen is not set)</param>
    /// <param name="brush">The default Fill brush (if current brush is not set)</param>
    /// <seealso cref="IRenderContext2D" />
    ///   <seealso cref="IPen2D" />
    ///   <seealso cref="IBrush2D" />
    protected override void DrawInternal(IRenderContext2D context, IEnumerable<Point> centers, IPen2D pen, IBrush2D brush)
    {
        Action<Point> drawOp = (center) =>
        {
            context.DrawEllipse(pen, brush, center, _width, _height);
        };

        // This will only work for some drawing functions, like DrawEllipse. Consider this experimental
        Parallel.ForEach(centers, drawOp);
    }

    protected override void DrawInternal(IRenderContext2D context, double x, double y, IPen2D pen, IBrush2D brush)
    {
        _pen = pen;
        _brush = brush;
        _points.Add(new Point(x, y));
    }

    public override void Begin(IRenderContext2D context, IPen2D defaultPen, IBrush2D defaultBrush)
    {
        base.Begin(context, defaultPen, defaultBrush);

        _width = (float) Width;
        _height = (float) Height;
        _points.Clear();
    }

    public override void End(IRenderContext2D context)
    {
        DrawInternal(context, _points, _pen, _brush);
        base.End(context);
    }
}

The above class keeps a List of Points which is cleared on Begin() and drawn on End(). Every call to DrawInternal with a single x,y point is added to the Points. In End() we draw all points using Parallel.ForEach.

Performance of ParallelEllipsePointMarker

The performance of the ParallelEllipsePointMarker is better than the standard EllipsePointMarker. Take a look at the below. While our standard point-marker achieves barely 4.5FPS for 1,000,000 points, the Parallel Ellipse Point Marker is able to push out around 15FPS on an i7 Quad-core workstation.

ParallelEllipsev3.4.2

Overdraw and Contention

This is good but there is some overdraw. Imagine if you had 1,000,000 scatter points drawn all at the same X,Y location. The above implementation would be grossly inefficient. Also, the Parallel.ForEach spawns goodness knows how many threads and context switching between them will start to become an overhead. Having fewer threads active will be a good thing for performance. Ideally, there should be no more threads than there are CPUs.

ClusteredParallelEllipsePointMarker

What about clustering and parallel drawing? … Whoa there! Don’t get too excited!

We had a go at a simple, almost lossless clustered parallel point marker. See the code below:

public class ClusteredParallelEllipsePointMarker : BasePointMarker
{
    private float _width;
    private float _height;
    private IPen2D _pen;
    private IBrush2D _brush;
    private byte[,] _pointsDrawn;
    private int _viewportWidth;
    private int _viewportHeight;

    /// <summary>
    /// When overridden in a derived class, draws the point markers at specified collection of <see cref="Point" /> centers
    /// </summary>
    /// <param name="context">The RenderContext to draw with</param>
    /// <param name="centers">The Centres of the point markers</param>
    /// <param name="pen">The default Stroke pen (if current pen is not set)</param>
    /// <param name="brush">The default Fill brush (if current brush is not set)</param>
    /// <seealso cref="IRenderContext2D" />
    ///   <seealso cref="IPen2D" />
    ///   <seealso cref="IBrush2D" />
    protected override void DrawInternal(IRenderContext2D context, IEnumerable<Point> centers, IPen2D pen, IBrush2D brush)
    {
        // This method is ignored by v3.2 and up...
    }

    protected override void DrawInternal(IRenderContext2D context, double x, double y, IPen2D pen, IBrush2D brush)
    {
        _pen = pen;
        _brush = brush;
        int ix = (int)x;
        int iy = (int)y;

        // If out of bounds, skip
        if (ix < 0 || iy < 0 || ix >= _viewportWidth || iy >= _viewportHeight)
            return;            

        // If pixel already marked as ignored, skip
        if (_pointsDrawn[ix, iy] == 0xFF)
            return;

        // Set pixel as marked to draw
        _pointsDrawn[ix, iy] = 0x1;

        // Below here
        //
        // This introduces a very very slight loss by also marking the surrounding pixels to a Point-Marker as
        // ignored (using 0xFF). We will prevent drawing to these pixels as well
        // Comment out this section below if you wish to have a true lossless clustered parallel pointmarker
        // 

        // Set surrounding pixels as marked to ignore
        if (ix < 1 || iy < 1 || ix >= _viewportWidth-1 || iy >= _viewportHeight-1)
            return;   

        _pointsDrawn[ix - 1, iy - 1] = 0xFF; // x x x
        _pointsDrawn[ix - 1, iy]     = 0xFF; // x o x
        _pointsDrawn[ix - 1, iy + 1] = 0xFF; // x x x
        _pointsDrawn[ix,     iy - 1] = 0xFF;
        _pointsDrawn[ix,     iy + 1] = 0xFF; // when a point is drawn at o, do not allow any points to be drawn at x
        _pointsDrawn[ix + 1, iy - 1] = 0xFF;
        _pointsDrawn[ix + 1, iy]     = 0xFF;
        _pointsDrawn[ix + 1, iy + 1] = 0xFF;
    }

    public override void Begin(IRenderContext2D context, IPen2D defaultPen, IBrush2D defaultBrush)
    {
        base.Begin(context, defaultPen, defaultBrush);

        _viewportWidth = (int)context.ViewportSize.Width;
        _viewportHeight = (int)context.ViewportSize.Height;

        if (_pointsDrawn == null || _pointsDrawn.GetLength(0) != _viewportWidth ||
            _pointsDrawn.GetLength(1) != _viewportHeight)
        {
            _pointsDrawn = new byte[_viewportWidth, _viewportHeight];
        }
        else
        {
            Array.Clear(_pointsDrawn, 0, _pointsDrawn.Length);
        }
        _width = (float)Width;
        _height = (float)Height;
    }

    public override void End(IRenderContext2D context)
    {
        Parallel.For(0, _viewportHeight, y =>
        {
            for (int x = 0; x < _viewportWidth; x++)
            {
                if (_pointsDrawn[x, y] == 0x1)
                {
                    context.DrawEllipse(_pen, _brush, new Point(x,y),  _width, _height);
                }
            }
        });

        base.End(context);
    }
}

So how does it work?

On Begin() we declare a Byte array the same size as the viewport. This byte array, any point-marker to draw we set a byte to 0x1. Any point-marker to ignore will remain 0x0.

For extra credit, we can optionally set points surrounding an 0x1 (point to draw) with 0xFF: a point to ignore. This means that if two or more scatter points are to be drawn within a 1-pixel distance of each other, only one scatter point will be drawn, reducing overdraw.

Second, because we’re using a Byte array and not a List of points, we’re avoiding memory creation on each pass. The Byte array is only recreated if the viewport is resized.

Finally, we use Parallel.For to iterate over rows of the byte array. Sure there is some cache missing here as we’re reading from all over the byte array, but at least we have a maximum of one Task or thread per row, not one per pixel :)

Performance of the ClusteredParallelEllipsePointMarker

The performance is pretty insane. Take a look at the below. While our standard EllipsePointMarker achieves barely 4.5FPS for 1,000,000 points, the ClusteredParallelEllipsePointMarker above is able to push out a whopping ~30FPS on an i7 Quad-core workstation.

ClusteredParallelEllipsev3.4.2

A note about DirectX

The attached sample allows you to compare HighSpeed (CPU) vs. DirectX scatter performance. If you run it, you’ll probably be disappointed that DirectX is considerably slower than a parallel enabled CPU rendering. We’ve done some analysis and can see some low-hanging fruit to vastly improve the DirectX rendering of scatter charts. Note that DirectX is considerably faster for line charts however.

Also note that Parallel-enabled point markers are only compatible with the HighSpeed (CPU) renderer. The other renderers are not suitable to parallelise on the CPU, although DirectX by its very nature is highly parallel and we will be working to improve it.

Conclusion

If ClusteredParallelEllipsePointMarker was able to achieve near 30FPS at 1,000,000 points, but our previous speed test clocked SciChart v3.2’s EllipsePointMarker at 4.5FPS points and SciChart v1.7’s point-marker at 1.8FPS for 250k points then our solution is approx ~60x faster at drawing scatter charts than SciChart v1.x.

So, how did we do? 😉

Download the sample below

ParallelPointMarkers

Requires SciChart v3.4.2.6726 or above to run.

To test performance, run in Release mode with the debugger Detached!


The post Insane WPF Scatter Chart performance with Parallel Rendering appeared first on SciChart.


DirectX Scatter Chart Performance Fixed!

$
0
0

Just a quick update from our weekend warriors working hard to make SciChart the best High Performance WPF charting platform:

You may have seen we mentioned that DirectX Scatter chart performance is worse than software (see How Fast is SciChart’s WPF Chart and Insane WPF Scatter Chart Performance with Parallel Rendering).

You’ll be pleased to know we’ve done some extreme optimization and managed to get a near 50x performance increase for 1,000,000 points scatter chart with DirectX. See the animated gif below:

v3.4_vs_Trunk_D3D

This will be available as part of the SciChart v4 SDK later in the year. Until then, you can always get high-performance scatter charts using the parallel rendering trick we presented here!

Best regards,
[SciChart HQ]

The post DirectX Scatter Chart Performance Fixed! appeared first on SciChart.

SciChart v3.4.2 Build 6778 Released

$
0
0

We are pleased to announce a Minor update to SciChart High Performance WPF Charts

This builds upon our feature-packed v3.3 and v3.4 releases over the last few months. See our Latest Releases Category for details of our releases.

This release contains several critical bug fixes and it is strongly recommended to upgrade if you are using SciChart v3.x. Since v3.2, we are now following semantic versioning and this should be backward compatible to SciChart v3.2, v3.3 and v3.4, and it is safe and recommended to upgrade subject to testing your application.

What’s New in v3.4.2.6778?

Fixed

      1. SC-2840 Added a temporary workaround for the issue where RenderSurface size was constantly growing. This was the root cause of several issues including annotations in the wrong location, tooltips clipped at the right side of the viewport
      2. SC-2838 ExportToBitmapSource() is not on ISciChartSurface interface
      3. SC-2823 Unable to format FastHeatmapRenderableSeries cell labels (Workaround – via FormatLabel method override)
      4. SC-2821 MouseWheelZoomModifier Scroll doesn’t work if axis is collapsed
      5. SC-2820 Minor Improvements to Scatter Chart performance in High Speed renderer.
        • Small change to IPointMarker, now has a Begin() and End() method which signifies the start and end of a batch.
        • BasePointMarker.AntiAliasing property added, default binds to XyScatterRenderableSeries.AntiAliasing.
        • XyScatterRenderableSeries.AntiAlisiasing default FALSE
        • Result: EllipsePointMarker = 50% faster, CrossPointMarker = 50% faster, Triangle, Square = 100% faster
      6. SC-2816 Fixed an issue with a crash during tick labels rendering because of inherited DataContext
      7. SC-2797 Fixed a bug with too large RenderSurface if under some surface’s configurations
      8. SC-2814 NullReferenceException in XAML designer if LabelProvider is null
      9. SC-2812 Fixed the issue when modifiers throw if there were several X axes with IsPrimaryAxis=”True”
      10. SC-2808 Cannot bind to MouseWheelZoomModifier.XyDirection due to DependencyProperty Precedence issue
      11. SC-2807 Fixed the annotation label binding when AxisId gets changed on the parent annotation
      12. SC-2792 Polar Chart wrong ranges with collapsed axes
      13. SC-2804 Add polygon clipping for BandSeries (incorrect rendering when polygon was partially outside of the viewport)
      14. SC-2801 Fixed first PointMarker is not drawn after one or more NaN
      15. SC-2798 When AnnotationBase.XAxisId or YAxisId is invalid, an exception is thrown which prevents all rendering. Instead, we have added RenderPassInfo.Warnings which is a List which can be populated at any time during rendering and will be displayed in the output window when SciChartSurface.DebugWhyDoesntSciChartRender = true
      16. SC-2788 Fixed the issue with NullReferenceException thrown if MouseEventGroup used on Collapsed surfaces.
      17. SC-2789 Fixed the issue with incorrect behaviour of Horizontal/VerticalLineAnnotations in case of a vertical chart.
      18. SC-2785 The TickCoordinates structure has been made public with all its members
      19. SC-2768 Fixed animation interference e.g. when Zooming then Zooming to Extents immediately after, animations conflict
      20. SC-2781 Fixed the issue where minor grid lines had not been shown with MajorDelta set and zoomed in between two major ticks
      21. SC-2775 Fixed the bug with the ThemeManager.ThemeApplied event constantly firing during redraw.
      22. SC-2774 Fixed Regression bug: Log(0) incorrect drawing with LogarithmicAxis
      23. SC-2770 Small change to Heatmap2DArrayDataSeries to ensure all implementations of XValues, YValues return the same results
      24. SC-2714 Bug in SciChartScrollbar: restored deleted fix – viewport overlaps left resizing grip
      25. SC-2770 Heatmap2DArrayDataSeries does not correctly implementing IDataSeries.YValues
      26. SC-2769 Fixed the initialization of TickProvider, added unit tests
      27. SC-2764 Prevented rendering of a surface is not visible; prevented drawing of axis if not visible
      28. Added DirectXHelper.cs class which uses an attached property to create directx renderer or fallback to software (HQ). This is also referenced in the article http://support.scichart.com/index.php?/Knowledgebase/Article/View/17264/44/easy-fallback-from-directx-to-software-rendering-without-code-behind
      29. SC-2761 Fixed StackedColumnsSeries doesn’t work with a logarithmic YAxis
      30. SC-2760 Fixed regression bug VerticalLineAnnotation isn’t displayed if axis is collapsed
      31. SC-2750 Fixed tiny 1-pixel gaps in line series when using the DirectX Renderer plugin
      32. SC-2740 Fixed StackedColumns throw during rendering when some series are outside the viewport

Where can I get it?

To get SciChart High Performance WPF Charts v3.4.2 please head over to our Downloads page, or, you can get the binaries alone at our Nightly Build page. Source-code customers in support will be emailed shortly with an update. You can find the Source-code URL in the License Certificate email that you receive!

The post SciChart v3.4.2 Build 6778 Released appeared first on SciChart.

Should we be supporting Silverlight?

$
0
0

Since Microsoft announced the end-of-life for Silverlight in 2012, support for this platform has waned. We are still supporting Silverlight for a number of reasons, but we want to hear from you what you think about this platform, and whether we should continue supporting it after the next major version (v4) of SciChart.

Please take 5 minutes to answer our short survey on whether we should continue to support Silverlight: https://www.surveymonkey.com/r/K6ZV3MF

What are the benefits of supporting Silverlight?

  • We have a Silverlight demo at www.scichart.com/demo which is identical in features to the WPF version
  • The Silverlight demo is a valuable pre-sales tool and can be shown to managers, purchasers and stakeholders without downloading the SciChart trial.
  • It is also a valuable support tool, we often refer to the Silverlight demo in forum posts and support emails.
  • We do have some (but very few) Silverlight customers.
  • Keeping our code Silverlight compatible might make it easier to port to Universal Windows Platform (UWP10).

What are the drawbacks of supporting Silverlight?

  • The Silverlight platform is buggy, and when we develop features, particularly new features, we often have to do twice as much work to ensure it works on Silverlight.
  • Supporting Silverlight means our progress is slower on WPF.
  • In the future, many planned features require DirectX hardware acceleration, which will not be available on Silverlight
  • Several browsers no longer support Silverlight, such as Chrome, Edge (Windows 10 browser). Only Firefox and IE<11 remain.
  • Silverlight is slower than WPF, we actually give SciChart performance a bad name by demonstrating it in Silverlight.

So what do you think?

Should we continue to support Silverlight after the next major version of SciChart? We propose to keep v3.x but in v4.x to phase our support for the Silverlight version of SciChart and the Silverlight demo, replacing it with a trial download for the WPF demo, depending on what you answer in our questions.

Please take 5 minutes to answer this short survey! https://www.surveymonkey.com/r/K6ZV3MF

The post Should we be supporting Silverlight? appeared first on SciChart.

Special Offer: 25% more support/updates until September 6th

$
0
0

Special Offer: 25% more support/updates

From 10th August – September 6th we are running a special offer on all SciChart Licenses and renewals.

  • SciChart WPF Professional / Source Code: 15 months support/updates for the price of 12 (+25%)

  • SciChart WPF Basic: 112 days support/updates for the price of 90 days (+25%)

What this means is, if you buy or renew SciChart WPF Professional or SciChart source-code edition, instead of your support expiry being in 1-year, it will be in 15 months time.

The pricing, renewal and other licensing terms haven’t changed, just your support/updates subscription will be extended by 25%.

How to get this offer

To take advantage of the offer, simply purchase or renew SciChart licenses between now and September 6th 2015. Everything’s set up, and the system will simply issue you a license with more time. So hurry, don’t delay, secure your additional support/updates today!

The post Special Offer: 25% more support/updates until September 6th appeared first on SciChart.

Protected: SciChart Roadmap 2015/2016

Hello VS2015 World! SciChart running under .NET4.6

$
0
0

A few people have asked whether SciChart supports .NET4.6 and Visual Studio 2015 and Windows 10.

SciChart v3.4.2

SciChart v3.4.2 is compiled as .NET4.0 only, however, .NET 4.0 assemblies are compatible with applications that run under .NET4.0, .NET4.5, .NET4.5.1, .NET4.5.2 and .NET4.6.

SciChart v3.4.2 is fully compatible with Visual Studio 2015 and we have tested it on Windows 10. You can include SciChart v3.4.2 in VS2015 / .NET4.6 apps with no changes.

VS2015_SciChart_Net46

That shiny NuGet Package Manager in VS2015

VS2015_SciChart_Net46_HelloWorld

Hello .NET4.6 World! Using SciChart v3.4.2 and VS2015

SciChart v3.4.3 Nightly Build 6817

We have hacked modified our Nightly Build to output the following targets for SciChart v3.4.3 and above.

  • .NET4.0, Release, AnyCPU
  • .NET 4.5, Release, AnyCPU (Available after v3.4.3.6817)
  • .NET 4.6, Release, AnyCPU (Available after v3.4.3.6817)

If you download v3.4.3.6817 (or later) via our NuGet Feed you should be able to see the following packages.

Packages

You can verify the MSIL version for each using the excellent JetBrains dotPeek (we did! It tells you more than the Visual Studio properties window, that’s for sure). Just don’t decompile all our source codez or we’ll be upset 😉

FrameworkVErsions

In the official releases we will also start shipping .NET4.0, 4.5, 4.6 with our installer, but for now the only way to get other framework versions is via NuGet.

Let us know your feedback!

Best regards,
[SciChart Team]

The post Hello VS2015 World! SciChart running under .NET4.6 appeared first on SciChart.

SciChart WPF v3.5.0 Build 7128 Released

$
0
0

We are pleased to announce a Minor update to SciChart High Performance WPF Charts

This release contains several critical bug fixes and some minor features. Since v3.2, we are now following semantic versioning and this should be backward compatible to SciChart v3.2, v3.3 and v3.4, and it is safe and recommended to upgrade subject to testing your application.

What’s New in v3.5.0.7128?

New / Improved

  1. SC-2950 Added ability to customize SciChartOverview via RenderableSeriesType, RenderableSeriesStyle properties. Usage Example:


  2. SC-2923 Enabled SciChartScrollBar to work on the XAxis or YAxis where FastHeatmapRenderableSeries is used
  3. SC-2875 Enabled SciChartOverview to work with FastHeatmapRenderableSeries. This is achieved by the following code:


  4. SC-2912 FastHeatmapRenderableSeries tooltip always interpolates X and Y value. Added the abilty to obey UseInterpolation flag from RolloverModifier and Hit-Test API
  5. SC-2047 Added Direct3D10RenderSurface.UseAlternativeFillSource. When true, uses the Direct3D10Image.FillSourceRDP method always (usually used only when Remote Desktop enabled). This resolves some compatibility issues with the DirectX renderer on certain hardware
  6. SC-2922 Added property TextAlignment to TextAnnotation serialization
  7. SC-2921 Added properties BorderThickness, FontWeight, FontStyle to AnnotationBase serialization
  8. SC-3030 Improved installer theme and usability, outputting one .exe instead of two MSI’s (one of which failed to work)
  9. [No Issue] We now package and distribute .NET 4.6, 4.5 and 4.0 Assemblies with the installer and with NuGet

Fixed

  1. SC-3040 Fixed regression issue introduced in nightly build 3.4.3.6993 where Direct3D10RenderSurface could not be instantiated
  2. SC-3036 Fixed a large semi-transparent gray rectangle on the polar chart in some instances
  3. SC-3047 SciChartSurface that was never Loaded in the Visual Tree causes a memory leak
  4. SC-3041 Fixed an exception in Heatmap series Hit Test (used by rollovermodifier) in some instances
  5. SC-3043 Fixed an OutOfMemoryException which occurred when using LogarithmicNumericAxis for the YAxis and several series types, including FastColumnRenderableSeries , FastImpulseRenderableSeries
  6. SC-2992 IndexOutOfRangeException in DataSeries.get_YRange when scrollbar, empty fifo series used, caused by ArrayOperations.MinMax throwing if array length is zero
  7. SC-2980 Forcing InvariantCulture in parsing of all X1,X2,Y1,Y2 annotations from XAML
  8. SC-2980 Annotations with RelativeCoordinates do not display when machine locale has numbers in 123.456,00 format
  9. SC-2954 Fixed the issue with shifted annotation labels when axes are stacked. Also fixes the issue when Vertical/HorizontalLineAnnotation throws if AxisId isn’t set.
  10. SC-2773 Fixed the bug with ticks on PolarChart turned inwards
  11. SC-2944 Added ability to format SeriesValueModifier AxisMarkers by overriding SeriesValueModifier.FormatMarkerText method
  12. SC-2935 MouseManager.MouseEventGroup binding fails if DataContext set after SciChartSurface.Loaded
  13. SC-2927 AxisBase.DefaultAxisId constant is lost during obfuscation/deployment of scichart, leading to multiple issues related to AxisID not found etc…
  14. SC-2926 Incorrect startup range when XyDataSeries.TX=Int, Float (not double) and FastColumnRenderableSeries is used
  15. SC-2919 Memory leak when changing DataSeries on FastHeatmapRenderableSeries / and using SciChartOverview or Scrollbar
  16. SC-2920 Heatmap Series repeatedly throws exceptions in a loop when Scrollbar/Overview added, causing a performance problem when rendering
  17. SC-2918 Setting multiple YAxes before Annotations causes a NullReferenceException in AnnotationBase
  18. SC-2915 WPF Designer crashes when LineAnnotation is added with AxisId
  19. SC-2910 BorderThickness is not serialized in Annotations
  20. SC-2788 Further check for ParentSurface.IsVisible in ChartModifierBase.CanReceiveMouseEvents() to prevent crashes when scrolling or zooming charts linked by MouseEventGroup that are not visible
  21. SC-2906 AxisBase.Scroll crashes if chart surface is linked via MouseEventGroup to another chart but not shown
  22. SC-2904 Performance severely degraded in v3.2, 3.3, 3.4 vs. v3.1 when adding thousands of RenderableSeries to a SciChartSurface
  23. {No Issue} Small change to EEGChannelsDemo to reduce FPS dropouts and stutter

Where can I get it?

To get SciChart High Performance WPF Charts v3.5 please head over to our Downloads page, or, you can get the binaries alone at our Nightly Build page.
Source-code customers in support will be emailed shortly with an update. You can find the Source-code URL in the License Certificate email that you receive!

SciChart Source-Code via GitHub (BETA!)

We are building a new Nightly-Build deployment to Git-Hub for source-code customers!

http://www.scichart.com/github-repository-for-scichart-source-code-customers

If you are a SciChart Source-Code customer and you would like access to the repository while we prepare the repository, just email us with your GitHub username and we can grant access!

ABTSoftware_GitHub

Clone SciChart WPF Source via git or SVN clients!

The post SciChart WPF v3.5.0 Build 7128 Released appeared first on SciChart.


Github Repository for SciChart Source-Code Customers

$
0
0

Hey, you lovely SciChart people!

We have been working hard on a number of things behind the scenes to make it more easy and friendly for you to work with SciChart, and one of the ideas that the team had was to create a Nightly Build for source-code customers!

We realised that the DLLs get published to our NuGet feed on an almost nightly basis (which is great), but the source-code customers were left out, sad and alone, feeling unloved, receiving at best an email maybe once every month, or two months, with a new zip to download the source code :(

With our most valuable customers often weeks behind our latest version and feeling neglected, we put our heads together and came up with an idea!

Github Nightly Source-code Repository to the rescue!

The SciChart WPF Github Repository

The SciChart WPF Github Repository is now available at https://github.com/ABTSoftware/SciChartWPF

This is a private repository and we will need to grant you access (available for SciChart Source Code customers only). Contact us with your SciChart Order ID and Github username and we can grant you access. Soon, we will be adding a feature to the website to link access automatically.

SciChart_Github

SciChartWPF is now on Github, a private repository which can be accessed by source-code customers

So How does this work?

The SciChart WPF Github repository is a private repository, which we can grant you access to during your subscription (before support-expiry).

If you’ve never used Github before, it’s basically just version control in the cloud, and you can pull, or ‘get-latest’ our source code with either git or SVN clients, browse changes, view diffs per commit. You can even download a zip.

The repository is read-only, but you can fork our repository (create a branch) and make your own modifications. Then, when we release an update to SciChart, you can choose to merge our changes into yours. If you want, you can even suggest changes to use (but exactly *how* this will work is to be decided).

See Branches, Download a Zip or Get-Latest in Git or SVN clients

See Branches, Download a Zip or Get-Latest in Git or SVN clients

View a Visual Diff for a commit. What changed and why?

View a Visual Diff for a commit. What changed and why?

Viewing the Commit Log in Tortoise SVN

Viewing the Commit Log in Tortoise SVN

SC_Github_SourceTree

Viewing the Commit Log in Sourcetree (git client)

How often do we update/Release?

The SciChart WPF Github repository is linked directly to our build server and nightly build job. We run the nightly build when there are changes in our release branches. This pushes the latest stable version of SciChart to our NuGet feed (compiled DLLs) and github (for source code customers).

Continuous Delivery is provided by TeamCity. We push nightly builds to NuGet and Github when there are significant changes

Continuous Delivery is provided by TeamCity. We push nightly builds to NuGet and Github when there are significant changes

What’s Included in the Repository

We’re including the stable release branches of SciChart, and the projects Abt.Controls.SciChart.Wpf.csproj, Abt.Controls.SciChart.csproj and SciChart.Tests.csproj. There is a Visual Studio solution at the root of the repository that you can open to build SciChart.

What's in the SciChart Source Repository

What’s in the SciChart Source Repository

We do not include security sensitive code (such as licensing) and we do not include the examples in the repository just yet. We are brainstorming ways we can include the examples as well as building examples + DLL at the same time would be a nice addition.

Limitations and Terms

  • The SciChart WPF Repository is read-only. If you want to make a commit or fix a bug, you’ll need to give us a diff or patch file to apply.
  • Only SciChart Source-code customers before support-expiry date can access the SciChart WPF Github Repository. When your subscription expires unfortunately we have to remove your access. You can still get a zip of the latest version you are entitled to even after support expiry.
  • You can create branches (forks) off SciChart WPF, but, if your support expires and we remove your access, your forks will be deleted permanently. This is a Github limitation and not one we can work around. We will warn you to take a copy of your code and possibly (we’re working on it) automatically take a backup of any forks before revoking access. We don’t want anyone to lose any code.
  • Obviously, the SciChart WPF Repository should be viewed and used only by SciChart source-code customers. We ask you kindly to keep the repository shared or used by only SciChart Source-code customers. Any breaches of our terms we will obviously warn you first, but we may have to revoke access to the repo.

How can I get access?

For now, just email us with your SciChart Source-code OrderID and your Github username and we will grant you access! In the near future we are planning an enhancement to the website to automatically link your Github account with ours. That’s about a month away so please be patient and we will let you know as soon as we are ready!
So we hope this is a powerful new feature for you to get stuff done with SciChart! If you have any feedback, comments or suggestions please let us know.

Best regards,
[SciChart Team]

The post Github Repository for SciChart Source-Code Customers appeared first on SciChart.

A letter from the CEO: SciChart Needs You!

$
0
0

We’re planning some pretty huge changes to SciChart in the next couple of months and I need to personally call on you, our customers, to help us.

abt_jbt_edged128

I’ve known for some time that there is literally a huge wealth of knowledge, time, investment, workarounds and pure genius in the applications that you have built with SciChart. Much of it we simply don’t know about! Also, our customers and new sales prospects don’t know about it either.

I’ve personally seen some of your work and some of it is stunning. I don’t share work unless I have permission as I respect your confidence. However, it’s time to call on you and hopefully call on some of that good-will we’ve built up in our user-base to get some feedback about what you’ve done with SciChart. By helping us out, you can help us to make SciChart become the best graphics & visualisation component in the world.

We need you! We need your feedback to make the SciChart experience better for everyone. If you could take some time to help us it would be greatly appreciated

– Andrew / CEO of ABT Software and SciChart Tech Lead (and son)

So if you have time to help us out, here are the sorts of things we’re looking for. There are some incentives below so don’t close the browser just yet!

Testimonials

We already have a bank of testimonials but many of them are a year or two old. If you love what we do, please give us a sound byte that we can quote on our website.

Extra credit! If you can give us a picture too (e.g. from your linked in profile or twitter profile) it helps build user trust. We want to have testimonials looking like this. We can (optionally) link to your Linked-In, Twitter account or company page.

We would like our testimonials to be short, snappy and with a picture + company name if possible!

We would like our testimonials to be short, snappy and with a picture + company name if possible!

Screenshots for our Showcase Gallery / Case Studies

Guess what, in three and a half years of building SciChart we only have one published customer case study which is a real shame, as I have personally seen such amazing examples from some of you.

BlueShift-One_1

If you can give us a screenshot of your application, with or without what it is and who you are, we would greatly appreciate it. Make sure you get permission to share it. 

If you want to do a full-blown case study to showcase what you’ve built with SciChart and get it published on our site, then please contact-us.

Logos

We literally have 100 blue-chip or easily recognisable companies using SciChart and over 2,000 licenses sold worldwide, and goodness knows how many end-users, but we can’t put  logos on our homepage without permission (what a drag!).

SC-Logos

Please please please, if you can, give us permission to use your company logo. If you’re {Big Bank / Big Pharma / Big Scientific} *cough* then you are going to be more valuable to us than smaller companies but anyone is welcome here.

Logos help to build trust and new customers that see hundreds of logos on the SciChart homepage are going to spend less time considering whether SciChart is the right choice for them. That means we have more revenue to invest and more to support you guys! Our success, is your success.

Your workarounds / genius hacks

You know we saw one {big Process Management company} take SciChart Annotations and create a scheduling control out of it?

We saw a {big Gaming company} take our DirectX-accelerated RenderSurface API and use it in creating tools for real-time node-based graphs and diagrams?

We’ve even see a {big Oil & Gas company} take our charts and produce something unrecognisably complex using multiple vertical charts and then print it out of a plotter.

The sorts of things you achieve with SciChart are way beyond what we can achieve with our limited examples and show-case just how powerful and flexible the toolkit is.

Incentives!

We realise that many of you are busy (well, you should be…) and many of you will need to seek permission from managers, even higher levels of corporate to get permission to share any information. We also realise this is going to take you time. So how about some incentives?

  • Are you up for renewal soon? How about a discount off renewal? Or, an extension to your support-expiry date for free?
  • Are you a SciChart WPF Pro customer? How about a discounted upgrade to Source-code?
  • Do you need to add new licenses to your team? How about a discount off those?
  • Or, you could just do it for the love :)

Call us to negotiate what it will cost you in terms of your time to prepare this information and we can negotiate a discount or store credit to compensate you. Be fair, and so will we!

Guys, finally, our success is your success. It is my dream to transform SciChart way beyond just a chart control, and as you continue to invest in us, so we will continue to invest in you.

Have a good day and thanks for your time! Please contact me if you want to help. My email is andrew [at] abtsoftware [dot] co [dot] uk.

Best regards,
Andrew


The post A letter from the CEO: SciChart Needs You! appeared first on SciChart.

SciChart My Account Page for Licenses, Renewals, Source-Code Access

$
0
0

We are pleased to announce an upgrade to the SciChart site – an inclusion of a rich My Account page for managing your licenses, serial keys and source-code access.

To try out the My Account page, please head over to www.scichart.com/profile, or click on ‘My Account’ at the top of the page after login.

How to find the My Account page on SciChart.com

How to find the My Account page on SciChart.com

So what can the My Account Page do?

Quite a lot! You can basically:

  • View your current and past SciChart orders, showing Order ID, Purchaser/Customer, Invoice, Serial Keys, Support Expiry Date and Activated Developers.
  • Renew or Upgrade your SciChart Licenses with custom discounts and links straight to our store.
  • Link your SciChart Account to Github and get access to our Github repository for SciChart Source-Code Customers.
  • Update aspects of your profile such as Name, Email and change password.


My Account page: View orders, get access to source-code, upgrade and renew and more!

My Account page: View orders, get access to source-code, upgrade and renew and more!

Finding your SciChart Serial Keys

Your SciChart Serial keys are displayed on the My Account page under the ‘show serials’ tab. Serial keys are shown to purchasers / owners of the license, and also activated developers. If you cannot see any serial keys it is because you either have not purchased SciChart, or, you are not the purchaser/primary customer on record. Please contact your purchaser if you believe you have purchased a license to get the serial keys for the first time.

View your Serial Keys and Renewal / Upgrade Offers on the My Account page

View your Serial Keys and Renewal / Upgrade Offers on the My Account page

Renewing and Upgrading

The My Account page also contains custom offers to renew and upgrade SciChart licenses. Just click on one of the links under the Renewal Offers section to see what offers are available to you at this time.

All renewals are automatic, meaning, once payment is received, the licenses will be renewed and emailed out to you straight away. All renewals obey our Renewals Policy outlined here.

Linking to our Source-Code Repository

If you are a source-code customer, you can get access to our Github repository as outlined in in www.scichart.com/github-repository-for-scichart-source-code-customers.

To get access, you will need to tell us your Github username, then activate your SciChart Source-code license (if you haven’t already). If the source-code license is not support-expired, you will receive an invite via email to access our Github repository. You will then be able to checkout the source-code, plus get on-going updates as we work on the chart library.

Manage your Profile / Name / Email

Finally, you can also manage your profile, name and email and update your password on the SciChart My Account page.


We hope you find these additions useful and as always, we welcome your feedback!

Best regards,
[SciChart Team]

The post SciChart My Account Page for Licenses, Renewals, Source-Code Access appeared first on SciChart.

SciChart v4 SDK / SciChart 3D WPF Chart Coming Soon

$
0
0

Very shortly we will be releasing a major update to SciChart’s Legendary WPF Charts: SciChart WPF v4 and SciChart WPF 3D Chart.

All customers with active support subscriptions will be upgraded to SciChart v4 for free. SciChart 3D will be a separate product and will be discounted to existing customers of SciChart 2D.

If you are a SciChart Source-code customer, you will start to see us pushing to a pre-release branch in the Github repository. This code is highly in flux and we don’t recommend upgrading just yet, but if you want to have a poke around, feel free!

SciChart WPF v4 Coming Soon

Our best-in-class WPF Charts just got better! SciChart v4 will have a revamped API and many new features:

  • True MVVM API for all aspects of the SciChart Charting library
  • Pointmetadata API to tag data-points with any business object
  • Point-selection API
  • Composite Annotations API and many complex annotations such as Fibonacci Retracement, Measurement annotations.
  • Zoom history (undo / redo zoom)
  • High quality XPS / Vector Export feature for 2D Charts
  • Improved styling for Tooltips, Chart Elements, Scrollbars
  • Allow keyboard input in ChartModifiers
  • New SciChartv4Dark Theme
  • Yet more performance enhancements. SciChart v4 WPF with DirectX will be the fastest in the world!
  • New examples app with improved search, export example to Visual Studio.
2DCharts_StackedMountain

New Tooltip Styling and Examples Styling

2DCharts_Histogram

Histogram Feature with Text on Columns

2DCharts_CompositeAnnotations

New Composite Annotations API

SciChart 3D Coming Soon

At the same time we will be releasing SciChart 3D: DirectX Powered WPF 3D Charts.

SciChart 3D will be a separate product to SciChart 2D, and will be licensed separately, or as a bundle with our legendary best-in-class 2D WPF Charts. SciChart’s WPF 3D Chart will feature:

  • Hardware Accelerated, DirectX powered 3D WPF Charts
  • 3D Chart Types including Uniform Surface Mesh, Bubble, Scatter, Point-Cloud, Column, Impulse (Stem) and Point Line 3D Chart Types.
  • Built for real-time and big-data with surfaces up to 16k x 16k, Point-Clouds up to 1M points.
  • Interactive, Templatable Tooltips.
  • Point Selection and Metadata.
  • Intuitive XAML / MVVM Friendly API following our existing patterns and practices for SciChart 2D.
  • Based on a rich 3D Engine to allow us to build rich 3D visualisation features in the future.
3DCharts_Mesh2

Realtime WPF 3D Surface Mesh Charts

3DCharts_Bubble

Realtime WPF 3D Bubble Charts

3DCharts_Theme

Themes and Styling just like SciChart 2D

Documentation / Tools Coming Soon

What else? We will have the following documentation and tools coming very soon:

  • 300+ page documentation with online counterpart. Every feature and aspect of the SciChart v4 API will be documented.
  • Updater tool to assist migrating a Project or Solution from SciChart v3.x to SciChart v4.x.
  • New examples app with improved search, export example to Visual Studio features.
Examples_Home

New Examples App Home

Examples_Search

Rich Full-source Description and Title Search

SciChartUpdaterTool

SciChart Updater Tool for v3 – v4 Migration

Pricing and Licensing

Tldr: Pricing and licensing of SciChart 2D Will not change. SciChart 3D will be a new product.

If you are a SciChart WPF Basic, SciChart WPF Professional or SciChart Source-Code customer and your support has not expired on release, then you will be able to get the new version free of charge. Hurray! 

Pricing of SciChart 2D/3D will then be as follows:

  • SciChart 2D WPF Professional: $899  (No change)
  • SciChart 2D Source Code: $1499 (No Change)
  • SciChart 3D Professional: $999 $399 When purchased with early-bird discount
  • SciChart 2D+3D Professional: $1749 $1298 When purchased with early-bird discount
  • SciChart 2D+3D Source Code: $2549 $1898 When purchased with early-bird discount

*Early-bird discount will be available to existing customers of SciChart to upgrade to a 3D product.

How Long?!!

Soon! Soon! Believe me, no-one is more incentivised to release than us :)

We intend to get a BETA out possibly within a month and to release soon after. Register your interest for BETA by contacting support!

Remember, if you are a customer to SciChart WPF you will automatically be upgraded to SciChart v4 so long as you have an active support subscription. If you are an existing customer you will get access to early bird discounts for SciChart 3D also.


Best regards,
[SciChart Team]

The post SciChart v4 SDK / SciChart 3D WPF Chart Coming Soon appeared first on SciChart.

WPF 3D Chart Coming Soon

$
0
0

You may have noticed that SciChart 3D WPF Charts are coming soon! Along with version 4 of our legendary best-in-class WPF Charts. We wanted to post a few more screenshots and features info about this powerful new WPF 3D Chart control, which is coming very soon.

SciChart WPF 3D Charts Screenshots

WPF 3D Bubble Charts

3D WPF Bubble Charts

WPF 3D Surface Mesh Charts

3D WPF Surface Mesh Chart

Realtime WPF 3D Chart

Realtime WPF 3D Surface Mesh Chart

Themed WPF 3D Charts

Themed 3D WPF Charts

WPF 3D PointLine Chart

WPF 3D PointLine Chart

WPF Tenor Curves 3D and 2D Charts

WPF Tenor Curves 3D and 2D Charts

3D WPF Column Chart

3D WPF Column Chart

3D WPF Stem Chart

3D WPF Stem Chart

Mesmerising Realtime 3D WPF Chart

That Mesmerising Realtime 3D WPF Chart

SciChart WPF 3D Chart Features

Features are still in flux, but the first release is likely to include:

  • WPF Scatter 3D chart with variable point-color, marker geometry
  • WPF Bubble 3D chart with variable point-color, marker geometry, size
  • WPF Point-Line 3D chart with variable point-color, marker geometry, line width
  • WPF Surface Mesh with uniform grid with color palette, heightmap or texture
  • WPF Impulse (stem) 3D Chart with variable point/line color, market geometry
  • WPF 3D Column Chart with variable column color
  • Templatable, customizable Tooltips per vertex / segment
  • Vertex Selection & Hit-Test API
  • Customisable camera with perspective / orthogonal views
  • Zooming, Panning and orbiting the world via mouse, mousewheel interaction
  • Realtime performance & DirectX hardware acceleration as standard
  • Based on a rich 3D Engine to allow us to build rich 3D visualisation features in the future.

SciChart 3D Pricing & Licensing

Pricing & Licensing is to be announced soon, but we will be providing an early bird discount for new purchases of SciChart 3D WPF Charts and a slightly steeper early-bird discount for existing customers of SciChart WPF 2D.

So keep watching our releases page as the early-bird discount won’t last long!


Best regards,
[SciChart Team]


The post WPF 3D Chart Coming Soon appeared first on SciChart.

Viewing all 302 articles
Browse latest View live