We’ve moved over to a new format for communicating our releases and updates of our high performance JavaScript Charts library, by publishing a rolling changelog of every fix or enhancement in SciChart. You can find the changelogs in the top menu at Developers -> Changelogs -> SciChart JS ChangeLog
What’s New in v3.3 of SciChart’s JS Charts?
Today we have released v3.3.560 of SciChart.js. This is a cumulative update which contains very important fixes and features since our last announced release, version 3.2.
Version 3.3 contains important fixes including one fix to licensing which can affect production apps. It is backward compatible to v3.x, and it is highly recommended for all users to update. More details below.
Changes since version 3.2
Critical Fixes
IMPORTANT! Licensing issue in version range 3.2.446 to 3.2.555 By far the most important issue we’ve fixed is a licensing issue in SciChart.js, which affected version range 3.2.446 to 3.2.555. These versions have been marked as deprecated in npm.
This issue is expressed as a license expired error where you can see the error message “Sorry! This version of SciChart is too old to be used for the community edition. Please update to the latest version” even if a license key has been applied.
The resolution to this is as follows:
Update your application to using SciChart.js v3.3 or greater
If you are unable to update SciChart.js to v3.3 there is a workaround in code which can also be applied. Contact tech support if you require more information.
New Features
A number of new features & enhancements to the API have been included since version 3.2, these include:
1. VerticalSliceModifier Feature
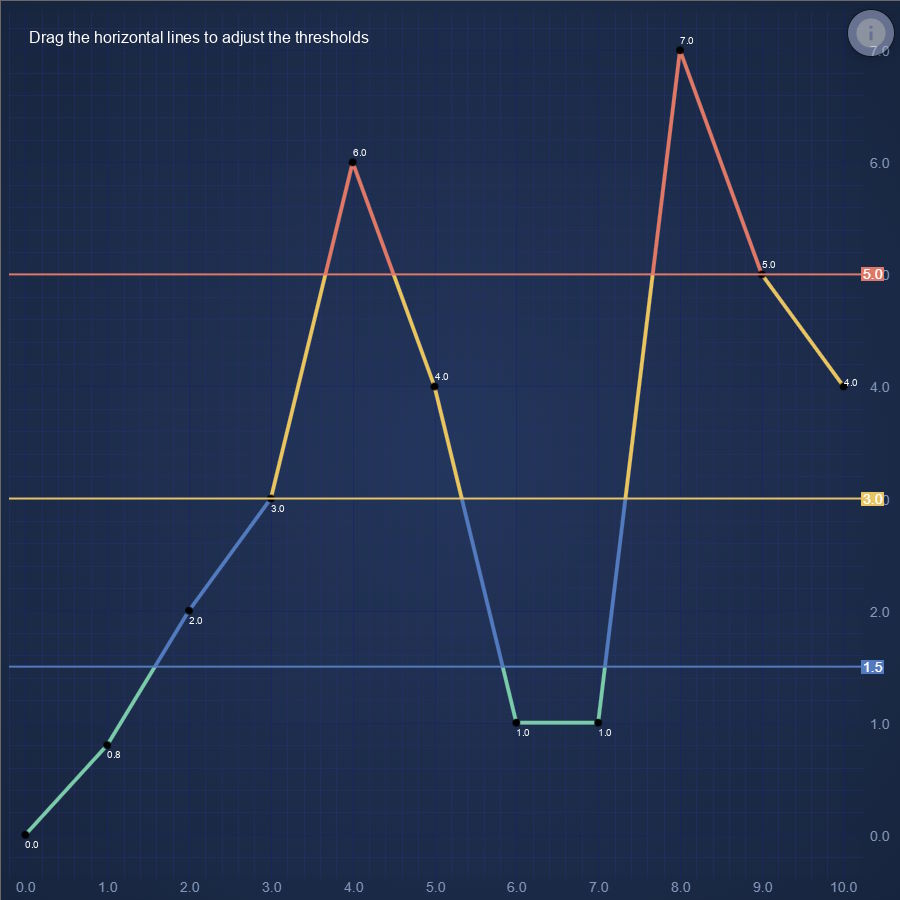
We’ve added a new modifier type, the VerticalSliceModifier plus an example showing how to use it. The VerticalSliceModifier example demonstrates our newest modifier, which allows you to place vertical lines on the chart with tooltips. Lines are draggable, selectable and can be added/removed. More than one line may be added to the chart.

2. IAdvancedPaletteProvider Feature
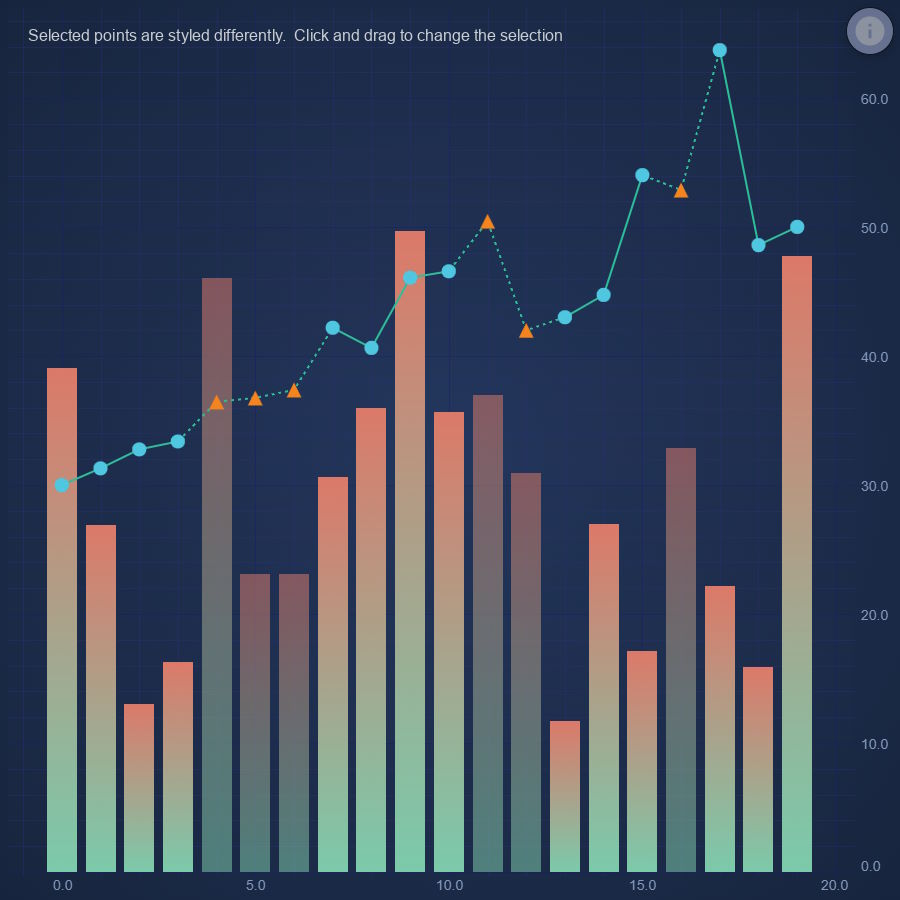
We made multiple improvements to the PaletteProvider API to allow better performance. The PaletteProvider is the API which allows per-point colouring on data-points (bars, line segments, scatter points, bubbles) in SciChart.js. Currently this is a function which is run once per render allowing you to modify the data-point colour dynamically. IAdvancedPaletteProvider interface allows you to create a PaletteProvider with optionally cached outputs for all data-points. Rather than calling a function point-by-point to evaluate data-point color, the IAdvancedPaletteProvider allows you to return an array of colors for data-points. This is significantly faster for cases which require frequent color changes on the chart or graph. Official documentation for the IAdvancedPaletteProvider will be added shortly. Typedoc API docs can be found here.
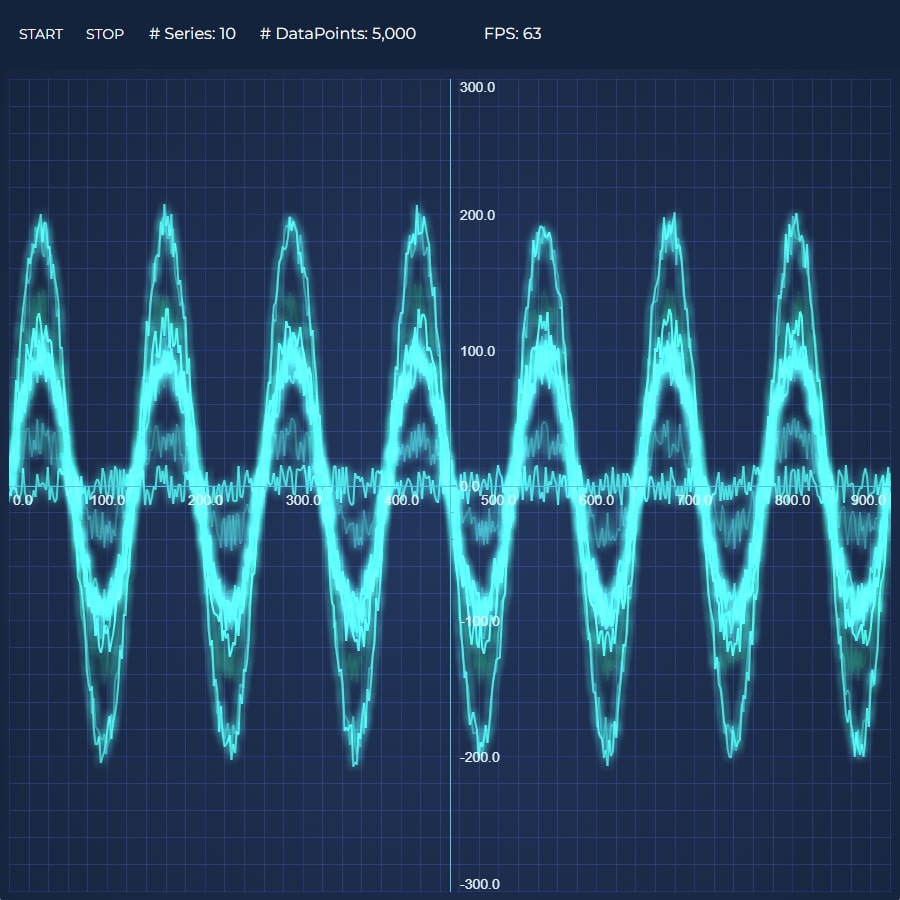
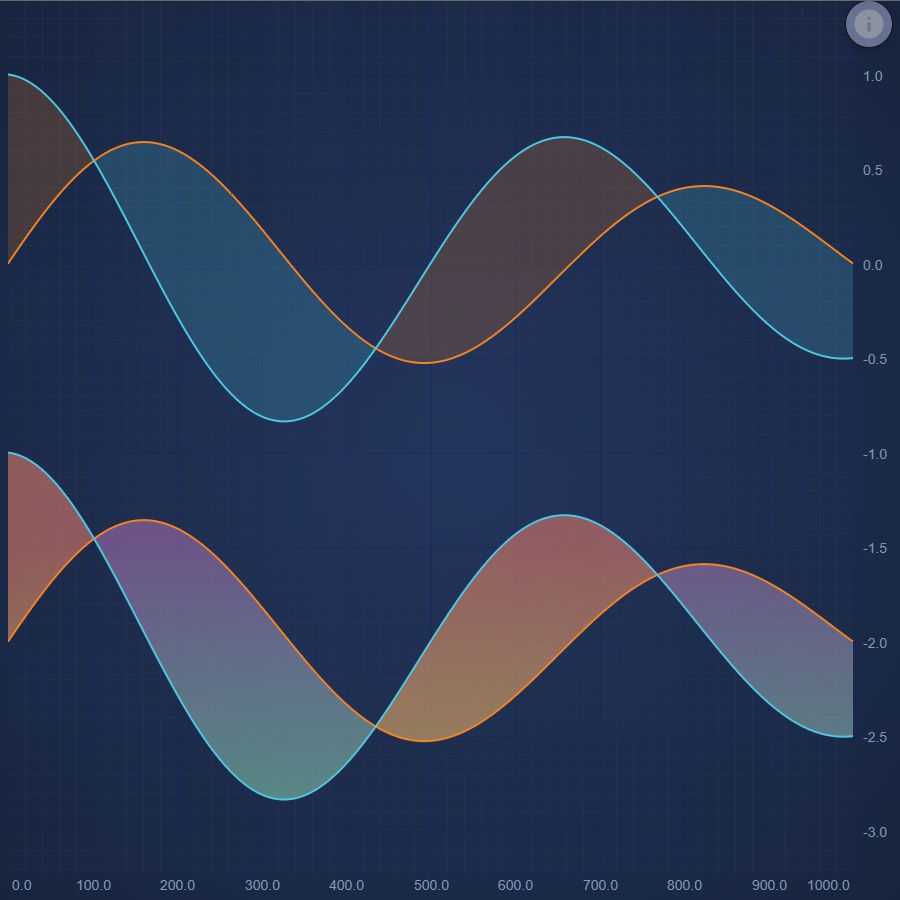
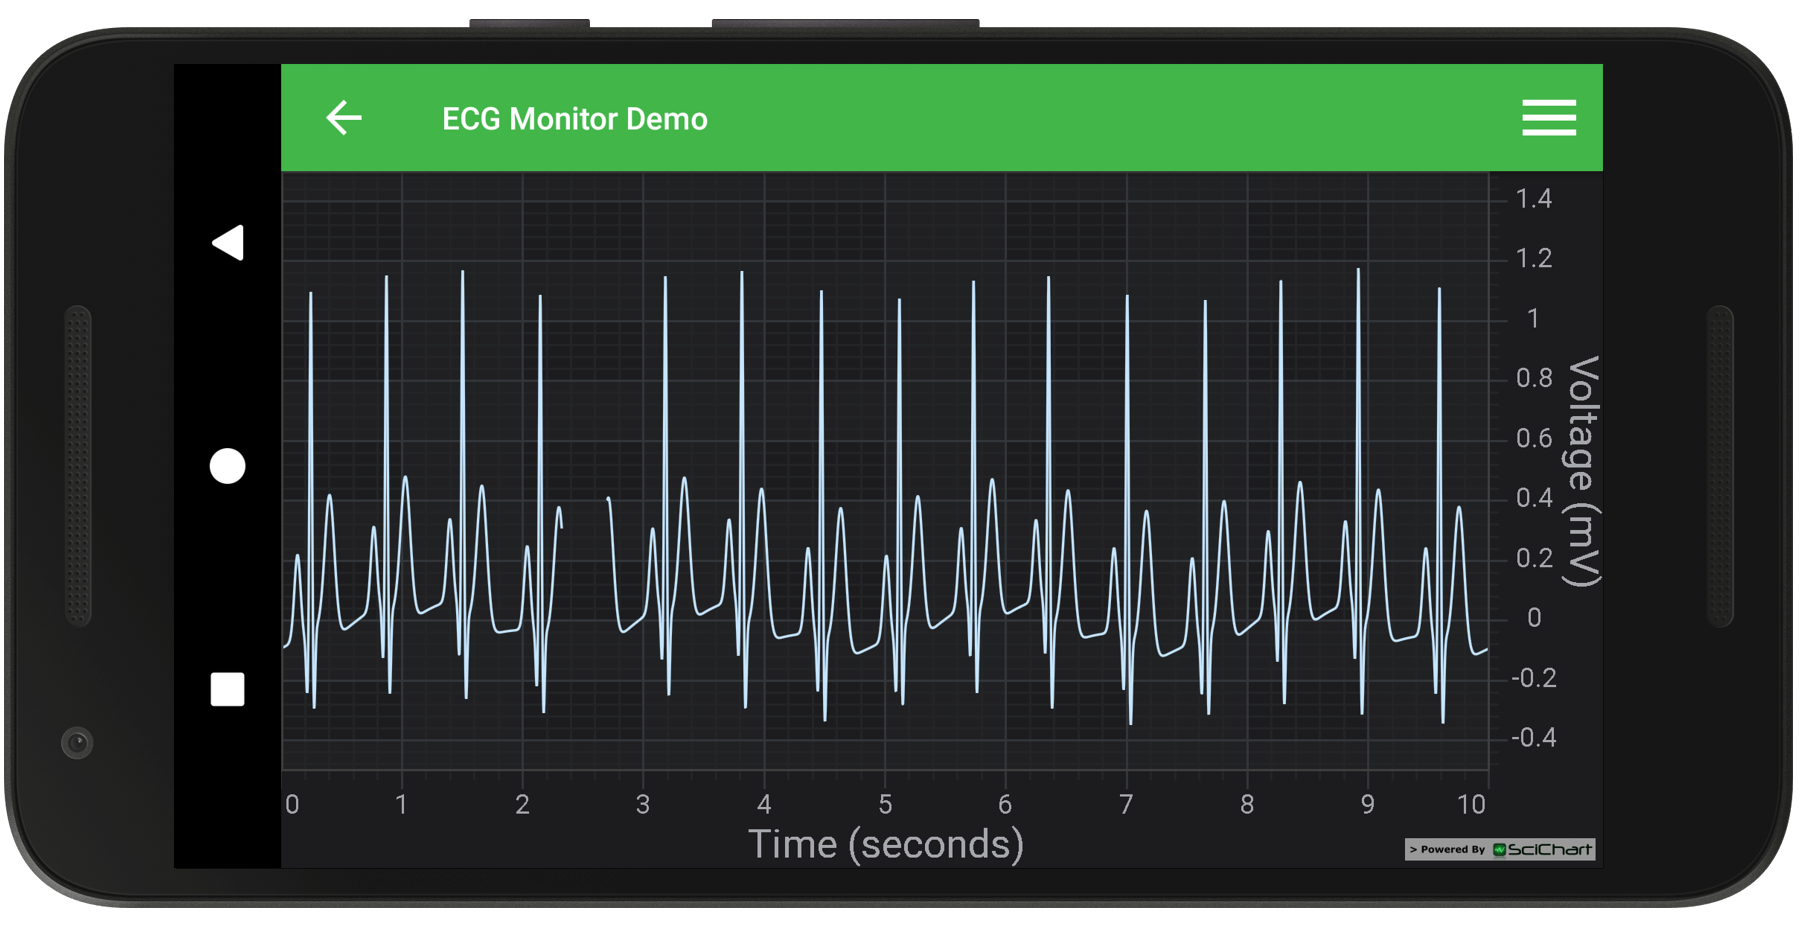
3. Axis.isStaticAxis Feature
We’ve added a property to AxisBase.isStaticAxis. When set to true:
- Gridlines and labels always appear at fixed positions on the chart
- For example, if you have
AxisBase.isStaticAxis = truethen ten labels / major gridlines will be placed on the chart, always at the same position - When in this mode,
Axis.MaxAutoTicksdefines the number of labels. E.g. when set to 10, you will get 10 labels / major gridlines equally spaced over the chart - If you update the
Axis.visibleRangeprogrammatically, or by zooming, the labels / gridlines will stay in the same place, however, label values will update - This type of chart can be used to create oscilloscope or reporting charts where fixed labels at specific locations are important.
Official documentation for the Static Axis feature will be added shortly. Typedoc API docs can be found here.
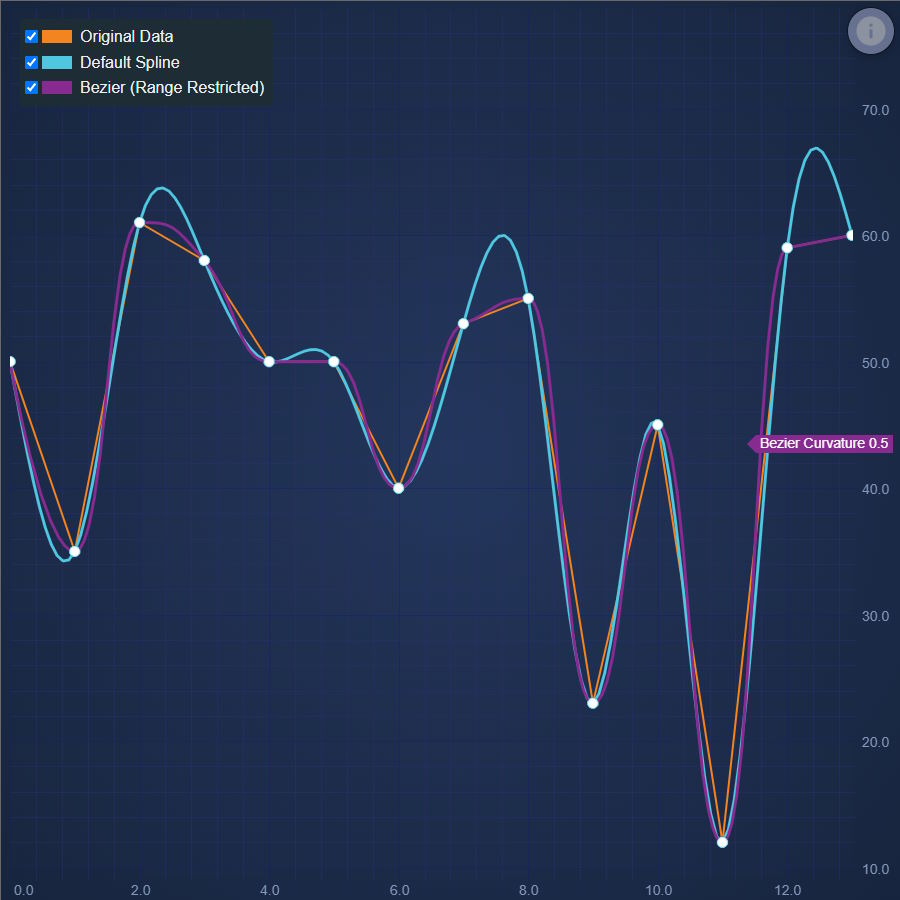
4. RenderDataTransforms Feature
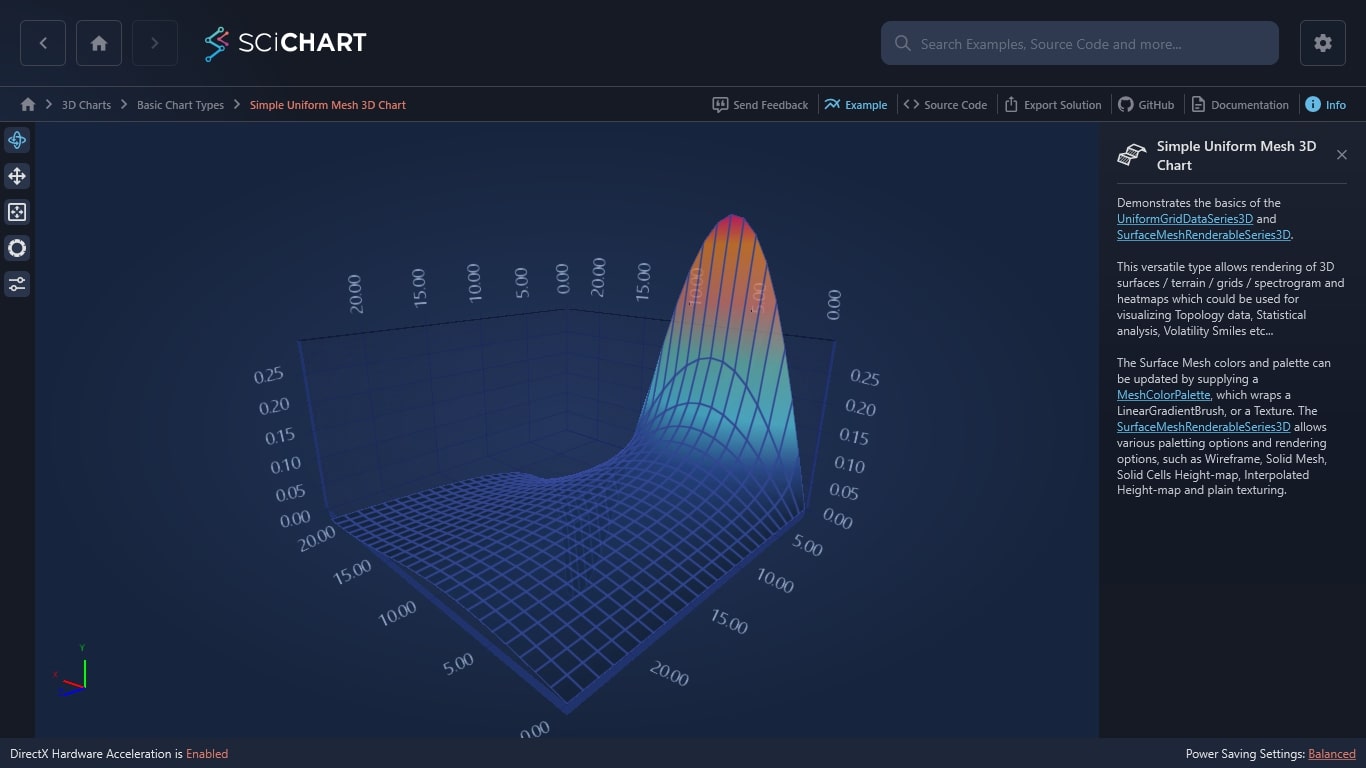
RenderDataTransforms is a new low level api that allows you to transform your data just before it is drawn. SciChart currently uses it this internally to do spline interpolation, but it has the potential to support all kinds of cool features, like changing the color of a line between data points (by adding extra geometry), and applying multiple different line styles and pointMarkers to a single series. Official documentation for RenderDataTransforms plus demos will be added shortly. Typedoc API docs can be found here.
5. New Demos
In addition, a number of new demos have been created since the v3.2 release of SciChart.js. These include:
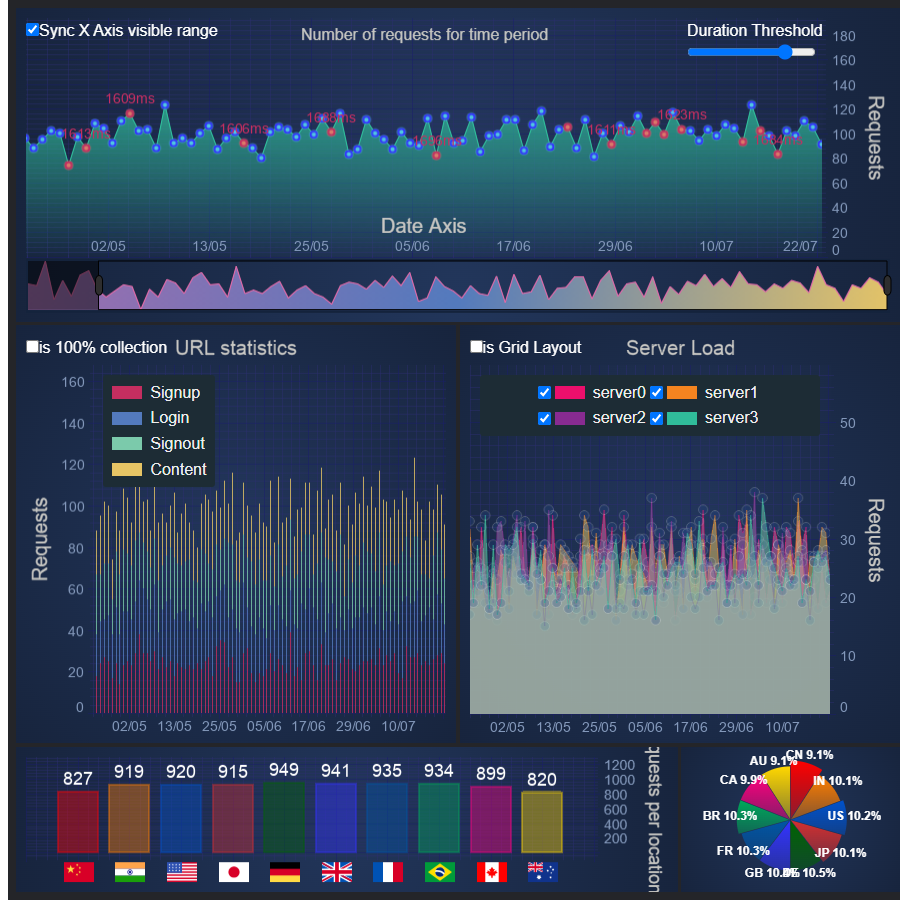
Shows how to create a rich interactive 'Grafana style' server traffic dashboard in React JS using SciChart. Several charts are linked together with synchronized zooming and panning. The demo features drilldowns, hover styling events, hoverable tooltips and more … Continue reading React / JavaScript Server Traffic Monitoring Dashboard demo
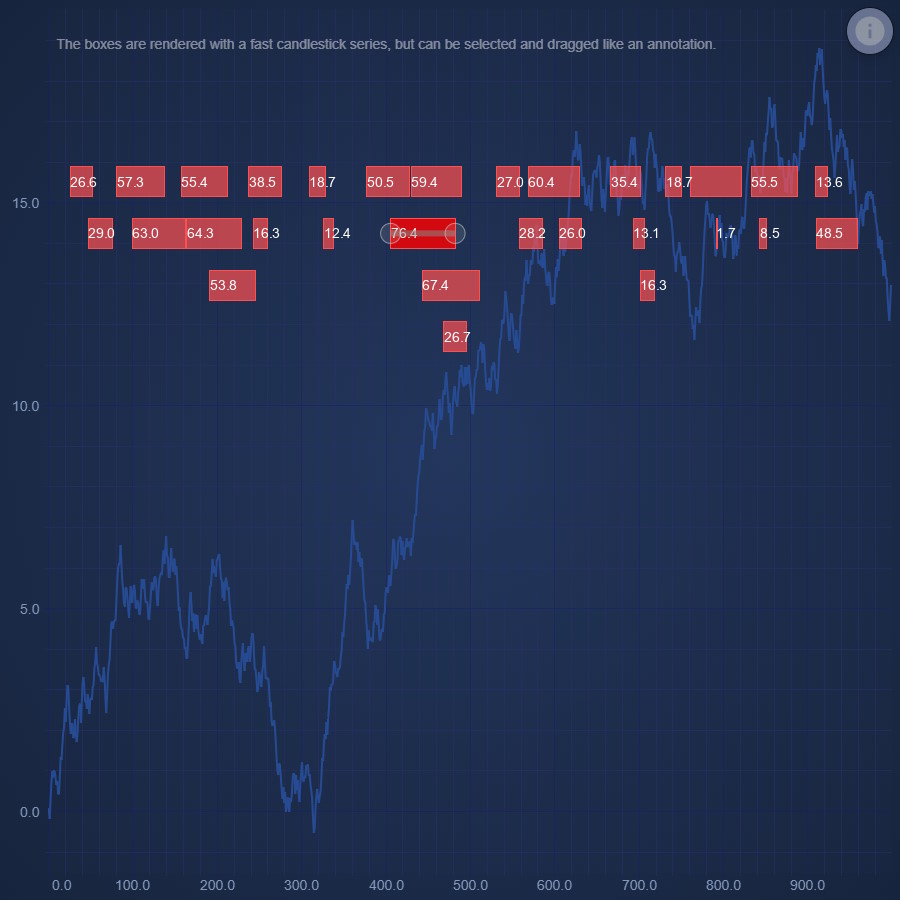
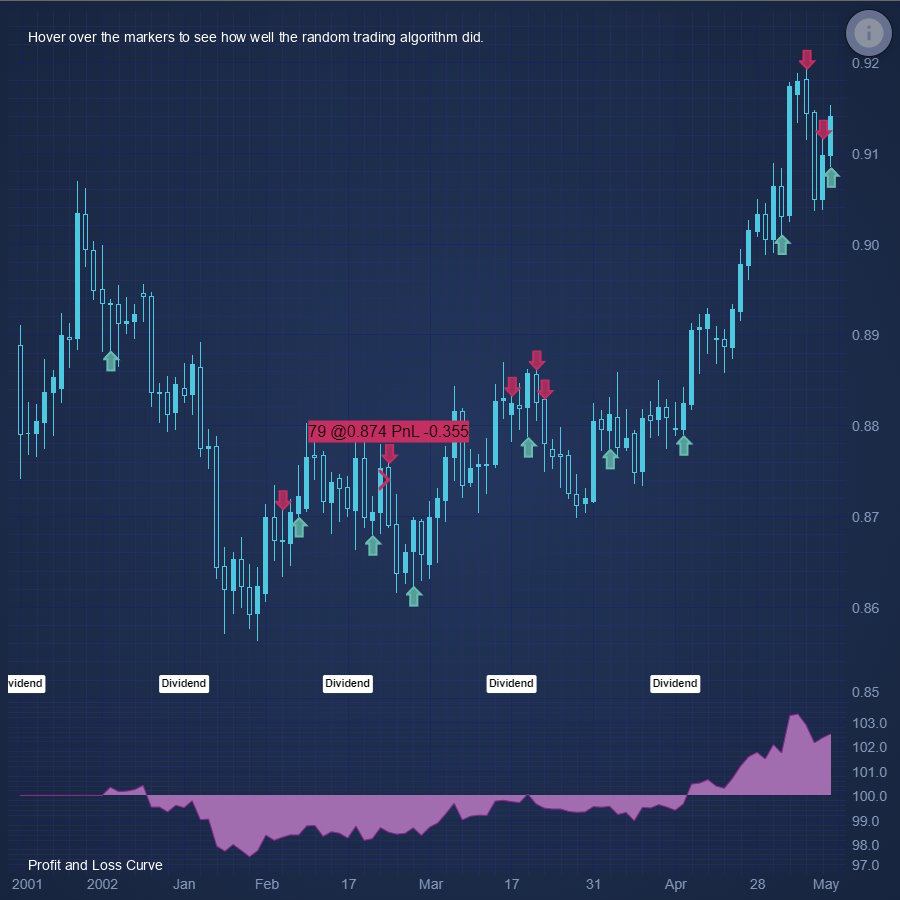
Range bars can be added to a JavaScript chart with optional labels. In this demo, we show how to use a combination of custom rendering and the chart modifier API to enable click selection and dragging of these range bars … Continue reading Draggable Range Bar Event Markers with Labels in JavaScript
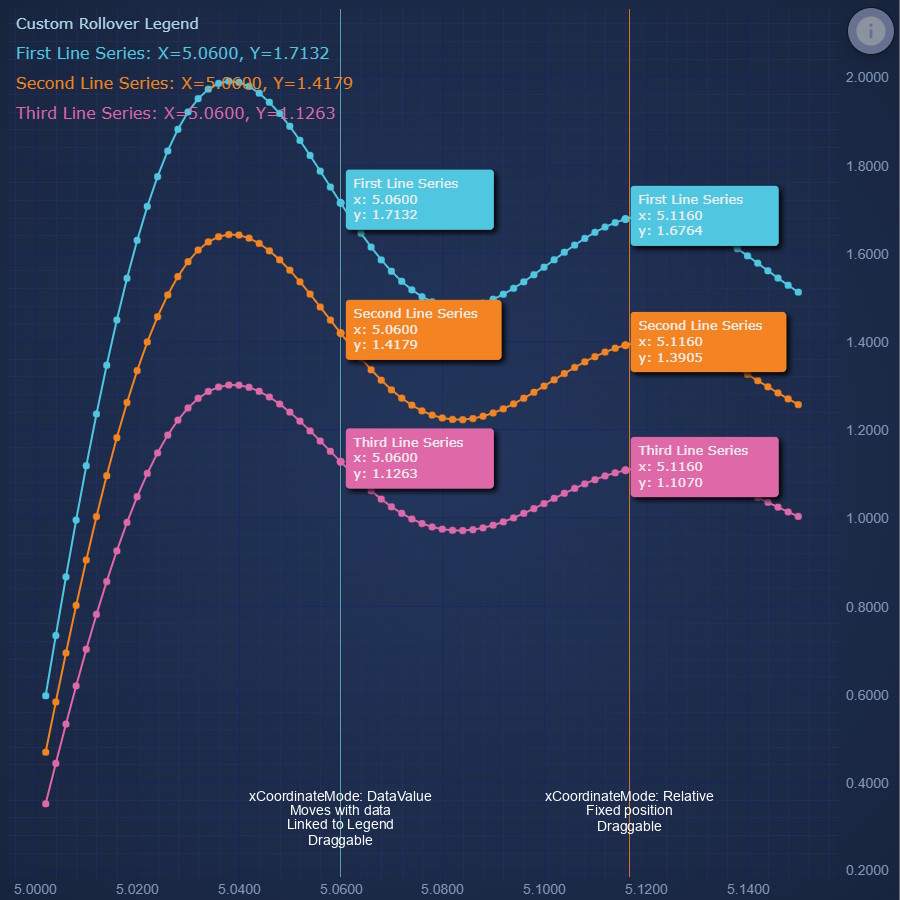
Learn how to use the VerticalSliceModifier, a new feature in SciChart.js which allows you to place one or more vertical lines on the chart, which slice the time-series and display a tooltip. Lines can be added, removed, selected or dragged. Multiple lines can be added to a single chart. … Continue reading VerticalSliceModifier Multiple Tooltip Line Example
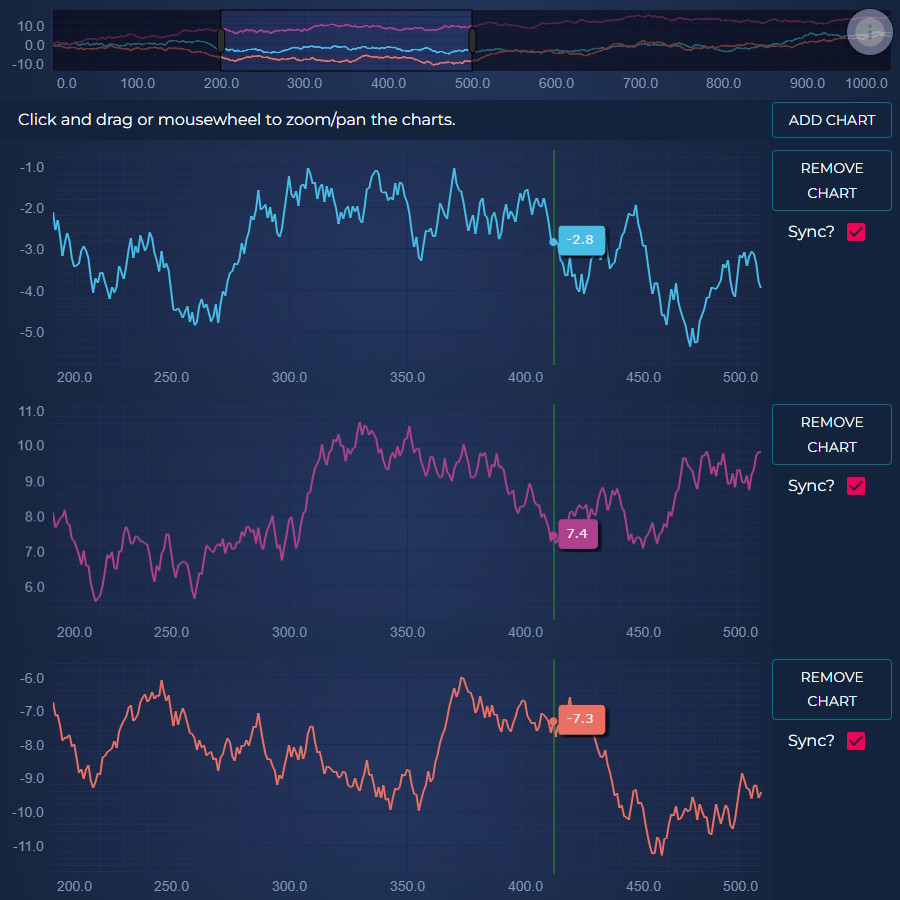
Using SciChart.js APIs shows how to dynamically add and remove charts to a synchronized group. All charts zoom, pan together. Tooltips synchronize across charts. Chart panes may be removed from the sync individually. This allows for highly dynamic charts with multiple panes … Continue reading Synchronize Multiple Charts in React & JavaScript
Bug Fixes
Since version 3.2 was released in July 2028 there are also lots of bug fixes which have been deployed to SciChart.js. These have been rolled into v3.3. You can see a full breakdown of bug fixes and their dates/version in the ChangeLog.
- (3.3.560, 29th Jan 2024)
- This release fixes an critical licensing issue affecting any application deployed with a 3.2 version of SciChart. All users need to update.
- (3.2.555, 18th Jan 2024)
- Small release mainly to fix a bug with rollover/hittest when using FIFO sweeping mode.
- We are starting a process of trying to reduce the webassembly data file size. Minor changes initially, but expect significant improvements in v4 coming soon.
- Removed some unnecessary assets from data file
- SCJS 1596 expose
dataSeries.FindIndexand fix some minor bugs there. - SCJS 1701 – HitTest is wrong for fifo sweeping
- 3.2.549 (8th Jan 2024)
- Modifiers with multiple subcharts are now slightly easier thanks to
isActiveSubChartEventadded toModifierMouseArgs. This is useful for Sub Charts with a modifier group. DefaultPaletteProviderstill hadshouldUpdatePalettefalse. Default false until v4- Js/scjs 1628 Fixed candlestick charts crashing on safari iOS 17
- Auto cleanup subscriptions in
DataPointSelectionModifier SCRTDoubleVectordoes not push_pack correctly for capacity 1
- Modifiers with multiple subcharts are now slightly easier thanks to
- 3.2.543 (21 December 2023)
- A final release for the year to fix a performance edge case and also to make the default behaviour of PaletteProvider consistent with what it was before the change in 5.3.8, which is to recalculate the palette on every render. To get the performance benefit of reuse on a static palette you need to add the
shouldUpdatePalettemethod to yourPaletteProviderand return false if the palette can be reused. We will be changing this default in version 4 to reuse if at all possible. - SCJS-1685 Improve performance when series is panned out of view.
- A final release for the year to fix a performance edge case and also to make the default behaviour of PaletteProvider consistent with what it was before the change in 5.3.8, which is to recalculate the palette on every render. To get the performance benefit of reuse on a static palette you need to add the
- 3.2.538 (24th November 2023)
- As well as some more fixes, this release includes the new
RenderDataTransforms. This is a low level api that allows you to transform your data just before it is drawn. SciChart currently uses it to do spline interpolation, but it has the potential to support all kinds of cool features, like changing the color of a line between data points (by adding extra geometry), and applying multiple different line styles and pointMarkers to a single series. Expect more documentation, demos and features using this in 2024. - The PaletteProvider api has also been improved. Palettes can now be reused, with a property
isRangeIndependantand a functionshouldUpdatePaletteto control when palette recalculation should occur. You can now even take full control of the palette by implementingIAdvancedPaletteProvider, which gives you a single function call for all the data rather than a call per point. - Added
RenderDataTransformapi and used it for spline series - Allow palettes to be reused if nothing has changed
- Added
isRangeIndependantandshouldUpdatePalettetoIPaletteProviderto control palette reuse - New
IAdvancedPaletteProviderinterface. This is a single method called instead of the per-point overrides. Its parameters give you access to the full data and palette - SCJS-1768 Added
yRangeModeproperty to renderableSeries and set the default on this to revert to previous behaviour where the points just outside the visibleRange will be included in autoRange. This fixes issues where digital lines were escaping the axis when used on stacked axes. - SCJS-1683 Annotation
coordinateModeRelative now works correctly on a stacked axis - SCJS-1682 Fixed
hitTestcould be offset when usingCategoryAxis - Fixes for recently reported bugs and a new demo. Check out Draggable Event Markers
- SCJS-1669 Make rollover work for stacked charts with multiple axes
- SCJS-1670 Fix digital line being interpolated at the left edge of the chart
- SCJS-1673 Fix errors if a
RolloverModifieris removed and readded - SCJS-1764
VerticalSliceModifiershould not be able to be dragged off the chart - Add
showAxisLabelproperty for rollover and vertical slice - SCJS-1527 Fix setting
series.isVisibledoes not update legend visibility checkbox - Fix TypeScript Content Security Policy (CSP) style-arc error for RubberBandZoomModifier
- Remove a console.log
- As well as some more fixes, this release includes the new
- 3.2.525 (21 November 2023)
- Bugfixes, performance improvements and a few little features.
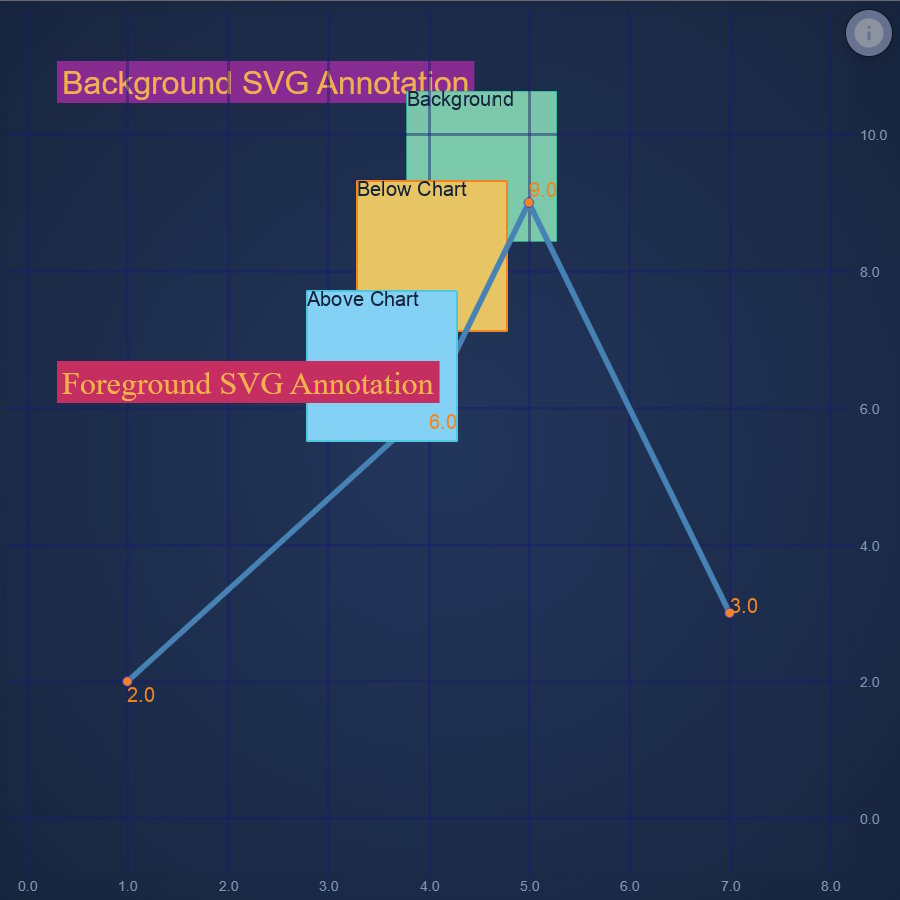
- SCJS-1661 background and padding for
TextAnnotation - SCJS-1655
shadowEffectColoron theme now applies to tooltips. To set individually use tooltipShadow forCursorModifierorrenderableSeries.rolloverModifierProps.shadowColorfor RolloverModifier AFTER the modifier has been added - SCJS-1660 Improve tooltip performance and positioning with many series
- SCJS-1278 Rename
useWasmFromCDNtoloadWasmFromCDNto avoid eslint errors - SCJS-1612 Fix Rollover tooltip positioning for vertical charts
- Subcharts do not receive mousemove events when cursor is off the chart
- 3.2.516 (13 November 2023)
- Some quick fixes for issues reported on our forums.
- SCJS-1656 fix External Legend positioning
- SCJS-1657 DataLabels do not show properly for resampled data in some cases
axisTitleStyleoption type should include rotation
- 3.2.509
- A couple of small axis features in this release. We’ve also been working on a big new demo showcasing multiple synchronised charts called the Server Traffic Dashboard
- SCJS-1637
cliptoYRangeon renderableSeries allowing clipping to vertically stacked axis range - SCJS-1629 Add
isStaticAxisproperty to axis which causes the labels and major gridlines to keep their initial positions when the visible range changes - SCJS-1634
SciChartVerticalGroupnow synchronises axis widths - removed some unnecessary memory warnings
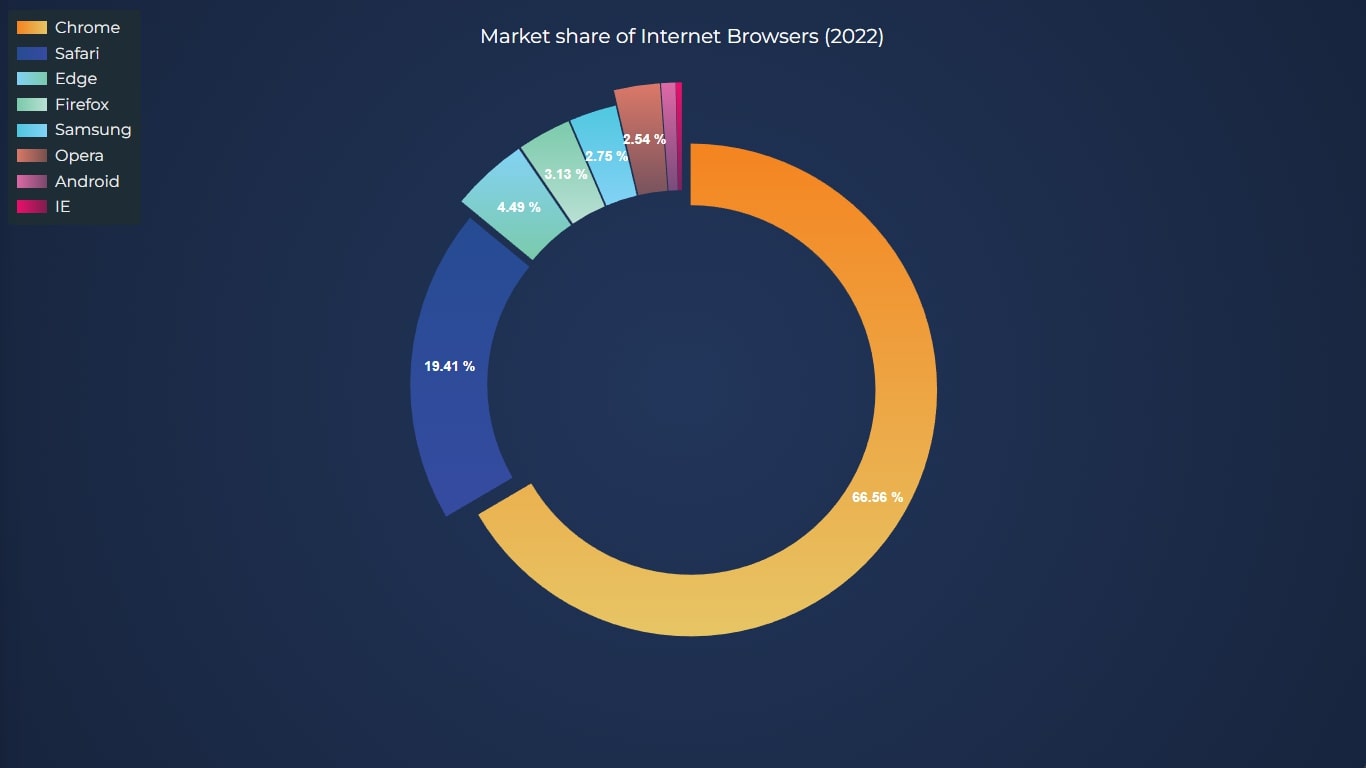
labelRadiusAdjustmentshould be a constructor option forSciChartPieSurfaceSCJS-1633 Fix log axis slows the chart badly when zoomed far in- Fix datalabels not displaying when pointGap is 0, ie for single point, or vertically aligned data
- 3.2.491 (18th October 2023)
- SciChart.JS now supports running in secure contexts using the “Content-Security-Policy” header set to “wasm-unsafe-eval”
- Content-Security-Policy header wasm-unsafe-eval now fully supported
- Clarified documentation on
Observable.asArray - Legend appeared offset when using vertically stacked subcharts
- Cursor tooltip not showing correctly for unsorted scatter data if hitTestRadius 0
- 3.2.481 (5th October 2023)
- See the demo of the new
VerticalSliceModifierat demo.scichart.com/javascript-chart-vertical-slice-modifier - New Feature –
VerticalSliceModifier. Looks like theRolloverModifier, but programatically placed at a particular data or pixel position - Handle cases where pie segments have 0 value
- See the demo of the new
- 3.2.477 (29th September 2023)
- fix OHLC data series serialization
- 3.2.476 (28th September 2023)
- SCJS-1603 Add remove method to Vertical Group and automatically remove surface from group when it is deleted
- SCJS-1602 Mark all series unhovered when cursor leaves the
seriesViewRect - SCJS-1601 Toggling
axis.isVisibleno longer breaks labels - SCJS-1548 Fix Data Series serialization. Improvements to NaN/null handling and metadata
- SCJS-1611 Fix rollover error if invisible series is made visible
- Fix
parseColorToHexStringArgbwith zero opacity override
- 3.2.470 (26th September 2023)
- This release (hopefully) marks the completion of changes required to enable SciChart.JS to be used with TypeScript strict mode enabled.
- SCJS-1604 Added
isEnabledfor DataLabelProviders - SCJS-1608 Fix datalabels not showing for single point
- SCJS-1609 Fix datalabels not generating properly with vertical chart
- SCJS-1605 Fix Rollover could not find registered tooltip template
- Fix Insert for XyText inserted text in the wrong place
- Fixed type mismatch in getters and setters allowing for strict mode
- 3.2.464 (7th September 2023)
- SCJS-1958 Fix palette not indexed correctly when zoom/pan a mountain or band series
- 3.2.463 (5th September 2023)
- Progress on strict mode support
- Fix types mismatch in getters and setters
- 3.2.461 (28th August 2023)
- Now that we have optional automatic webassembly disposal, deleting and creating a new chart could result in the creation of a new webassembly context. These fixes mean this will automatically get the license applied.
- Make extra sure that the license will be applied if a new
wasmcontextis being created - Fix license not reapplied if wasmcontext has been disposed
- 3.2.457 (17th August 2023)
- In 3.2 by default we clip the data that is sent to be drawn to what is actually visible. In some edge cases this might lead to undesired behaviour, so we’ve added
axis.clipToXRangewhich allows you to disable this. - SCJS-1579
clipToXRangeproperty to allow for disabling the new clipping to visibleRange for x axis - SCJS-1592 Partial fix for ring around pointmarkers with paletteProvider
- SCJS-1591 AutoRange should use acutally visible data
- Remove unnecessary logging
- In 3.2 by default we clip the data that is sent to be drawn to what is actually visible. In some edge cases this might lead to undesired behaviour, so we’ve added
Where to get it
SciChart.js v3.3 is available by:
Developers – Node/WebPack
Check npm for the latest version.
Don’t forget to see our Tutorials on setting up Npm projects with Webpack!
Developers – Browser Script
For developers using vanilla JavaScript (no Node Package Manager), you can load SciChart.js directly in browser. Add this script to your Html head and away you go.
// Add this script to head. For Prod we recommend setting a specific version number
// Include script from https://www.jsdelivr.com/package/npm/scichart
<script src="https://cdn.jsdelivr.net/npm/scichart@3/index.min.js" crossorigin="anonymous"></script>

// Import your types
const { SciChartSurface, NumericAxis, FastLineRenderableSeries } = SciChart;

// Now Configure SciChartSurface in code to load the wasm file from CDN
SciChartSurface.useWasmFromCDN();

// Now create a SciChartSurface as you would normally!
const { sciChartSurface, wasmContext } = await SciChartSurface.create("div-id");
The post SciChart.js v3.3 Released! Cumulative Update and Important Issue patched appeared first on SciChart.