Another quarter, another feature-packed release for SciChart.js – our High Performance Scientific & Financial JavaScript Chart library. In this release, version 3.2.446 we have a number of enhancements which are backward compatible drop-in replacement to users of SciChart.js v3. Find out what’s new below.
What’s New in SciChart.js v3.2?
Version 3.2 at a glance:
- Community Licensing!
- DataSeries FIFO (First in first out) mode
- DataSeries FIFO-sweeping mode
- DataSeries initialize with capacity
- Series PointMarker: lastPointOnly mode
- Significant WebAssembly memory improvements
- Memory leak debugging tools
- Optional delete on clear/remove from collections
- Allow configuring WebGL Buffer sizes in low-memory environments
- 2D/3D Touch Interaction improvements
- 3D Point-Line chart (PointLineRenderableSeries3D)
- 3D Tooltips (TooltipModifier3D)
- 3D Pinch Zoom
- Allow Annotations below Gridlines
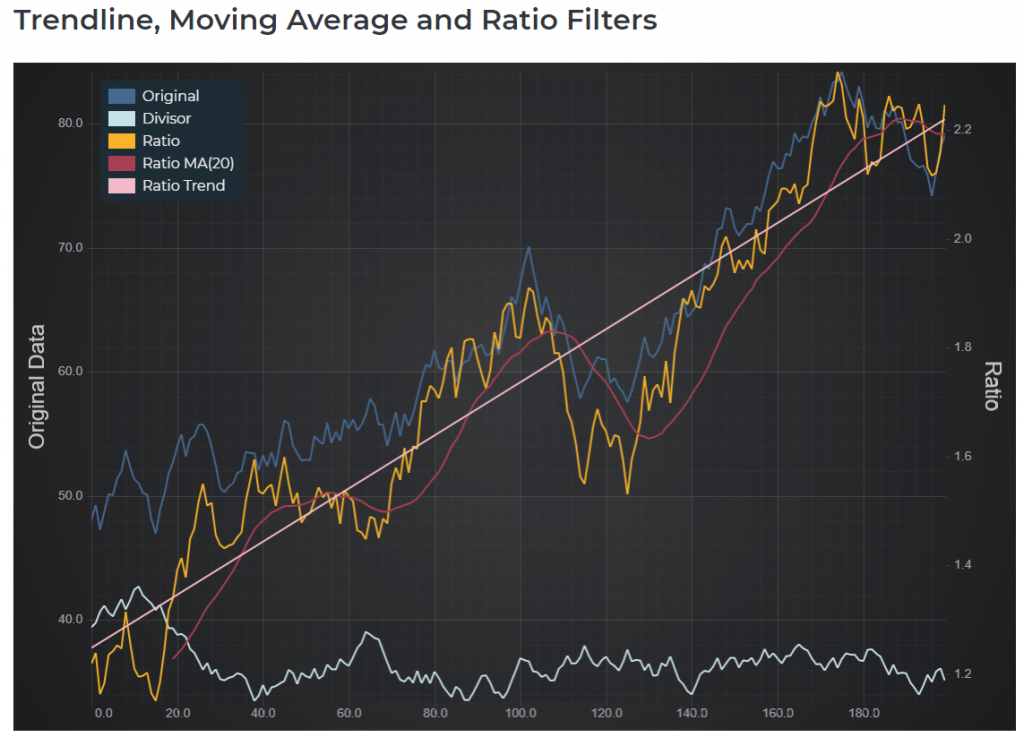
- New Custom Manual Legend control
- Allow rotating Axis Titles
- Update to Emscripten EMSDK v3.1 and Clang 17
- Reduction in wasm module file size
- Faster wasm module initialization
- More Documentation Improvements
- Multiple bugs fixed
- Multiple New Examples created
1/ Community Licensing
We’ve listened to feedback and have simplified the process of onboarding new users to SciChart.js.
Two changes we’ve made:
- SciChart.js v3.2 defaults to Community Licensing mode when you first download or use it
- We’ve created a new Getting-started page. No sign-up or installation of the licensing wizard is required to start using SciChart.js in community mode.
Who can use Community Licensing?
The community license may be used for free in non-commercial applications, academic or educational use, journalism and blogger/course-writer use including paid tutorials or programming courses. We’ve created a FAQ below with more details. The new Getting Started page can also be seen below. Community Licensing FAQGetting Started JS
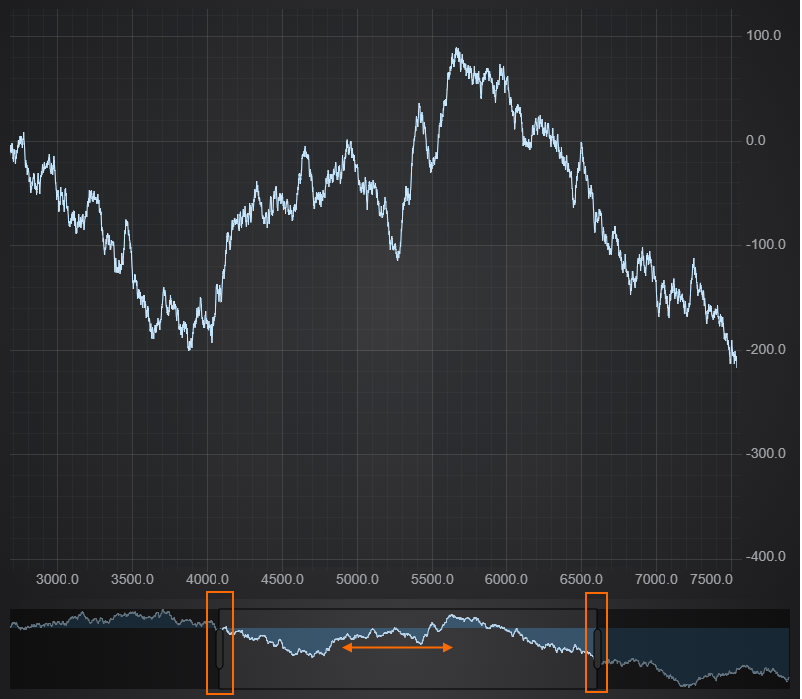
2/ DataSeries FIFO (First in first out) mode
A feature popular in WPF and Mobile versions of SciChart: we’ve added FIFO (First in First Out) mode to DataSeries in SciChart.js.
With a dataSeries in FIFO mode, the series will be filled with points appended up to the fifoCapacity. Once point count exceeds fifoCapacity, the oldest points will be discarded in a First-In-First-Out manner.
For example, given `DataSeries.fifoCapacity = 5`:
- Append [0,1,2], values = [0,1,2]
- Now Append [3], values = [0,1,2,3]
- Now Append [4,5], values = [1,2,3,4,5] (value 0 has been discarded)
- Now Append [6], values = [2,3,4,5,6] (value 1 has been discarded)
An example below:
What’s this used for?
FIFO mode is used for:
- Real-time monitoring with scrolling charts.
- Visualising streaming data from sensors.
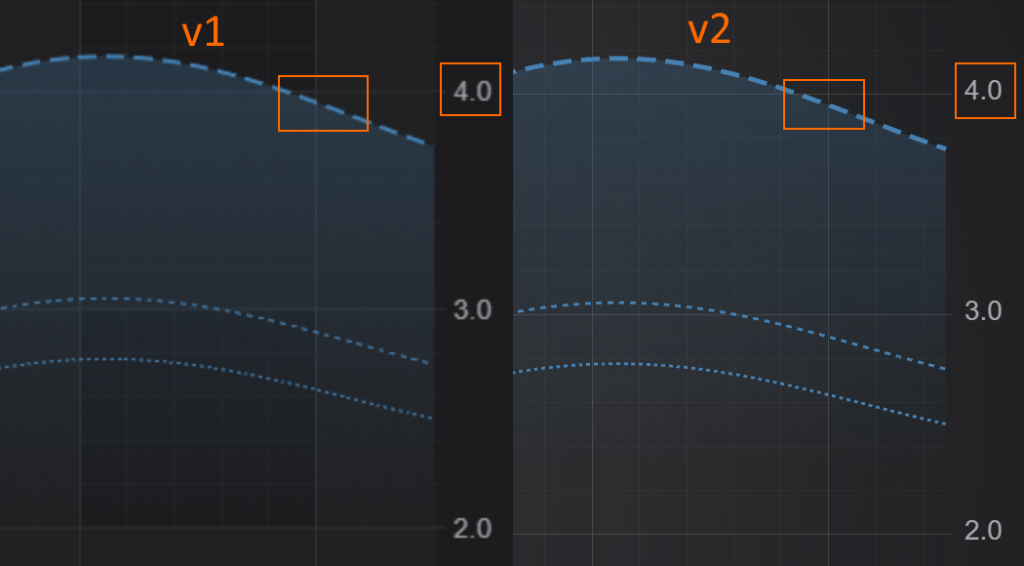
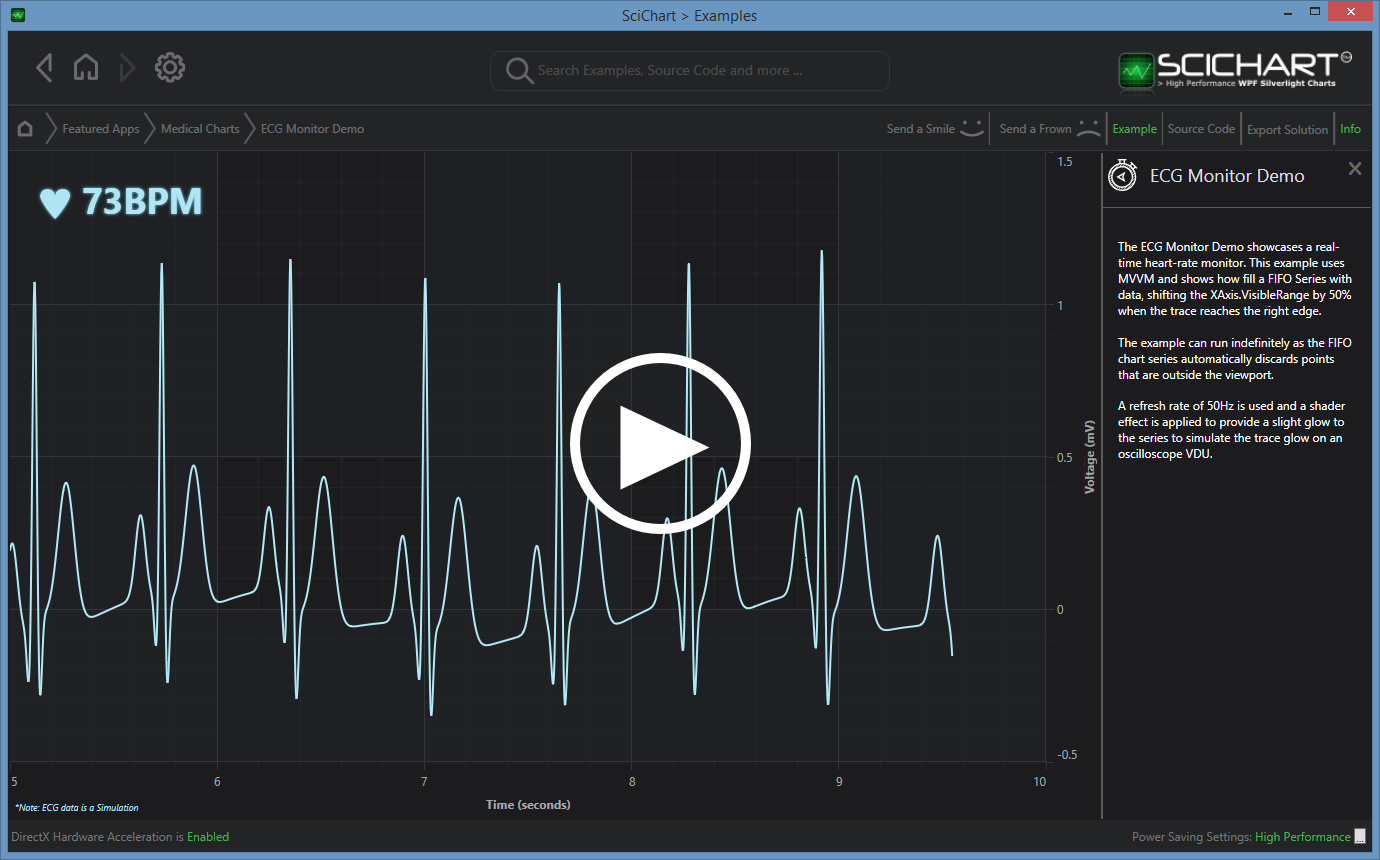
- Producing scrolling charts or sweeping charts like ECG/EKG monitors (see below).
- Anywhere you want to automatically discard old data, limiting memory consumption in long running apps with real-time updates.
How to use FIFO mode?
To initialise a DataSeries in FIFO mode, use the following constructor options:
const dataSeries = new XyDataSeries(wasmContext, {
    fifoCapacity: 1000
});

sciChartSurface.renderableSeries.add(new FastLineRenderableSeries(wasmContext, {
    dataSeries
}));
NOTE: When initialising in FIFO mode, all the memory is allocated up-front. The size and capacity of the series will equal fifoCapacity. When appending new data, old data will be discarded once fifoCapacity is exceeded.
DataSeries FIFO Documentation
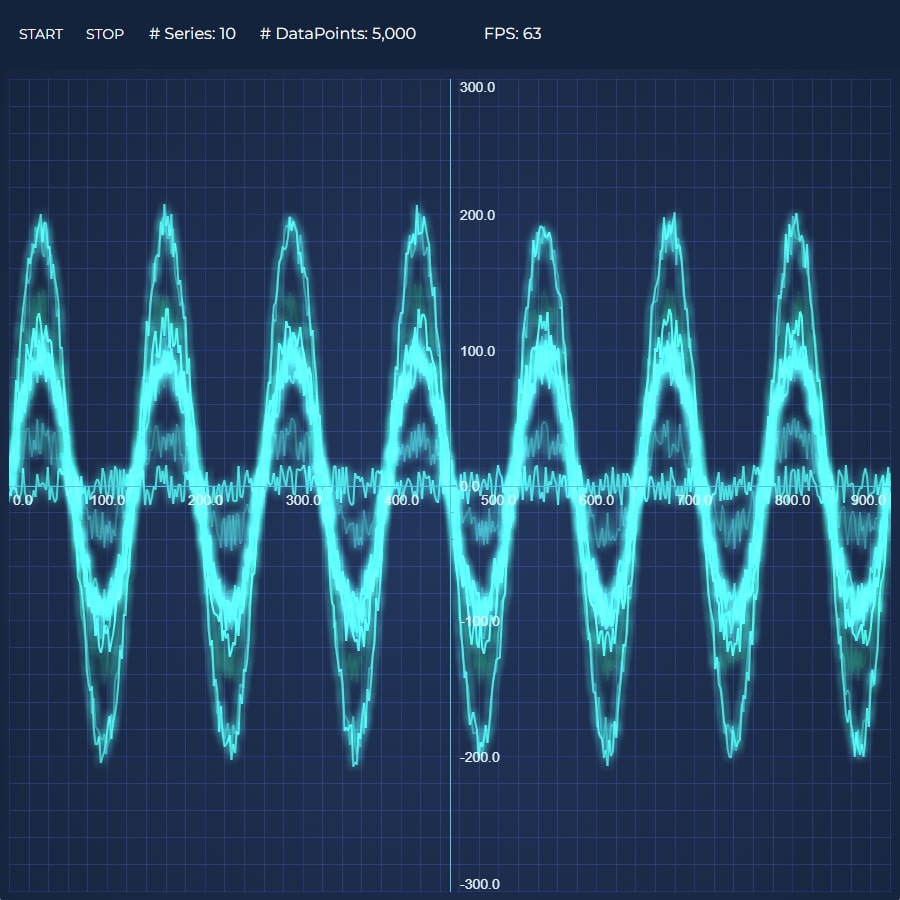
3/ DataSeries FIFO-Sweeping mode
We’ve added a new sweeping mode to dataSeries in FIFO mode which is exclusive to SciChart.js. This is enabled by setting DataSeries.fifoSweeping = true.
Instead of scrolling, a chart will now wrap-around when DataSeries.fifoCapacity is exceeded. This massively simplifies ECG/EKG style medical charts where the trace sweeps right to left of the chart.
An example below:
Fifo Sweeping Documentation
4/ DataSeries initialize with Capacity
SciChart DataSeries are designed to grow when calling DataSeries.append(), appendRange() using a geometric memory growth algorithm. Sometimes if the data size is known in advance this can result in over-allocation or several allocations of memory. By setting the DataSeries.capacity property you can specify the amount of memory to reserve up-front when creating a DataSeries.
Set DataSeries.capacity = N when you know in advance how many data-points will be appended, or to pre-allocate a block of memory, to reduce allocations and make performance that little bit faster.
DataSeries Docs
5/ Series PointMarker: lastPointOnly mode
A small featurette which makes it easy to display a point-marker on the last point of a series only. This is demonstrated in the FifoSweeping example above. Enable it by setting pointMarker.lastPointOnly = true. This is demonstrated in the ECG / Vital Signs monitor demo below.
JavaScript Vital Signs ECG/EKG Medical Demo
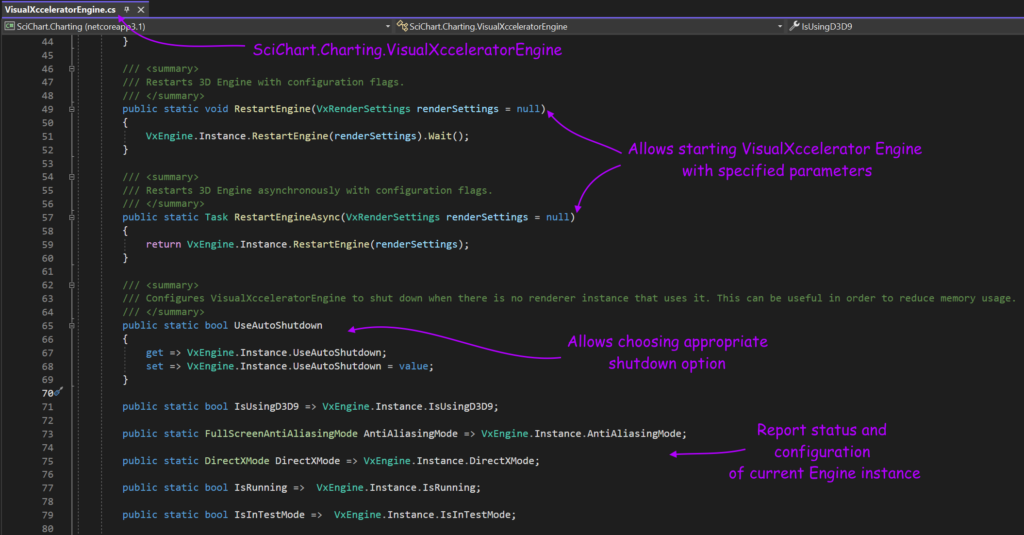
6/ Significant WebAssembly memory improvements
We’ve learned a lot about the WebAssembly memory model in the past few months, and have made some significant improvements to memory handling in SciChart.js.
Before this release: if you initialised SciChart.js with SciChartSurface.createSingle(), this resulted in a memory leak where each chart would hold on to its Wasm module & memory (wasm heap) even after the chart was deleted. In SciChart.js v3.2 once a SciChartSurface created with createSingle() is deleted by calling .delete(), and later garbage collected, the wasm heap associated with that chart will also be GC’d. This results in significant memory reductions in applications using SciChartSurface.createSingle().
When using SciChartSurface.create(), a single shared WebGL context and single instance of our 3D engine is created for the application. Before this release, memory leaking didn’t occur but you could still get memory fragmentation and unbounded growth of the wasm heap. In SciChart.js v3.2, once the last SciChartSurface created with create() is deleted by calling .delete() and later garbage collected, so long as the flag SciChartSurface.autoDisposeWasmContext = true the shared wasm heap will also be GC’d. This results in ability to reclaim all wasm memory in applications once you are finished with charts.
Read more at our Memory Best Practices docs below:
Memory Best Practices docs
7/ Memory leak debugging tools
A few of our customers were getting memory growth problems when using SciChart.js in long-running real-time monitoring applications. Usually this boils down to failing to call SciChartSurface.delete() (or series.delete(), annotation.delete() when adding/removing objects) or plain JavaScript memory leaks where references to SciChart are held in the customer application & not garbage collected by the browser. What we’ve learned is, it’s easy to capture an object in closure or otherwise inadvertently create a memory leak in JS! So, in order to debug our own memory usage (see #6 above) we’ve created some memory leak debugging tools. These are now shipped with the library in v3.2 and can be used in your own applications to check for JavaScript memory leaks, undeleted objects & help you achieve optimal memory consumption with SciChart.js. How to Use? In addition, we’ve gone through all our code and found and fixed some JavaScript memory leaks that were preventing memory from being garbage-collected once charts are no longer in use. As a result:
- the memory use of SciChart.js v3.2 is a significant improvement on v3.1 or earlier.
- You can also find & fix memory leaks in your own applications using SciChart.js with our easy to use tools.
Memory Debugging Tools
8/ Optional delete on remove/clear in collections
We’ve added a small featurette to the `ObservableArray` type used to store collections of series sciChartSurface.renderableSeries, annotations: sciChartSurface.annotations and so on. By passing an optional parameter to the .clear() function you can also call delete on children when removing. Before, this was required for best-practice and deletion of wasm memory:
const allSeries = sciChartSurface.renderableSeries.asArray();
sciChartSurface.renderableSeries.clear();
allSeries.forEach(rs => rs.delete());

const series = sciChartSurface.renderableSeries.get(i);
sciChartSurface.renderableSeries.removeAt(i);
series.delete();
After, you can do this:
// callDeleteOnChildren = true. Calls delete when clearing
sciChartSurface.renderableSeries.clear(true);

// callDeleteOnChildren = true. Calls delete when removing
sciChartSurface.renderableSeries.removeAt(i, true);
This makes it that little bit more succinct to delete wasm memory when updating the chart.
9/ Allow configuring WebGL Buffer sizes in low-memory environments
Each instance of the SciChart.js 3D Engine has a number of buffers which grow up to a maximum size when used. The max size of buffers if all features of SciChart.js are used could be 80MBytes of memory per engine instance. You can now limit the size of these buffers by setting the following property. Lower values will reduce performance slightly but will also lower memory usage. Default value is 8192kbytes and up to 10 buffers are created. Suggest experimenting with values down to (but not below) 1024kb in memory constrained applications.
SciChartDefaults.wasmBufferSizesKb = 1024;
Note: sciChartSurface.create() results in one engine instance shared across charts, sciChartSurface.createSingle() results in one engine instance per chart. This setting can result in significant application memory savings in the createSingle() case.
Memory Best Practices docs
10/ 2D/3D Touch Interaction improvements
Touch interaction has been greatly improved in SciChart.js v3.2, with the following changes:
- By default, we now set CSS property
touch-action: none on the SciChartSurface <div>. You can disable this by setting touchAction in the constructor options (see documentation)
- ZoomPanModifier now implements Pinch-Zoom functionality out of the box. This can be enabled/disabled by setting
ZoomPanModifier.enableZoom and controlled by setting horiontalGrowFactor and verticalGrowFactor properties (see documentation).
- Fixed a bug where Pinch Zoom would eat mouse events before other modifiers could consume them.
ZoomPanModifier / PinchZoomModifier Docs
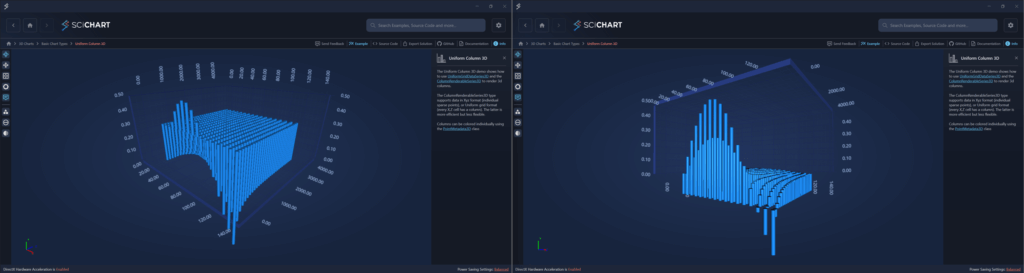
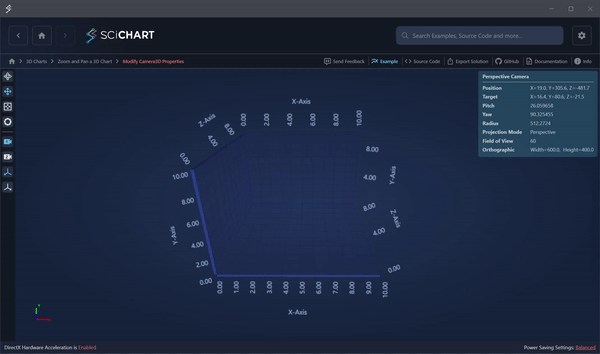
11/ 3D Point-Line chart type (PointLineRenderableSeries3D)
We’ve added a new chart type to SciChart.js 3D: the PointLineRenderableSeries3D.
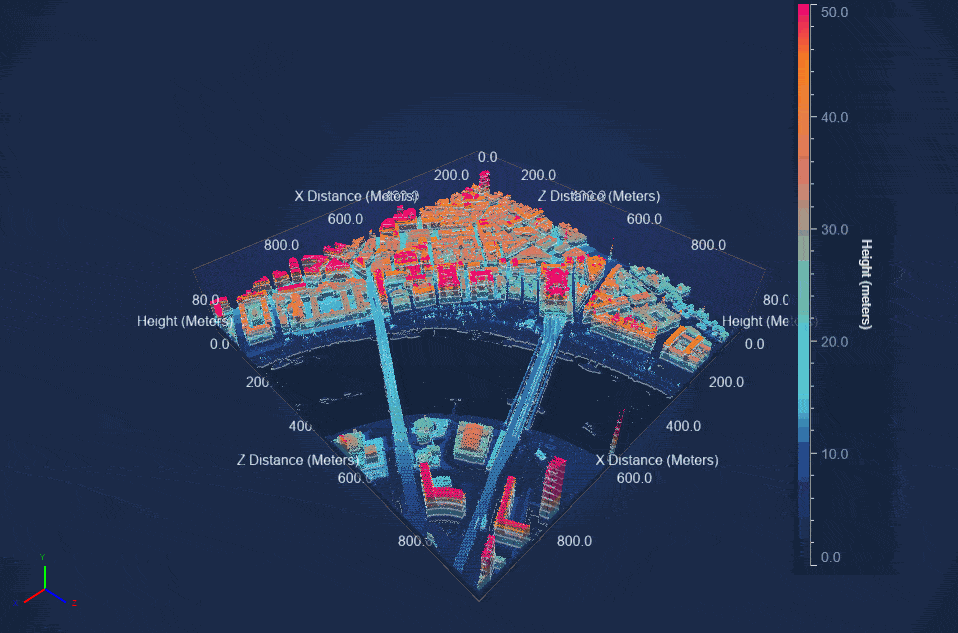
This allows you to draw line charts with optional heat palettes in 3D, like this Waterfall 3D demo
JavaScript Point Line 3D Chart Demo
Read more about the new Chart Type and how to configure it at the documentation.
3D Point Line Docs
12/ 3D Tooltips (TooltipModifier3D)
We’ve added a TooltipModifier3D type so you can add Tooltip behaviour to 3D Bubble, Scatter, Surface Mesh and Point-line Charts. See this in action in the 3D Chart Demos. To use this:
import { TooltipModifier3D } from "scichart";

sciChart3DSurface.chartModifiers.add(new TooltipModifier3D());
Read more about the TooltipModifier3D and how to configure it at the documentation.
13/ 3D Pinch Zoom
We’ve added a PinchZoomModifier3D type so you can add pinch zooming behaviour to 3D charts. To use it:
import { PinchZoomModifier3D } from "scichart";

sciChart3DSurface.chartModifiers.add(new PinchZoomModifier3D());
Read more about the PinchZoomModifier3D and how to configure it at the documentation.
14/ Allow Annotations below Gridlines
We’ve added some extra flags to allow you to place annotations below gridlines, whereas previously they could be placed below series only.
To achieve this, set the property annotation.annotationLayer = EAnnotationLayer.Background
See further annotation placement properties in the TypeDoc.
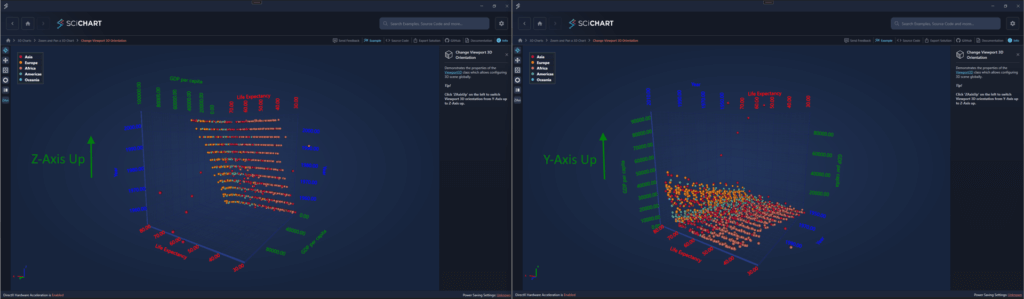
15/ New Custom (Manual) Legend Control
We’ve added a new Manual Legend control which allows you to override automatic creation of legend item rows and place any content into a legend on the chart.
Documentation will be written for this feature shortly, but for now you can see the feature used in the Quadrant Chart demo.
Here’s a quick example of how to add a manual legend to the chart:
    const legend = new ManualLegend({
        textColor: "black",
        backgroundColor: "#E0E0E077",
        items: [
            { name: "Bubble size represents population", color: "transparent", id:"pop", checked: false, showMarker: false },
            { name: "Bubble color indicates continent", color: "transparent", id:"col", checked: false, showMarker: false },
            { name: "Europe", color: appTheme.VividBlue, id:"Europe", checked: false },
            { name: "Asia", color: appTheme.VividPurple, id:"Asia", checked: false },
            { name: "North America", color: appTheme.VividPink, id:"NorthAmerica", checked: false },
            { name: "South America", color: appTheme.VividGreen, id:"SouthAmerica", checked: false },
            { name: "Oceania", color: appTheme.VividBlue, id:"VividTeal", checked: false },
            { name: "Africa", color: appTheme.VividOrange, id:"Africa", checked: false },
        ]
    }, sciChartSurface);
16/ Allow rotating Axis Titles
A very simple featurette, setting axis.axisTitleStyle.rotation now allows you to rotate axis titles!
17/ Update to Emscripten EMSDK v3.1 and Clang 17
This is a purely internal update, but worth a mention. We’ve updated our toolchain to use Emscripten / EMSDK v3.1 and Clang 17. This allows us to compile our C++ graphics engine into a Wasm module. Some benefits which resulted include the ability to take advantage of the latest features in WebAssembly, faster executing code & smaller wasm module sizes (see below).
18/ Reduction in Wasm Module File-size
Thanks to the Emscripten update above, the size of the compiled WebAssembly module size is now smaller. In SciChart.js v3.2:
- SciChart2d.wasm is now 350kBytes smaller
- SciChart3d.wasm is now 400kBytes smaller
19/ Faster Wasm module intialization
A smaller wasm module size results in faster WebAssembly initialisation. The static one-time cost of showing the first chart has been reduce by about ~100ms in SciChart.js v3.2 vs. v3.1 or below. More improvements are on the horizon as we identify savings in the library.
20/ More Documentation Improvements
We’re continuing the re-work of our documentation, including Codepen embeds and both JavaScript and Builder API examples (where applicable) in pages. Some pages we’ve updated or created in the docs since the last release:
- DataLabels API pages now have live embedded code samples (codepen)
- DataSeries API pages updated
- New DataSeries Realtime Updates page showing how to create charts in realtime with SciChart.js
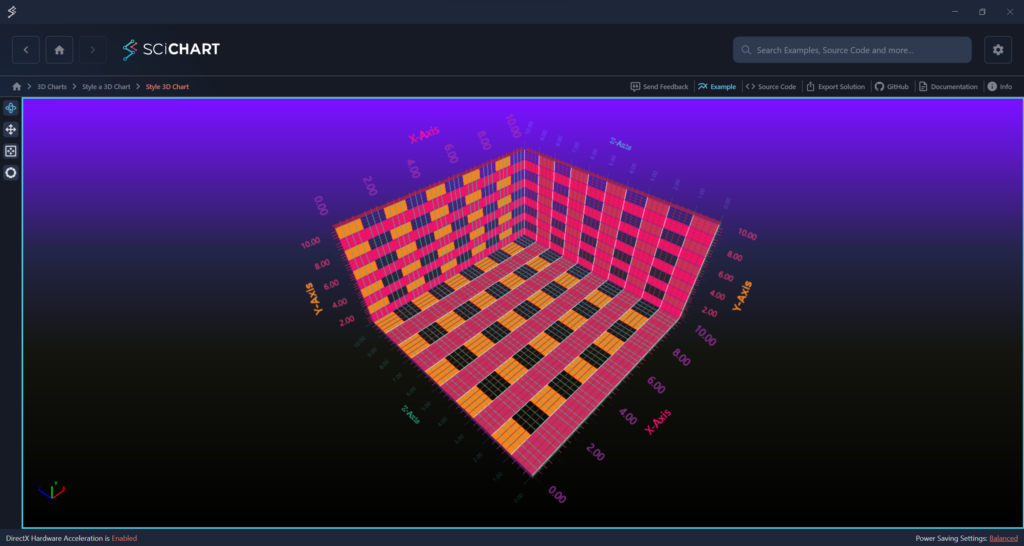
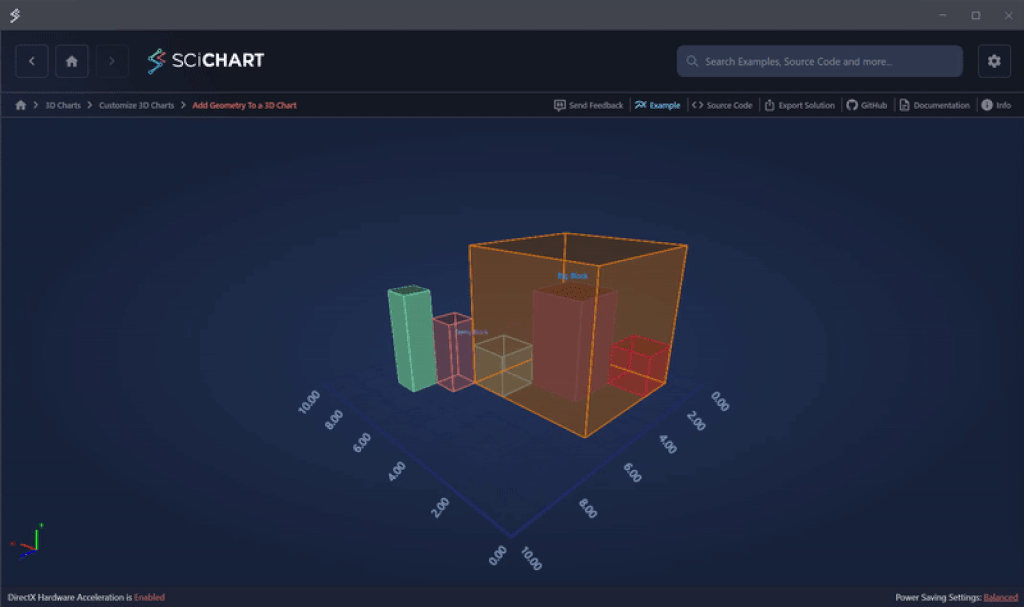
- 3D Chart documentation has been added.
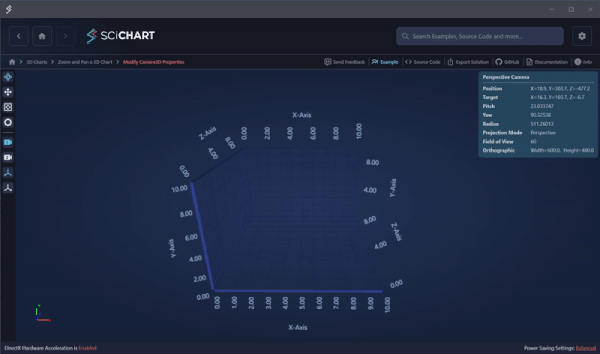
- New 3D World & Camera docs added
- New 3D Axis docs added
- New PointLineRenderableSeries3D (3D Line Chart) docs added
- New 3D zoom, orbit and rotate docs added
- New 3D tooltip docs added
21/ Multiple Bugs fixed
- SCJS-866 PinchZoomModifier eats mouse events if it is added before other modifiers
- SCJS-1113 Fixed UniformHeatmapRenderableSeries not updating if xStep, xStart, yStep, yStart changed
- SCJS-1302 Bug of Chart Overview when CTRL + A
- SCJS-1478 Autorange gives unexpected values when one series has constant values
- SCJS-1480 Rollover Tooltips don’t display outside the range of stacked axis
- SCJS-1483 Changing PointMarker in 3D Charts does not update the chart
- SCJS-1496 Crash on ZoomExtents over axis with IsAnimated false
- SCJS-1499 Constructor option for DataSeriesName on 3D DataSeries is ignored
- SCJS-1512 Can’t draw a line series on category axis with 2 points
- SCJS-1518 Drop full dependency on TypeScript, leaving only Dev dependency
- SCJS-1519 DataSeries.removeRange doesn’t resize native indexes
22/ Multiple new Examples Created
To demonstrate new features we’ve created multiple new examples or updated examples at demo.scichart.com.
These include:
Quadrant chart using Background Annotations
JavaScript Point Line 3D Chart Demo
Javascript Interactive Waterfall Spectrogram Chart
JavaScript Realtime Surface Mesh 3D Chart Demo
JavaScript Chart with Dynamic Layout
Pricing and Licensing
Existing customers with an active support & updates subscription will get the update for FREE. For new customers or prospects, please contact our sales team and we will be happy to help!
How to get SciChart.js v3.2
Developers – Node/WebPack
Check npm for the latest version.
npm install scichart
Don’t forget to see our Tutorials on setting up Npm projects with Webpack!
Developers – Browser Script
For developers using vanilla JavaScript (no Node Package Manager), you can load SciChart.js directly in browser. Add this script to your Html head and away you go.
// Add this script to head. For Prod we recommend setting a specific version number
// Include script from https://www.jsdelivr.com/package/npm/scichart
<script src="https://cdn.jsdelivr.net/npm/scichart@3/index.min.js" crossorigin="anonymous"></script>

// Import your types
const { SciChartSurface, NumericAxis, FastLineRenderableSeries } = SciChart;

// Now Configure SciChartSurface in code to load the wasm file from CDN
SciChartSurface.useWasmFromCDN();

// Now create a SciChartSurface as you would normally!
const { sciChartSurface, wasmContext } = await SciChartSurface.create("div-id");
Developers – Getting Started Guides
We’ve created an entirely new and improved Getting Started page for SciChart.js. Go take a look!
If you have any questions just ask!
Best regards,
Andrew
[SciChart Team]
The post SciChart.js v3.2 Released! appeared first on SciChart.
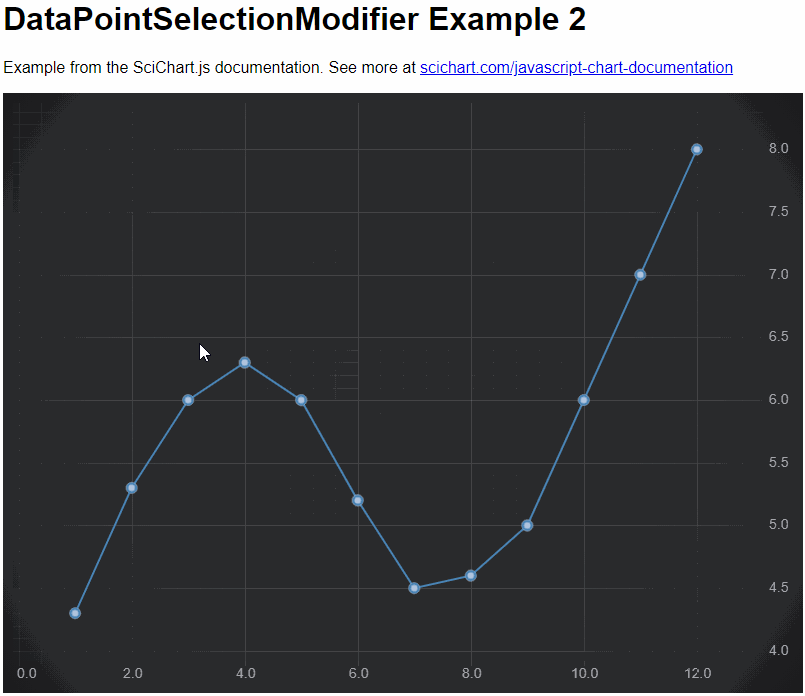
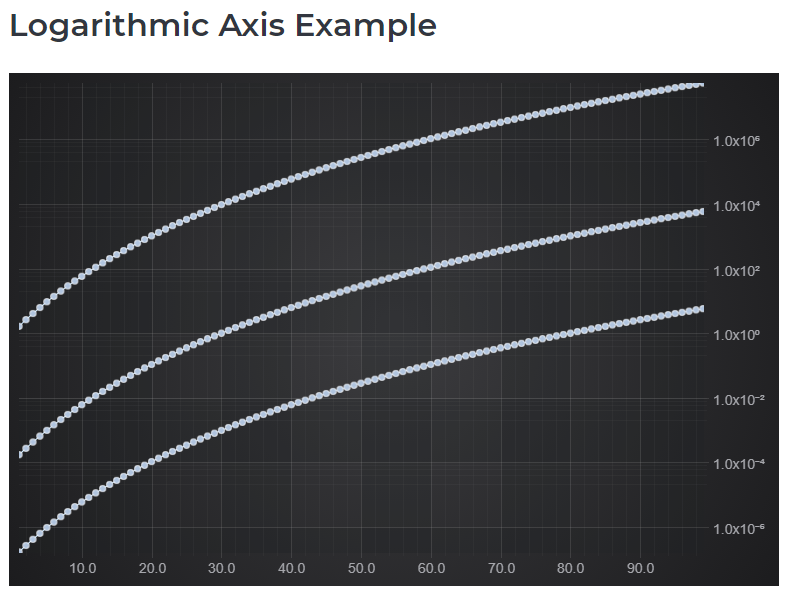
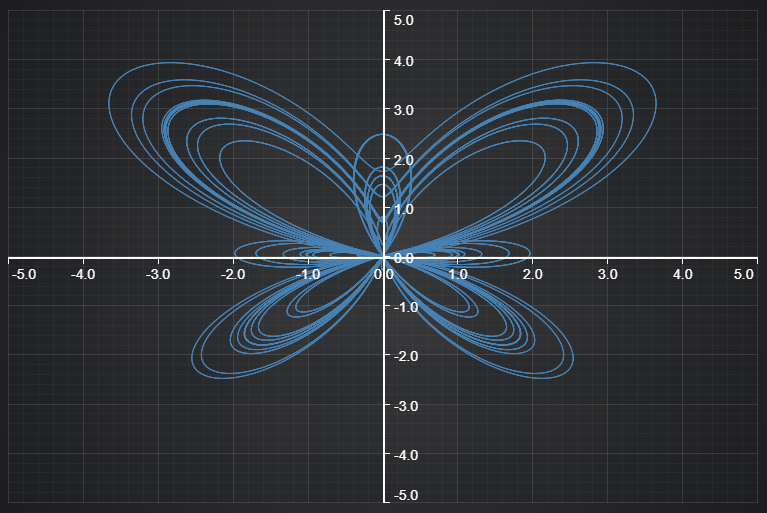
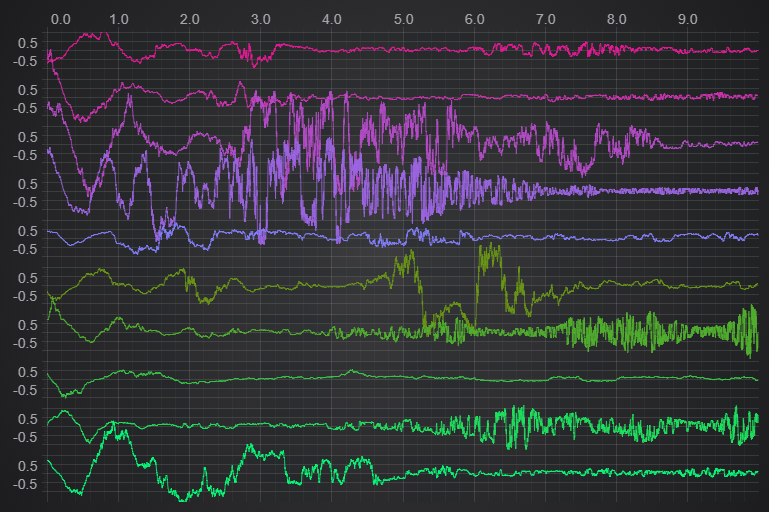


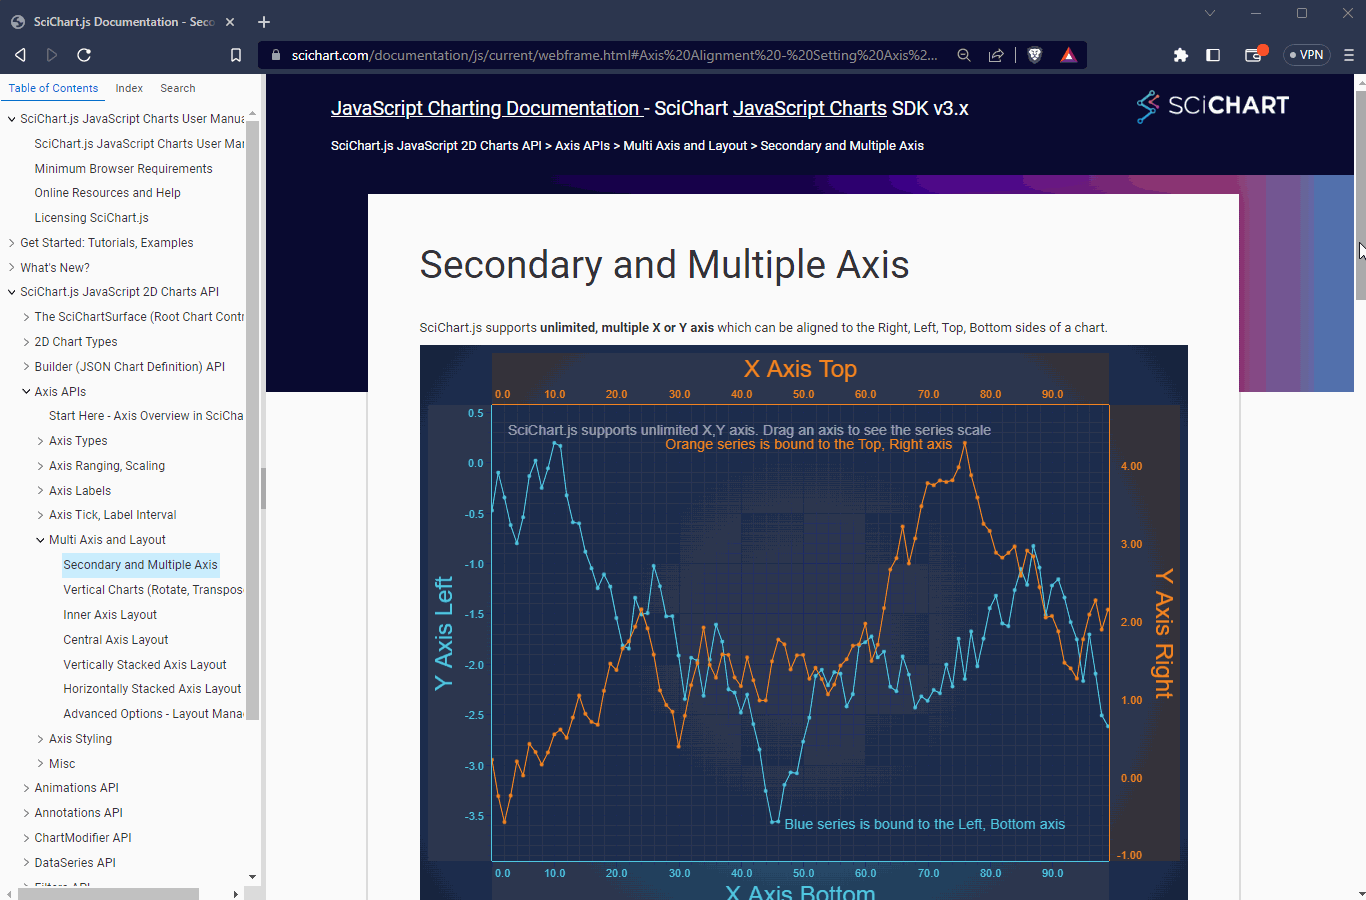 Check out some examples of the new and updated documentation pages below:
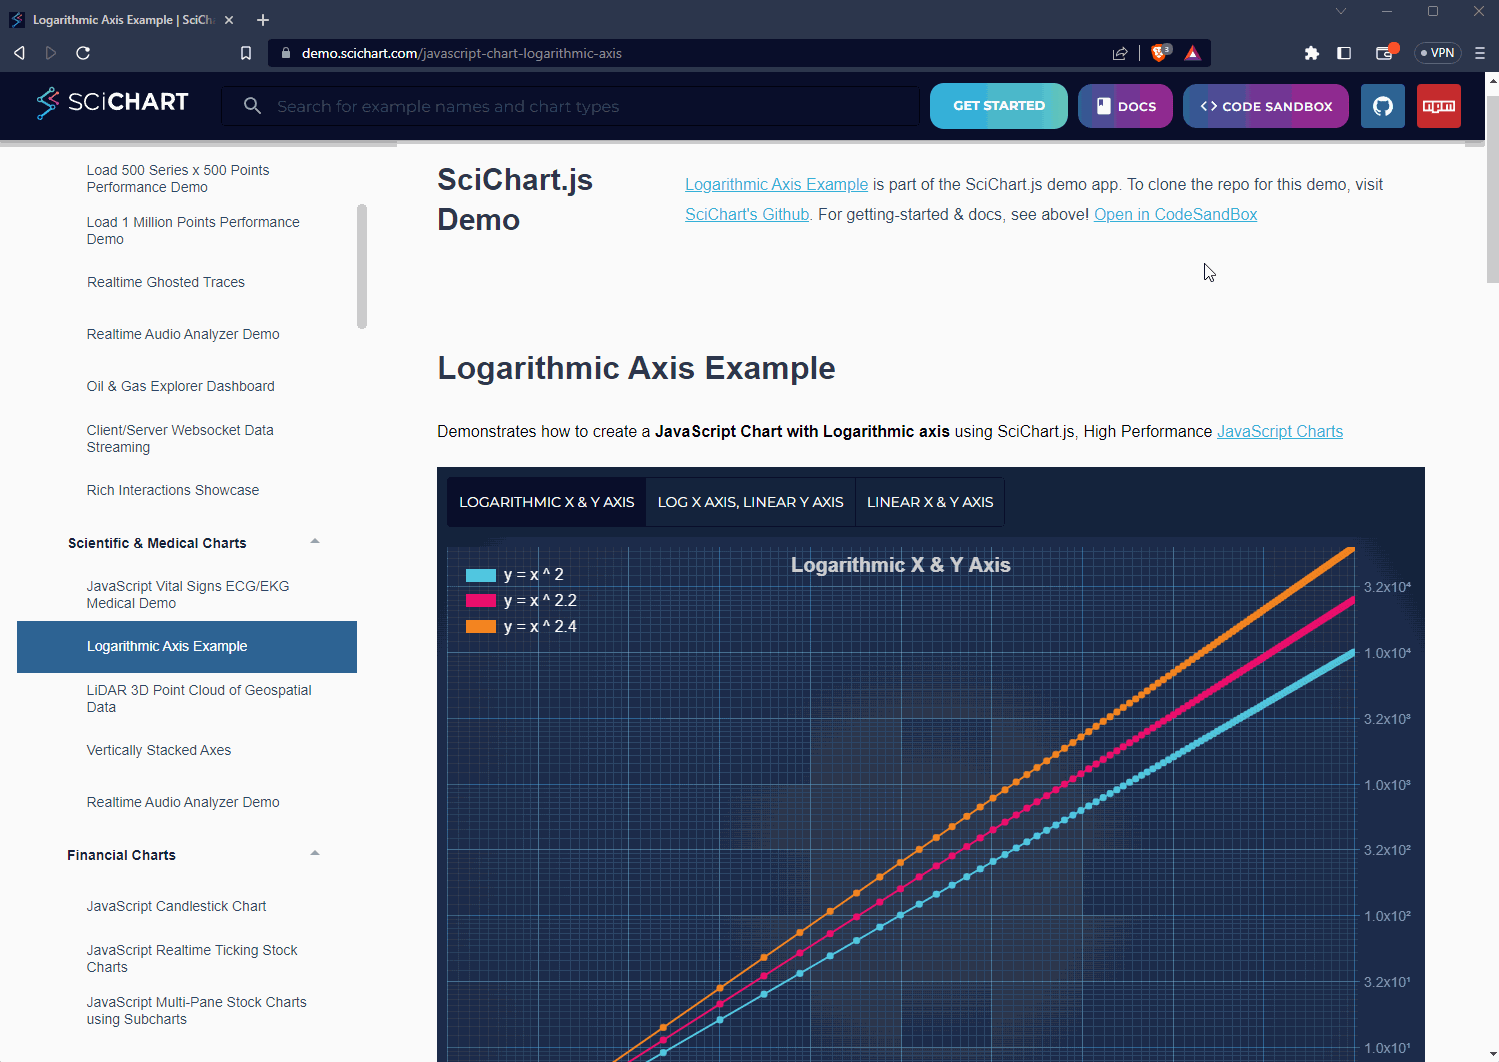 The same toolbar can be seen here when viewing the example from our website, e.g. from
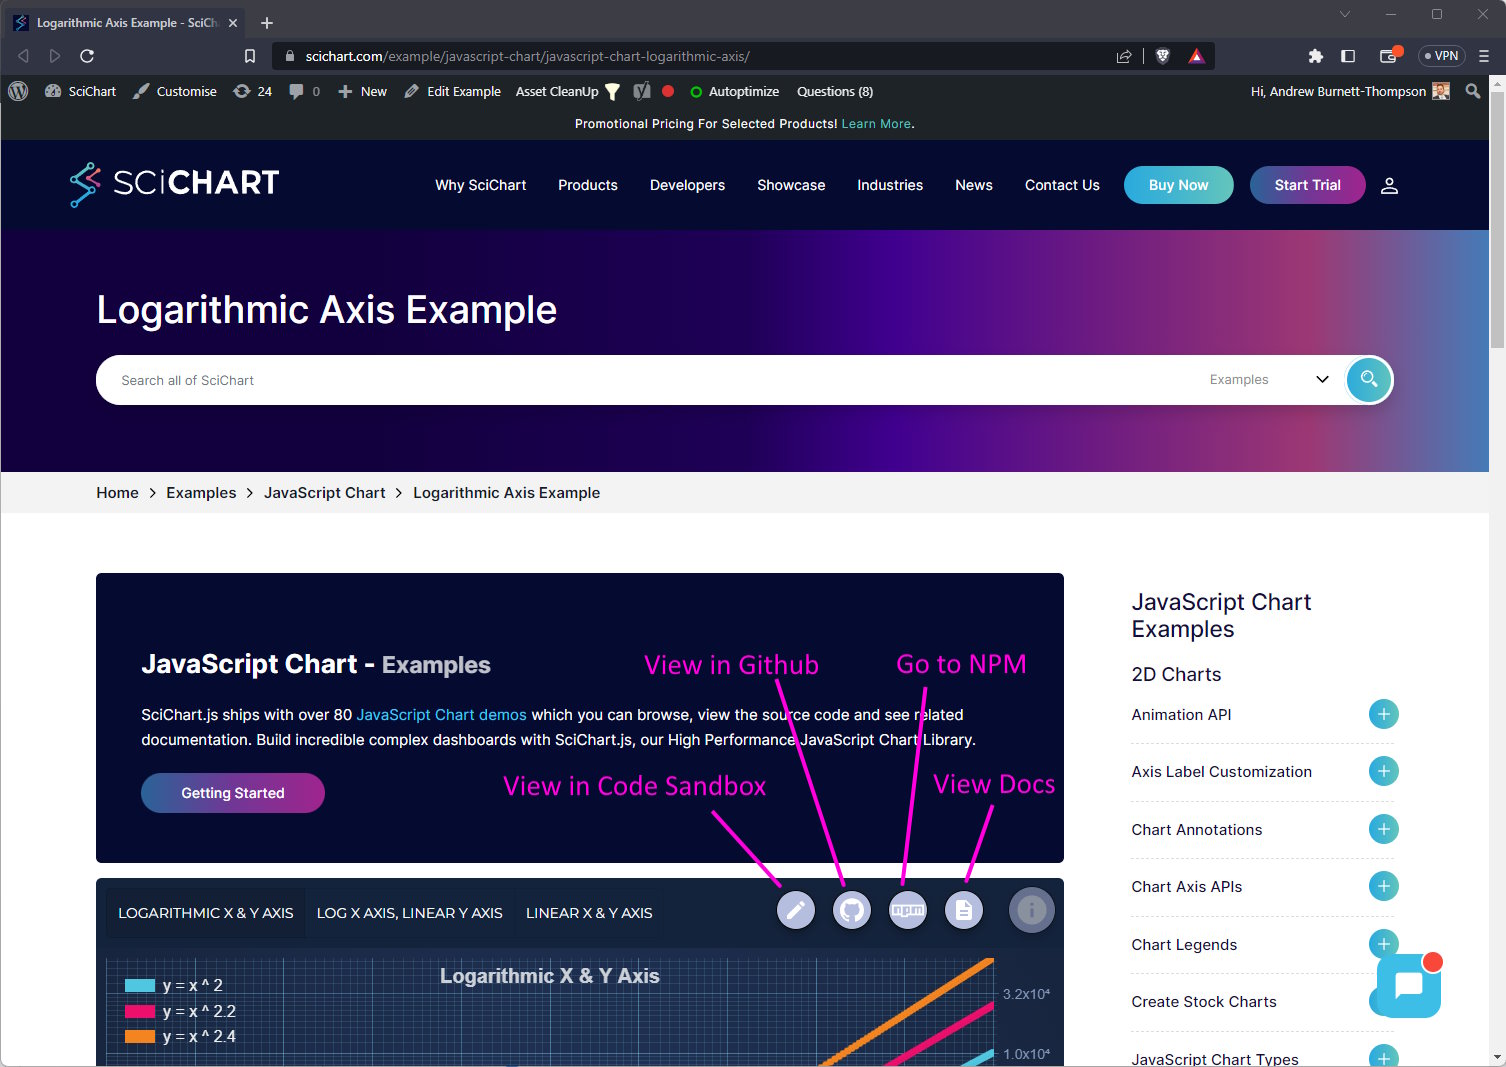


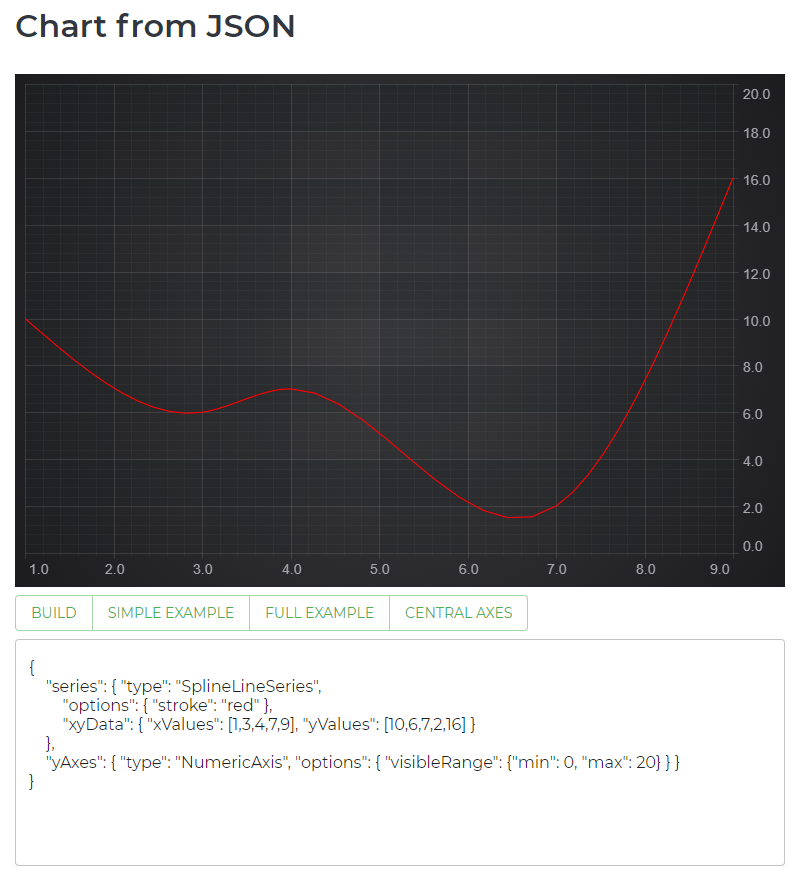
 Above: