We are delighted to announce that the SciChart.js v2.1 build 2267 has now been released!
This backward-compatible update includes a number of improvements, fixes and some massive performance improvements for big-data & realtime rendering.
This release is a drop-in replacement and it is backward compatible for users of SciChart.js version 2.
What’s New in SciChart.js v2.1?
Major Performance Improvements in v2.1
We’ve used our expertise high performance computing in other platforms of SciChart to make massive improvements to chart rendering, updating and startup speed in SciChart.js v2.1.
Here is a quick summary of the improvements.
DataSeries Creation & Updating Speed
For big-data applications or dynamically updating charts, a large bottleneck was simply the time to create and update data.
By looking at memory optimisation and taking advantage of low-level code optimisations in WebAssembly we’ve improved the following DataSeries operations significantly, which results in much faster, more responsive charts. Especially noticeable in dynamic or real-time contexts.
| DataSeries Operation | Before | After | Improvement |
| Create a DataSeries with 1Million Datapoints | 35ms | 10ms | 3.5x faster! |
| Get XRange for DataSeries with unsorted data (required for auto ranging) | 550ms | 3.4ms | 161x faster! |
| Optimising DataSeries.clear() & append() with 1M datapoints (required for dynamically updating charts) | 386ms | 4.68ms | 82x faster! |
| Optimising DataSeries.getNativeIndices() with 1M datapoints (required for candlestick charts) | 367ms | 22ms | 16x faster! |
| DataSeries.insertRange() with 1k datapoints (required for prepending or inserting data) | 132ms | 0.69ms | 191x faster! |
| DataSeries.removeRange() with 1k datapoints (required for removing a block of data) | 730ms | 0.33ms | 2,212x faster! |
Data interactions with SciChart.js are now significantly faster, whether you are manipulating data frequently in a Js chart, dynamically updating charts or simply visualising big datasets, you will notice large performance improvements when using SciChart.js v2.1 over previous versions.
Introducing Smart Data-point Resampling
Our Windows, mobile (iOS/Android) versions of SciChart have included data-point resampling for a long time. Datapoint resampling ensures the minimum viable data-set is displayed on the screen. Resampling is intended to be visually lossless, and automatic. It occurs for RenderableSeries before the series is rendered, if required.
This code, being part of our Visual Xccelerator Engine in C++ has now been included in SciChart.js WebAssembly module and brings massive performance improvements to SciChart.js for big-data scenarios.
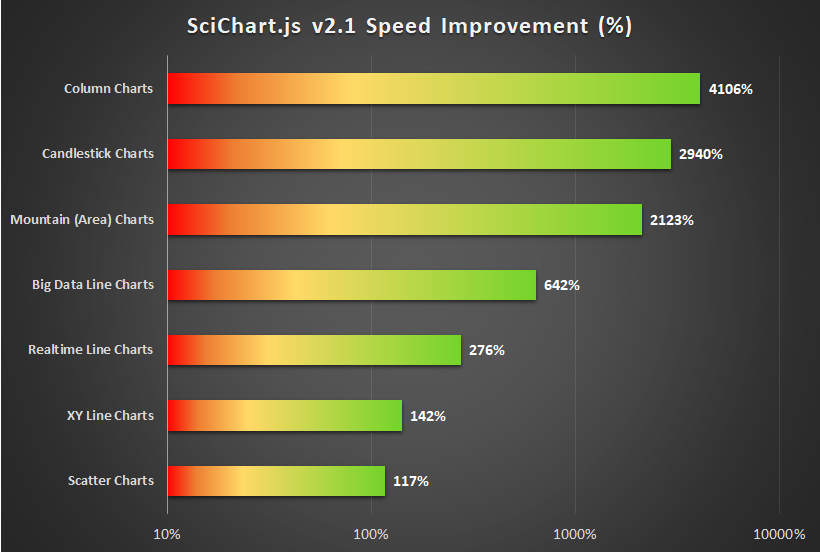
Compared to version 2.0, SciChart.js v2.1 has significant performance improvements for chart rendering:
Other Performance Improvements
- Improved raw drawing speed of our underlying graphics engine by over 100%
- Improved performance of charts with RolloverModifier tooltips
- Added Async Label Creation option with global application or per-chart caching (see documentation)
- Optimised data transfers from JavaScript to WebAssembly
Performance Results
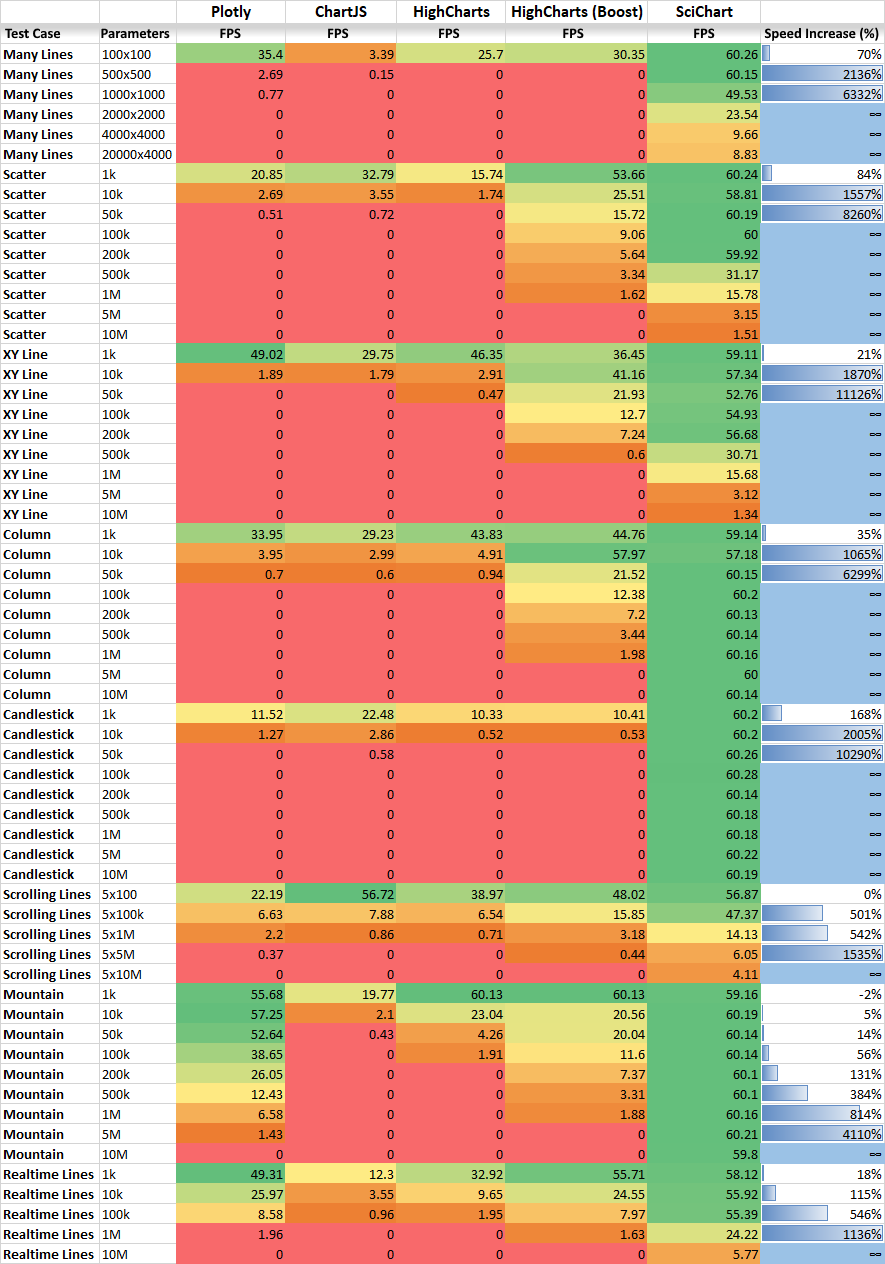
We’ve compared a number of JavaScript Chart Libraries such as Plotly.js, HighCharts, Chart.js vs. SciChart.js to evaluate chart drawing performance and published the results in a second article: SciChart is the Fastest JS Chart Library – and why that matters in today’s world.
SciChart.js is the Fastest JS Chart Library available
Here’s why that matters in today’s world
Most JavaScript Chart Libraries can render a few thousand points before slowing down. Big-Data is a trend across industries and the amount of data is only getting bigger. If the speed of your JS Chart Library is not an issue now, it will be soon.
Improvements to SciChart.js and Documentation
- Auto-detecting data distribution flags in DataSeries (flags dataSeries.isSorted, dataSeries.containsNaN). Specifying these flags gives better performance in big-data scenarios.
- Added labels support outside of a Pie Chart
- Added Documentation of how to use SciChart.js in vannilla HTML/Js (without npm) using our Browser Bundle served by CDN
- Added Documentation for Performance Tips & Tricks
- Added Documentation for new Data-point Resampling features
- Added Documentation & Examples for new Generic Animations API
- Added Generic Animations example to the Demo app
- Optimizations for Annotation notifyPropertyChange method not to be called if the property has not changed
- Better error message if wasm cannot be loaded, or the wrong version loaded
- Add a property to configure stacked axis length (SCJS-954)
- Allow passing div element reference into SciChartSurface.create to make SciChart.js possible to use in shadow DOM (SCJS-974)
- Display performance warnings in dev environment (SCJS-984)
- Improve guard checks for data series creation (SCHS-981)
- Snap RolloverModifier vertical line to data points (SCHS-623)
- Optimize getXRange() algorithm for unsorted data (SCJS-888)
- Optimize filling wasm memory from js (SCJS-911)
- Add explanation error message for trial expired on old version (SCJS-886)
- Add AxisRenderer.axisSize property which allows setting axis label width
- Add includeAxis property to MouseWheelZoomModifier
- Add AxisRenderer.axisThickness (SCJS-953)
- Prevent CursorModifier axis labels to be cut out of the chart (SCJS-980)
- Improve chart performance when using RolloverModifier and CursorModifier
Bug Fixes in SciChart.js v2.1
- Fix an error for LineAnnotation with a hidden label (SCJS-850)
- Fix several SciChartOverview-related bugs: handling flipped coordinates properly (SCJS-839), setting initial overview range and area correctly (SCJS-851), a scrolling issue (SCJS-839), updating SciChartOverview dimmed annotations (SCJS-885), setting overview visible range to main chart visible range (SCJS-943), visible range limit (SCJS-941), LogarithmicAxis (SCJS-942),
- Several SciChartOverview improvements: allow passing surface and axis options on overview create (SCJS-873), support for CategoryAxis
- Fix a resize surface issue for annotation adorner layer (SCJS-844)
- Added FloatArray64 array support for DataSeries
- Fix MouseWheelZoomModifier zooming in issue for LogarithmicAxis (SCJS-881)
- Fix axis labels population for flipped coordinates (SCJS-884)
- Fix RolloverModifier tooltip to use the series stroke as the default color (SCJS-776)
- display the trial watermark correctly for small charts (SCJS-892)
- Fix clearing the legend with sciChartSurface.chartModifiers.clear() (SCJS-916)
- Fix a caching problem for SmartLabelProvider (SCJS-920)
- Fix mouse wheel and zoom extends on inner axis with applyToChart property set to False
- Fix annotation borders calculation to take into account xCoordShift (SCJS-959). This bug resulted in an incorrect hit-test for annotations.
- Fix drawing render context annotations below series (SCJS-919)
- Fix rendering category axis without data (SCJS-946)
- Fix RolloverModifier tooltips bug (SCJS-975)
- Fix CursorModifier to apply axisLabelFill and axisLabelStroke correctly (SCJS-979)
- Fix an infinite loop problem for multiple charts (SCJS-988)
- Fix RolloverModifier error when it was used without a data series
- Fix runtime license not applied if it has started looking for license wizard (SCJS-991)
- draw gradient correctly when canvas resize (SCJS-826)
- Handle visibleRangeLimit properly when scrolling (SCJS-962)
Pricing & Licensing
Existing customers with an active support & updates subscription will get the update for FREE.
For new customers or prospects, please contact our sales team and we will be happy to help!
How to get SciChart.js v2.1
Developers – Node/WebPack
npm install scichartDon’t forget to see our Tutorials on setting up Npm projects with Webpack!
Developers – Browser Script
For developers using vanilla JavaScript (no Node Package Manager), you can load SciChart.js directly in browser. Add this script to your Html head and away you go.
// Add this script to head
<script src="https://cdn.jsdelivr.net/npm/scichart@2.1.2267/_wasm/scichart.browser.js" crossorigin="anonymous"></script>

// Now Configure SciChartSurface in code to load the wasm file from CDN
SciChart.SciChartSurface.configure({
    dataUrl: "https://cdn.jsdelivr.net/npm/scichart@2.1.2267/_wasm/scichart2d.data",
    wasmUrl: "https://cdn.jsdelivr.net/npm/scichart@2.1.2267/_wasm/scichart2d.wasm"
});
// Now create a SciChartSurface as you would normally!
const { sciChartSurface, wasmContext } = await SciChart.SciChartSurface.create("div-id");
Developers – Getting Started Guides
We’ve collected all the links to help you get started under scichart.com/downloads. Go there and take a look. If you have any questions just ask!
Best regards,
Andrew
[SciChart Team]
The post SciChart.js v2.1 Released! appeared first on Fast, Native Charts for WPF, iOS, Android, JavaScript .